Page 18 of 18 FirstFirst ... 8 16 17 18
Results 171 to 175 of 175

Daily Forex Analysis By FXGlory

This is a discussion on Daily Forex Analysis By FXGlory within the Analytics and News forums, part of the Trading Forum category; USDCHF H4 Daily Technical and Fundamental Analysis for 12.30.2024 Time Zone: GMT +2 Time Frame: 4 Hours (H4) Fundamental Analysis: ...


  1. #171
    Senior Member FXGlory Ltd's Avatar
    Join Date
    Mar 2024
    Posts
    176

    Visit FXGlory Ltd's Youtube Channel
    USDCHF H4 Daily Technical and Fundamental Analysis for 12.30.2024


    Time Zone: GMT +2
    Time Frame: 4 Hours (H4)


    Fundamental Analysis:
    The USD/CHF currency pair reflects the exchange rate between the US Dollar (USD) and the Swiss Franc (CHF). Today's focus lies on two significant economic events. For the USD, the Chicago PMI and Pending Home Sales reports are expected to provide insights into the health of the US economy. A higher-than-forecast Chicago PMI would indicate expansion in business activity, supporting the USD. Meanwhile, robust Pending Home Sales data could strengthen the dollar further by reflecting healthy consumer demand. On the CHF side, the KOF Economic Barometer release is expected to give a forward-looking view of the Swiss economy. A stronger reading than forecast may boost the CHF, though the overall impact is likely to be moderate compared to the USD’s key data releases.


    Price Action:
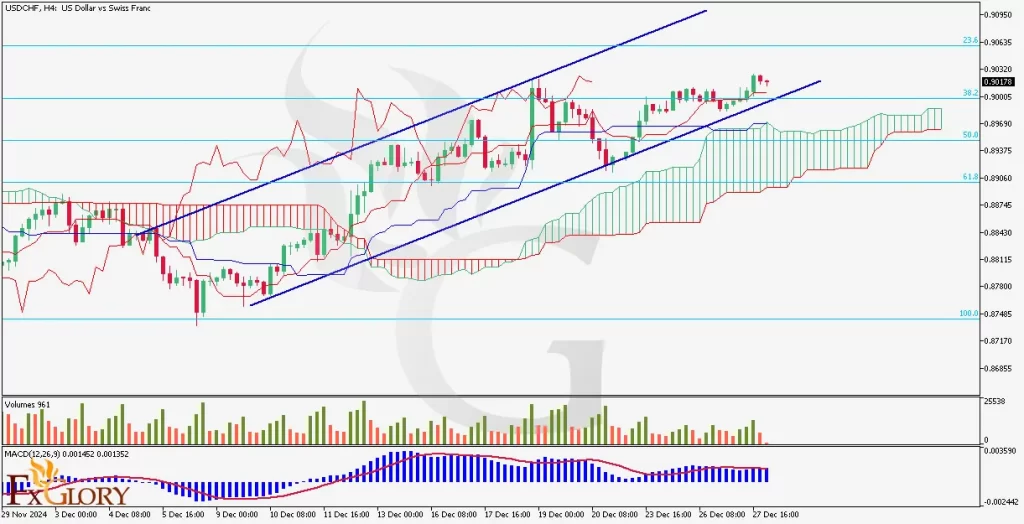
    The USDCHF forex pair on the H4 chart remains in a bullish trend, trading within a well-defined ascending channel. Despite the last two bearish candles, the overall momentum stays intact, with the price consolidating near the 23.6% Fibonacci retracement level. The USD-CHF pair is currently positioned above the Ichimoku cloud, signaling a continuation of bullish sentiment. Buyers remain in control, but the price is showing signs of testing minor resistance at the upper boundary of the channel.


    Key Technical Indicators:
    IchiMoku Cloud:
    The USD CHF price is trading above the Ichimoku cloud, confirming a bullish trend. While the last two candles show minor pullbacks, the bullish momentum remains intact, as the price sustains its position above the cloud, indicating a strong support zone.
    Volumes: The volume bars indicate a decrease in buying activity, with the last two candles accompanied by red volume bars. This suggests a slowdown in bullish momentum, warranting caution as the price approaches key resistance levels.
    MACD (Moving Average Convergence Divergence): The MACD histogram remains positive, with the MACD line staying above the signal line. However, there are signs of waning momentum, as the histogram shows a slight reduction in bullish pressure. This could indicate potential consolidation before the next upward move.


    Support and Resistance Levels:
    Immediate Support:
    0.90000, aligned with the lower boundary of the ascending channel and the 38.2% Fibonacci level.
    Key Resistance: 0.90635, corresponding to the 23.6% Fibonacci retracement level and the upper boundary of the channel.


    Conclusion and Considerations:
    The USDCHF pair remains in a bullish trend on the H4 chart, supported by the Ichimoku cloud and the ascending channel. However, caution is advised as the last two bearish candles and declining volume indicate a potential consolidation phase. Traders should monitor the upcoming Chicago PMI and KOF Economic Barometer releases, as they could trigger increased volatility and influence the USDC/HF pair's direction. A breakout above 0.90635 would confirm further bullish momentum, while a drop below 0.90000 may signal a short-term reversal.


    Disclaimer: The analysis provided for USD/CHF is for informational purposes only and does not constitute investment advice. Traders are encouraged to perform their own analysis and research before making any trading decisions on USDCHF. Market conditions can change quickly, so staying informed with the latest data is essential.


    FXGlory
    12.30.2024

  2. #172
    Senior Member FXGlory Ltd's Avatar
    Join Date
    Mar 2024
    Posts
    176

    Visit FXGlory Ltd's Youtube Channel
    XRPUSD H4 Technical and Fundamental Analysis for 12.31.2024


    Time Zone: GMT +2
    Time Frame: 4 Hours (H4)


    Fundamental Analysis
    The XRP/USD pair is influenced by both cryptocurrency market dynamics and broader financial indicators. Currently, XRP is experiencing a slightly bearish trend influenced by reduced liquidity due to upcoming financial events. The latest news indicates that German banks will be closed in observance of New Year's Eve, leading to low liquidity and irregular volatility in the forex markets. Additionally, upcoming releases from Standard & Poor's and FHFA on January 28, 2025, regarding housing prices are expected to impact the USD positively if the actual figures exceed forecasts. These fundamental factors suggest potential downward pressure on XRPUSD in the short term, as traders navigate through lower liquidity and anticipate key economic data releases.


    Price Action
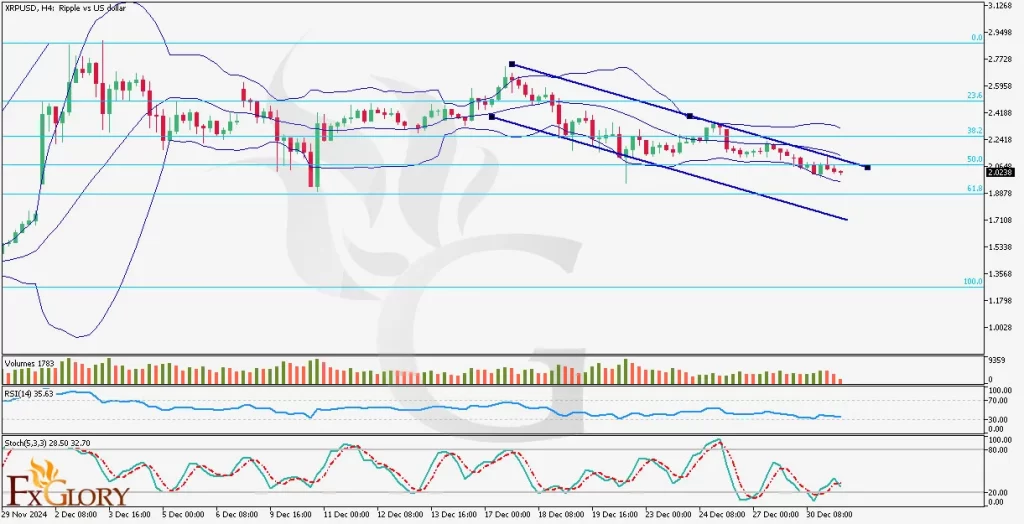
    The XRP/USD pair on the H4 timeframe is currently in a slightly bearish trend. Over the past week, the price has been consolidating in the lower half of the Bollinger Bands, oscillating between the lower and middle bands. Recent candlestick patterns indicate a series of lower highs and lower lows, reinforcing the bearish sentiment. Additionally, the trading volume has been decreasing, suggesting a lack of strong buying interest, which may lead to further downside movement if the bearish trend continues.


    Key Technical Indicators
    Bollinger Bands:
    The XRP/USD pair is trading within the lower half of the Bollinger Bands, positioned between the lower band and the middle band. This placement indicates a slightly bearish trend, as the price struggles to break above the middle band. The narrowing of the Bollinger Bands suggests a potential decrease in volatility, which could precede a significant price movement either upwards or downwards.
    Volumes: Trading volumes for XRPUSD have been on a downward trend, signaling reduced market participation. Lower volumes often precede trend reversals or continuation, depending on other indicators. In this case, the declining volumes support the current bearish outlook, as diminished buying interest fails to sustain the price above the middle Bollinger Band.
    RSI (Relative Strength Index): The RSI for XRP USD is currently hovering around 40, below the neutral level of 50. This positioning indicates that the pair is in a slightly bearish territory, with potential for further declines. The RSI trend suggests that selling pressure may continue, although it is not yet in oversold territory, leaving room for additional bearish momentum.
    Stochastic Oscillator: The Stochastic Oscillator is reflecting bearish momentum, with readings below 50 and moving towards the oversold region. This suggests that the downward movement may persist, as the oscillator indicates sustained selling pressure. However, traders should remain cautious of potential reversals if the oscillator starts to climb from the oversold levels.


    Support and Resistance
    Support:
    The price is currently approaching the 61.8 Fibonacci level, which serves as a strong support zone. This level is expected to provide a significant barrier against further declines, where buying interest may emerge to stabilize the price.
    Resistance: On the upside, the 50.0 Fibonacci level acts as an important resistance area. If the price attempts to rise towards this level, selling pressure is likely to increase, preventing further upward movement and potentially causing the price to retreat.


    Conclusion and Considerations
    The XRP USD pair on the H4 chart is currently exhibiting a slightly bearish trend, supported by the price action within the lower half of the Bollinger Bands and declining trading volumes. Key technical indicators such as RSI and the Stochastic Oscillator reinforce the bearish sentiment, although they do not yet indicate oversold conditions. Traders should monitor the support levels at 0.65 and 0.60 for potential buying opportunities, while resistance at 0.70 and 0.75 may act as barriers to upward movement. Additionally, upcoming economic news, including the closure of German banks and housing price reports from Standard & Poor's and FHFA, could introduce further volatility and influence the USD, thereby impacting the XRP-USD pair. It is advisable to stay cautious and consider these fundamental factors when making trading decisions.


    Disclaimer: The analysis provided for XRP/USD is for informational purposes only and does not constitute investment advice. Traders are encouraged to perform their own analysis and research before making any trading decisions on XRPUSD. Market conditions can change quickly, so staying informed with the latest data is essential


    FXGlory
    12.31.2024

  3. #173
    Senior Member FXGlory Ltd's Avatar
    Join Date
    Mar 2024
    Posts
    176

    Visit FXGlory Ltd's Youtube Channel
    EUR/USD H4 Technical and Fundamental Analysis for 01.03.2025


    Time Zone: GMT +2
    Time Frame: 4 Hours (H4)


    Fundamental Analysis:
    The EUR/USD news analysis today, shows the pair is poised for significant moves with key data releases. On the Euro side, employment data reveals continued stability, with unemployment claims reflecting economic resilience. In contrast, the USD is influenced by the ISM Manufacturing PMI and Prices Paid reports, which are vital indicators of economic expansion and inflation trends. Positive PMI data could strengthen the USD, exerting downward pressure on EUR/USD. Meanwhile, hawkish statements from Federal Reserve officials could amplify USD's bullish momentum, adding to volatility. Traders are bracing for these fundamental drivers, which could set the tone for the EUR/USD fundamental outlook today.


    Price Action:
    The EUR/USD technical analysis today on its H4 chart indicates a pronounced bearish move, with the price breaking below key support levels. The large bearish candlestick signals strong seller dominance, and the pair is now testing the 1.0260 support zone. A potential retracement toward the 1.0350 level, now turned resistance, is possible before further downward movement. The overall structure suggests bearish momentum prevailing unless a decisive break above the resistance level occurs.


    Key Technical Indicators:
    Ichimoku Cloud: The price has decisively broken below the Ichimoku cloud, signaling a EURUSD bearish trend continuation. Both the Tenkan-sen and Kijun-sen lines are aligned downward, further reinforcing bearish momentum. The Lagging Span also supports this sentiment, sitting well below the price action and cloud.
    MACD (Moving Average Convergence Divergence): The MACD histogram shows increasing negative momentum, with the MACD line diverging further below the signal line. This confirms the bearish momentum and suggests that selling pressure remains strong in the short term.


    Support and Resistance:
    Support Levels: Immediate support is found at 1.0260, a critical level that, if breached, could lead to further declines toward 1.0200.
    Resistance Levels: Key resistance is located at 1.0350, with the next level of significant resistance at 1.0400, near the Ichimoku cloud base.


    Conclusion and Consideration:
    The EUR/USD forecast today tell us that it is entrenched in a bearish trend, with technical indicators and price action aligning to support further downside. Upcoming US ISM data could provide additional bearish catalysts if stronger-than-expected, bolstering the USD's position. Conversely, any weaker-than-anticipated data could trigger a short-term corrective rally. Traders should closely monitor the 1.0260 support level for a potential breakdown or reversal signals. Effective risk management, including stop-loss orders near resistance levels, is essential given the heightened volatility around today’s fundamental releases.


    Disclaimer: The analysis provided for EUR/USD is for informational purposes only and does not constitute investment advice. Traders are encouraged to perform their own analysis and research before making any trading decisions on EURUSD. Market conditions can change quickly, so staying informed with the latest data is essential.


    FXGlory
    01.03.2025

  4. #174
    Senior Member FXGlory Ltd's Avatar
    Join Date
    Mar 2024
    Posts
    176

    Visit FXGlory Ltd's Youtube Channel
    GOLDEUR Daily Technical and Fundamental Analysis for 01.06.2025


    Time Zone: GMT +2
    Time Frame: 4 Hours (H4)


    Fundamental Analysis
    The GOLDEUR pair, which reflects the price of gold in euros, is influenced by broader macroeconomic developments, such as inflation expectations and central bank policies. Today’s trading is expected to see lower liquidity due to the Italian banks being closed in observance of Epiphany Day, which could result in irregular volatility for the Euro. Meanwhile, the Eurozone CPI release will be critical for gauging inflation trends, with a higher-than-expected reading likely to strengthen the Euro by raising the probability of further European Central Bank tightening. Gold, however, may act as a safe haven, particularly if upcoming Eurozone economic data highlights uncertainties or weaknesses.


    Price Action
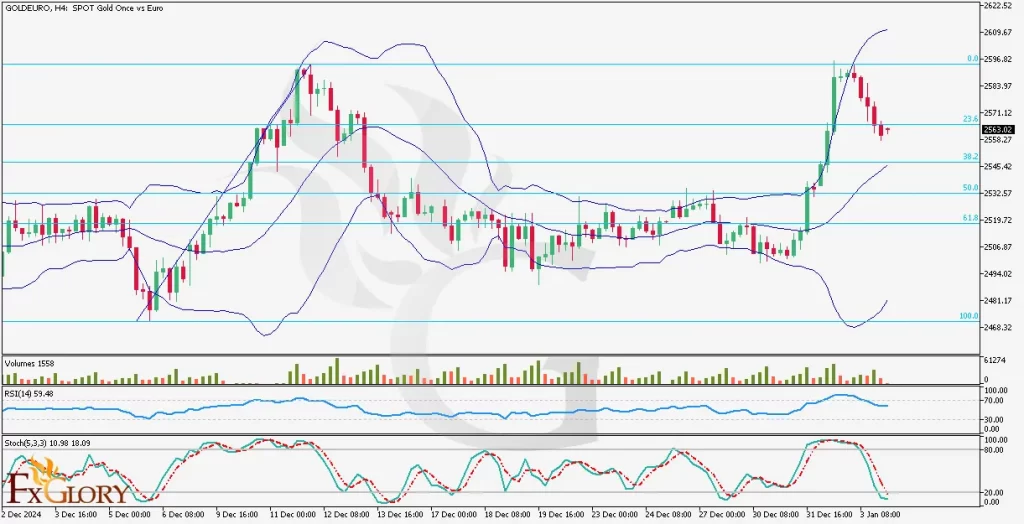
    In the H4 timeframe, GOLDEUR exhibits a corrective pullback after a strong bullish surge. The pair has recently touched the upper Bollinger Band and is now retracing towards the 23.6% Fibonacci level. Several bearish candles have formed, signaling the potential for further downside correction. If the price sustains below the 23.6% Fib level, it could continue its decline towards the 38.2% and 50.0% Fibonacci retracement levels, aligning with critical support zones. However, should the price regain upward momentum, a re-test of the recent highs near the upper Bollinger Band is possible.


    Key Technical Indicators
    Bollinger Bands: The bands have widened significantly, indicating recent high volatility. The price has retreated from the upper band and is approaching the middle band, which acts as a dynamic support level. A break below this level could signal further bearish momentum.
    Volume: Volume has decreased slightly during the correction phase, indicating weaker bullish conviction and the possibility of continued downward movement.
    RSI (Relative Strength Index): The RSI is currently at 59.48, reflecting moderate bullish momentum. However, it is moving away from the overbought zone, suggesting potential room for further correction.
    Stochastic Oscillator: The Stochastic Oscillator is in the oversold region (10.98), hinting at possible bearish exhaustion. This could indicate an imminent reversal or consolidation before further price action develops.


    Support and Resistance Levels
    Support: Immediate support is located at 2,571, which aligns with the 23.6% Fibonacci level and recent price retracement.
    Resistance: The nearest resistance level is at 2,583, coinciding with the recent high and the upper Bollinger Band.


    Conclusion and Consideration
    GOLDEUR currently shows signs of a technical correction within its broader bullish trend. While the RSI and Stochastic Oscillator suggest that the correction could soon exhaust, traders should monitor the key Fibonacci levels and Bollinger Band dynamics for clearer signals. The 23.6% Fibonacci level will serve as a critical pivot; a sustained break below it could open the path to deeper retracement levels. Conversely, a rebound could re-establish bullish momentum. The upcoming Eurozone CPI data will likely have a significant impact on GOLDEUR volatility, and lower liquidity due to the Italian holiday might exacerbate price swings.


    Disclaimer: The analysis provided for GOLD/EUR is for informational purposes only and does not constitute investment advice. Traders are encouraged to perform their own analysis and research before making any trading decisions on GOLDEUR. Market conditions can change quickly, so staying informed with the latest data is essential.


    FXGlory
    01.06.2025

  5. #175
    Senior Member FXGlory Ltd's Avatar
    Join Date
    Mar 2024
    Posts
    176

    Visit FXGlory Ltd's Youtube Channel
    EUR/USD H4 Technical and Fundamental Analysis for 01.08.2025


    Time Zone: GMT +2
    Time Frame: 4 Hours (H4)


    Fundamental Analysis:
    The EUR/USD news analysis today includes upcoming U.S. labor data such as ADP employment changes and initial jobless claims, which could indicate the health of the U.S. labor market and influence Federal Reserve policy. Strong employment data will likely bolster the dollar, further adding to the EUR/USD bearish outlook. On the Eurozone side, attention turns to German industrial orders and retail sales data. Weak results from these indicators may indicate softening economic activity in the Eurozone, adding to bearish sentiment on the Euro.


    Price Action:
    the EUR/USD technical analysis today on its H4 candle chart shows mixed sentiment, with the price hovering near a significant support level at 1.0315. The market attempted an upward move but was rejected at the 1.0340 resistance level, forming bearish candlesticks. Sellers appear to have regained control, driving the price back below the key Ichimoku Cloud.


    Key Technical Indicators:

    Ichimoku Cloud: The price has broken below the Ichimoku Cloud, signaling bearish momentum. The lagging span further supports a EURUSD bearish bias, and the resistance offered by the Kumo suggests that upward attempts will face strong selling pressure.
    MACD (Moving Average Convergence Divergence): The MACD line is below the signal line, and the histogram is negative, confirming bearish momentum. This aligns with the pair’s price action below the Ichimoku Cloud, further supporting a bearish outlook.
    RSI (14): The RSI is at 45.63, indicating neutral to slightly bearish momentum. The value is well below the overbought zone, suggesting room for further downward movement.


    Support and Resistance:
    Support Levels: 1.0315 (key horizontal support), followed by 1.0280 (next potential downside target).
    Resistance Levels: 1.0340 (near-term resistance), with further resistance at 1.0375 (a prior high).


    Conclusion and Consideration:
    The EUR/USD forecast today highlights bearish momentum supported by the pair’s technical indicators and its fundamental headwinds. If the price sustains below the 1.0340 resistance level, it may test the 1.0315 support and potentially move toward 1.0280. Traders should monitor U.S. labor data closely, as stronger-than-expected results could accelerate the pair's bearish trajectory. The Ichimoku Cloud and MACD both indicate bearish trends, suggesting that short positions may be favorable with appropriate risk management. However, a surprise improvement in Eurozone data could provide temporary relief to the pair.


    Disclaimer: The analysis provided for EUR/USD is for informational purposes only and does not constitute investment advice. Traders are encouraged to perform their own analysis and research before making any trading decisions on EURUSD. Market conditions can change quickly, so staying informed with the latest data is essential.


    FXGlory
    01.08.2025

Page 18 of 18 FirstFirst ... 8 16 17 18

Bookmarks

Posting Permissions

  • You may not post new threads
  • You may not post replies
  • You may not post attachments
  • You may not edit your posts
  •