Page 2 of 6 FirstFirst 1 2 3 4 ... LastLast
Results 11 to 20 of 60
Like Tree14Likes

Currency Indexes, Clusters and Strenght

This is a discussion on Currency Indexes, Clusters and Strenght within the Trading tools forums, part of the Trading Forum category; I have just found this indicator, Cash Spitting Sensor (e). It may be related to currency correlation. Code: extern bool ...


  1. #11
    Senior Member matfx's Avatar
    Join Date
    Sep 2013
    Location
    Malaysia
    Posts
    1,178
    Blog Entries
    114
    Follow matfx On Twitter
    I have just found this indicator, Cash Spitting Sensor (e). It may be related to currency correlation.

    Code:
    extern bool CurrenciesWindowBelowTable = FALSE;
    extern bool ShowCurrencies = TRUE;
    extern bool ShowCurrenciesSorted = TRUE;
    extern bool ShowSymbolsSorted = TRUE;
    extern string SymbolPrefix = "";
    extern string DontShowThisPairs = "NZDCHF";
    extern color HandleBackGroundColor = LightSlateGray;
    extern color DataTableBackGroundColor_1 = LightSteelBlue;
    extern color DataTableBackGroundColor_2 = Lavender;
    extern color CurrencysBackGroundColor = LightSlateGray;
    extern color HandleTextColor = White;
    extern color DataTableTextColor = Black;
    extern color CurrencysTextColor = White;
    extern color TrendUpArrowsColor = MediumBlue;
    extern color TrendDownArrowsColor = Red;
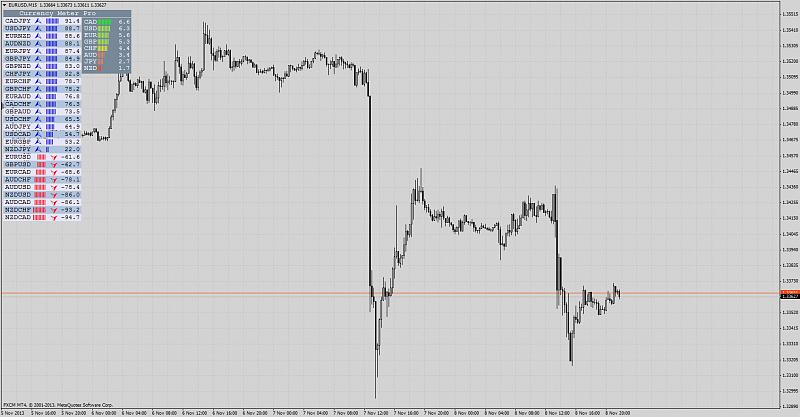
    Currency Indexes, Clusters and Strenght-currency-meter.jpg
    Attached Files Attached Files
    sameermehta74 likes this.
    Follow my official trading theregulartrader blog

  2. #12
    Senior Member levonisyas's Avatar
    Join Date
    Sep 2013
    Location
    Türkiye
    Posts
    122
    Last edited by levonisyas; 11-17-2013 at 01:44 PM. Reason: guide added

  3. #13
    Administrator newdigital's Avatar
    Join Date
    Feb 2013
    Posts
    10,474
    Blog Entries
    2911
    Follow newdigital On Twitter Add newdigital on Facebook Add newdigital on Google+ Add newdigital on MySpace
    Add newdigital on Linkedin
    Yes, good dash board :


    Currency Indexes, Clusters and Strenght-eurusd-h1-ibfx-inc.png
    Premium Trading Forum: subscription, public discussion and latest news
    Trading Forum wiki || MQL5 channel for the forum
    Trading blogs || My blog

  4. #14
    Administrator newdigital's Avatar
    Join Date
    Feb 2013
    Posts
    10,474
    Blog Entries
    2911
    Follow newdigital On Twitter Add newdigital on Facebook Add newdigital on Google+ Add newdigital on MySpace
    Add newdigital on Linkedin
    Single pair is also good :


    Currency Indexes, Clusters and Strenght-eurusd-h1-ibfx-inc.png
    Premium Trading Forum: subscription, public discussion and latest news
    Trading Forum wiki || MQL5 channel for the forum
    Trading blogs || My blog

  5. #15
    Senior Member levonisyas's Avatar
    Join Date
    Sep 2013
    Location
    Türkiye
    Posts
    122
    i'm glad if u realy like it.
    Also plz check the new custom candle indi, u'll like it too. Custom Candles
    Last edited by levonisyas; 11-17-2013 at 01:26 PM.

  6. #16
    Senior Member levonisyas's Avatar
    Join Date
    Sep 2013
    Location
    Türkiye
    Posts
    122
    Currency SlopeValues ::the best one that i used::
    Shows the Slope Value of all symbols, ordered and split by user defined levels. Option to display trend, lower timeframe and pivot order
    autoSymbols - set to true to let SlopeStrength use all symbols available in the Market Watch window. Overrules 'symbolsToWeigh'
    symbolsToWeigh - comma delimited list of symbols to use.
    nonPropFont - non proportional font to use
    fontSize - font size to use. SlopeStrength can do some very crude scaling
    autoTimeFrame - use chart timeframe
    timeFrame - set to one of M1,M5,M15,M30,H1,H4,D1,W1 or MN
    showPivotOrder - set to true to display the order of the daily, weekly, monthly pivot and price
    pivotDirection - 0= direction of pivots follows (possible) order, 1= ascending, 2 = descending
    showTrendIcon - the trend icon is an arrow that shows the approximate direction of the TMA Slope based on the last 5 periodes
    showLowerTimeFrame - set to true to show a bullet indicating the TMA Slope of the immediate lower timeframe
    slopeLevel1 - first level to split output, positive value used for negative too
    slopeLevel2 - Second level to split output, positive value used for negative too
    addSundayToMonday - set to true to append Sunday candles (if any) to the succeeding Monday candle
    stevehopwoodforex.com ? View topic - Baluda Indicators
    Currency Indexes, Clusters and Strenght-eurusdh1.png


  7. #17
    Senior Member matfx's Avatar
    Join Date
    Sep 2013
    Location
    Malaysia
    Posts
    1,178
    Blog Entries
    114
    Follow matfx On Twitter
    Currency Indexes, Clusters and Strenght-usdcad-h1-forex-capital-markets-slope-values-dashboard.png

    Interesting dashboard, thanks for sharing. More interestingly I just know Steve and Bob have their own forum.
    Follow my official trading theregulartrader blog

  8. #18
    Senior Member levonisyas's Avatar
    Join Date
    Sep 2013
    Location
    Türkiye
    Posts
    122
    How do i use the slope values of Currency Indexes, Clusters and Strenght
    4H time frame or greater
    Slope values are the strength of the current currency move,
    We had strength values at .4 -.4 and .8 and -.8, from these numbers we make decisions about our trades.
    If price goes above the 0.4 you have a very good chance that it will break the upper level of resistance for a breakout trade. Look for price to go up in a nice move.
    If you see price go below the -0.4 look for it to break resistance for a breakout trade.
    If you see prive go above 0.8 then you have a very strong move that could break several R lines.
    If you see price go below -0.8 price action will probably break several S lines.
    If you see price go between 0.4 / -0.4. Then it is showing that price is ranging and you can look to close your buy/sell trades.
    Conclusion
    When price hits its peak and start coming back down, that is not a signal to reverse direction. that is a signal that the rate of increase is decreasing not changing direction.
    that is a signal that the rate of increase is decreasing not changing direction.

  9. #19
    Senior Member levonisyas's Avatar
    Join Date
    Sep 2013
    Location
    Türkiye
    Posts
    122
    Plz check guide added for serenity dash board with famous BrianIndex

  10. #20
    Senior Member levonisyas's Avatar
    Join Date
    Sep 2013
    Location
    Türkiye
    Posts
    122
    Column “W” - Water Level
    - Current price is clearly below DWL, HWL and SMA211
    - Current price is marginally below the DWL, HWL and SMA211
    - Current price is clearly above DWL, HWL and SMA211
    - Current price is marginally above DWL, HWL and SMA211
    - Current price is somewhere in between DWL, HWL and SMA211

    Column “X” - Cross Above
    - Last hour SMA5 > SMA7 > SMA22 clearly
    - Last Hour SMA5 > SMA7 > SMA22 marginally
    - Last hour SMA5 < SMA7 < SMA22 clearly
    - Last hour SMA5 < SMA7 < SMA22 marginally

    Column “9” - Rule of 9
    - Ro9 of last 2 hours < -8
    - One of Ro9 < -8, the other one = -8
    - Ro9 of last 2 hours > 8
    - One of Ro9 > 8, the other one = 8

    Column “V” - Volatility
    - Volatility of last hour >= Volatility Threshold
    - Volatility of last hour < Volatility Threshold marginally
    - Volatility of last hour < Volatility Threshold clearly
    Default of Volatility Threshold is 100%. It can be adjusted in the input tab.

    Currency Indexes, Clusters and Strenght-kanton.jpg

    _tp KantorDashBoard V6.04.ex4
    Kantor DashBoard 6.04 Quick Guide.pdf

Page 2 of 6 FirstFirst 1 2 3 4 ... LastLast

Tags for this Thread

Bookmarks

Posting Permissions

  • You may not post new threads
  • You may not post replies
  • You may not post attachments
  • You may not edit your posts
  •