 7Likes
 LinkBack URL
 About LinkBacks
nice explanation, thx newdigital

This is a discussion on Supply and Demand zones within the Trading tools forums, part of the Trading Forum category; nice explanation, thx newdigital...


nice explanation, thx newdigital

New digital,
This indicator is more like support and resistance (zigzag based). Sometimes the plot happens to be supply or demand zones. Do you know any indicator that actually follow the rules in Sam Seiden's strategy?
Originally Posted by newdigital

Hi Swordfish,
Can u share an example for ''Sometimes the plot happens to be supply or demand zones''

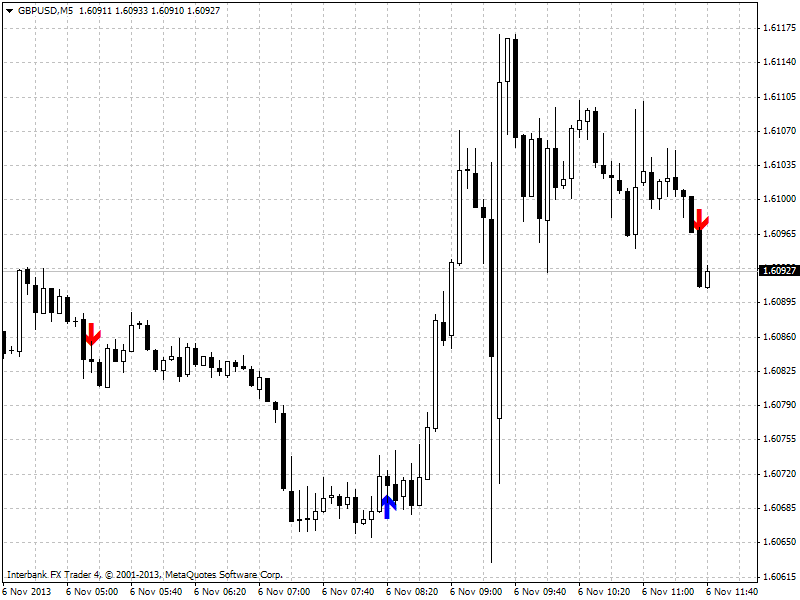
There are 2 guidelines for plotting supply and demand zones:
1) they are usually the small side-way bars followed by a large move
2) should plot after, not before, the large move has been identified.
The common II SupDem indicator picks top and bottom like zigzag indicator. It repaints if zone is broken. It plots before a large move, but often there were large moves after the plot, thus sometimes it plots supply or demand. Like so:
To see how to plot supply and demand correctly, this guy's 6 videos are very helpful.

Hi Swordfish,
i think shift=0 mode cause this. Calculates before candle close.
i tested lots of subdem indicators and find this one good.
Here are others Support_Resistance_RD.mq4, SupDem.mq4, Support and Resistance (Barry).mq4 from my pc

I found SUpRes_Breakouts indicator (which is based on Support and Resistance (Barry)1 indicator - both should be in indicator's folder compiled. SUpRes_Breakouts indicator should be attached to the chart :
Premium Trading Forum: subscription, public discussion and latest news
Trading Forum wiki || MQL5 channel for the forum
Trading blogs || My blog
Thank you so much for these indicators Newdigital

Hi Swordfish,
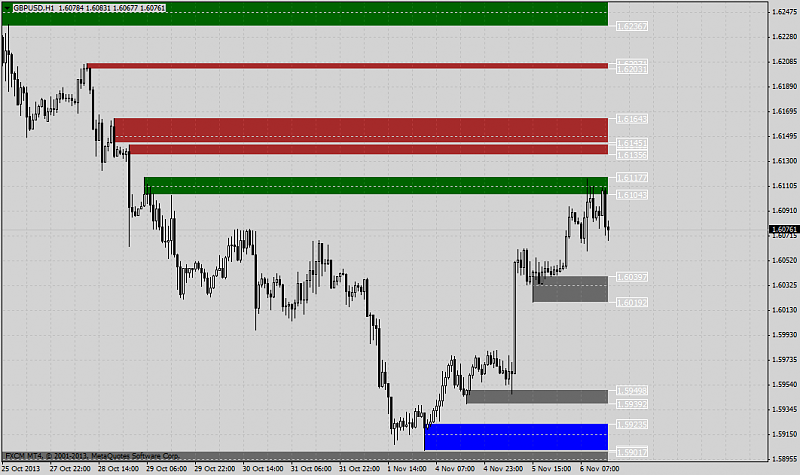
Take a look at this support demand zones indicator which i found it from FF. It have many settings available such as multi timeframe, alert, color settings and so on.
Follow my official trading theregulartrader blog
I like it. Slightly better than II SupDem.
Thank you for sharing.
This one is very close to Sam Seiden's supply & demand. It plot s a level AFTER a large move has been made. It also counts how many times the level has been retested.
 Posting Permissions


 Reply With Quote


Bookmarks