Page 15 of 34 FirstFirst ... 5 13 14 15 16 17 25 ... LastLast
Results 141 to 150 of 338
Like Tree79Likes

AllAverages

This is a discussion on AllAverages within the Trading tools forums, part of the Trading Forum category; Originally Posted by igorad Hi Dr.Phoenix, In the indicator I use the following formula: StdDev = Sqrt(Sum(Pow(Price[i] - Avg[i]),2),N)/N), where ...


  1. #141
    Junior Member
    Join Date
    Apr 2015
    Posts
    28
    Quote Originally Posted by igorad View Post
    Hi Dr.Phoenix,

    In the indicator I use the following formula:

    StdDev = Sqrt(Sum(Pow(Price[i] - Avg[i]),2),N)/N),

    where N - deviation period,
    Avg[i] - moving average from our set on i-th bar
    Price[i] - price on i-th bar


    Regards,
    Igor
    Thanks, Igor.

    it is unusual but functional. you have mixed two algorythms. Very good.

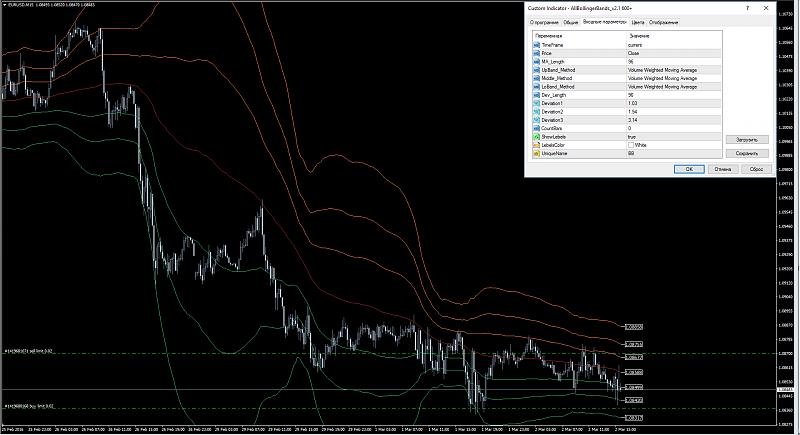
    Below there is a chart that represents prices quite well. Look at it.
    Below I have shown VWMA with bands (I published the indicator at this thread as well). The lines are dotted.
    Look, they are almost the same and validate each other. Perfect !

    Best
    D.P.

    AllAverages-2016-03-02_16-49-03.jpg
    Attached Thumbnails Attached Thumbnails AllAverages-2016-03-02_17-12-36.jpg  
    Last edited by Dr.Phoenix; 03-02-2016 at 01:20 PM.

  2. #142
    Junior Member
    Join Date
    Apr 2015
    Posts
    28
    Igor, at last I would like to ask you to do a favour for me personally, I think, it is not a problem for you.

    Can you cut off everything, excepting the VWMA stuff, from your bands indicator? So, the indicator should have BB based on VWMA only. It will be a VWMA MOD of yours.
    The matter is that the overall weight of the compiled binary file is 148Kb.
    Thanking in advance.

    Best
    D.P.

  3. #143
    igorad
    Guest
    Quote Originally Posted by Dr.Phoenix View Post
    Igor, at last I would like to ask you to do a favour for me personally, I think, it is not a problem for you.

    Can you cut off everything, excepting the VWMA stuff, from your bands indicator? So, the indicator should have BB based on VWMA only. It will be a VWMA MOD of yours.
    The matter is that the overall weight of the compiled binary file is 148Kb.
    Thanking in advance.

    Best
    D.P.

    Hi Dr.Phoenix,

    Please check out the eVWMA_BBands indicator.


    Attachment 19304


    Regards,
    Igor

  4. #144
    Junior Member
    Join Date
    Apr 2015
    Posts
    28
    Quote Originally Posted by igorad View Post
    Hi Dr.Phoenix,

    Please check out the eVWMA_BBands indicator.


    Attachment 19304


    Regards,
    Igor
    Igor, Thanks, but it is eVWMA... I asked you VWMA thought.
    eVWMA is not the same as VWMA as you know.

    D.P.
    Last edited by Dr.Phoenix; 03-03-2016 at 02:17 PM.

  5. #145
    igorad
    Guest
    Quote Originally Posted by Dr.Phoenix View Post
    Igor, Thanks, but it is eVWMA... I asked you VWMA thought.
    eVWMA is not the same as VWMA as you know.

    D.P.
    Hi Dr.Phoenix,

    Ok, no problem. The VWMA_BBands is in the attachment.

    Attachment 19325

    Regards,
    Igor

  6. #146
    Junior Member
    Join Date
    Apr 2015
    Posts
    28
    Quote Originally Posted by igorad View Post
    Hi Dr.Phoenix,

    Ok, no problem. The VWMA_BBands is in the attachment.

    Attachment 19325
    Igor, you made it.

    Look at the chart below.
    I use both of the indicators and they give one the better performance if used consolidatedly.

    Best,
    D.P.

    P.S. Igor, I see you have much experience, programing MT4. I have some thoughts that can be used to make some kind of EA.
    If you have time and wishes to discuss and possibly make it, I would very appreciate it.
    The matter is that I am searching for such a pro very long.
    Attached Thumbnails Attached Thumbnails AllAverages-2016-03-04_22-41-16.jpg  
    Last edited by Dr.Phoenix; 03-04-2016 at 06:59 PM.

  7. #147
    Junior Member
    Join Date
    May 2013
    Posts
    4
    @dr. phoenix

    Your setup looks interesting. Could you explain the logic behind the settings (lenght,deviations) ?

  8. #148
    Senior Member
    Join Date
    May 2013
    Posts
    151
    Quote Originally Posted by Dr.Phoenix View Post
    Igor, you made it.

    Look at the chart below.
    I use both of the indicators and they give one the better performance if used consolidatedly.

    Best,
    D.P.

    P.S. Igor, I see you have much experience, programing MT4. I have some thoughts that can be used to make some kind of EA.
    If you have time and wishes to discuss and possibly make it, I would very appreciate it.
    The matter is that I am searching for such a pro very long.
    Yes, it would be very helpful if you could explain how you trade the set up.

  9. #149
    Junior Member
    Join Date
    Apr 2015
    Posts
    28
    Quote Originally Posted by Jozo View Post
    Yes, it would be very helpful if you could explain how you trade the set up.
    Guys, I will give you some links that can help you to understand the logic behind it.

    VWAP is volume-weighted average price. VWAP is the ratio of the value traded to total volume traded over a particular time horizon (usually one day). It is a measure of the average price of a stock traded at over the trading horizon [1].
    VWAP trading concept is discussed in [2]. Examples found on the net are in here [3].
    Indicators mostly used are Market statistics v.4.2 (VWAP) and v.7.1 (VWMA) can be found at the FF or on the net. They can picture VWAP line, three pairs of bands [-1 SD; +1 SD], [-2 SD; +2 SD], [-3 SD; +3 SD] and PVP. SD is the Standard Deviation that is discussed in [4]. The areas of the first sigma, the second sigma and the third sigma are [-1 SD; +1 SD], [-2 SD; +2 SD] and [-3 SD; +3 SD] respectively.
    Mu in the picture [4, 5] is similar to the VWAP line in the indicator of Market statistics v.4.2. So the price fluctuates mostly in the range of the first sigma that is almost 70% of all prices traded in the day. Deviation of prices in the zones of the second sigma and the third sigma are extreme deviations, what means the price is imbalanced and is about to go backward to the balance area of the first sigma – the price tends to be in this area. If the price ends a trading day in the price areas of more than the first sigma, the next day might be the trend day because of the imbalanced state of price.

    VWMA is VWAP MA.

    Note. Both indicators are almost the same. I now use both of them to see the areas of standart deviations. There is no logic to use both, one is needed on the whole. But they can be complementary.
    Note. The parameters of the indicators above are taken empirically in order to fit the prices as much as possible.

    Links
    [1] http://en.wikipedia.org/wiki/Volume-..._average_price
    [2] Trading With Market Statistics - LINKS - Traders Laboratory - 4803
    [3] https://www.bigmiketrading.com/commo...rice-vpoc.html
    [4] http://en.wikipedia.org/wiki/Standard_deviation
    [5] http://en.wikipedia.org/wiki/File:St...on_diagram.svg
    Last edited by Dr.Phoenix; 03-10-2016 at 06:09 PM.
    newdigital and mak like this.

  10. #150
    Junior Member
    Join Date
    May 2013
    Posts
    4
    @dr. phoenix

    Thanks a lot m8!

Page 15 of 34 FirstFirst ... 5 13 14 15 16 17 25 ... LastLast

Tags for this Thread

Bookmarks

Posting Permissions

  • You may not post new threads
  • You may not post replies
  • You may not post attachments
  • You may not edit your posts
  •