
 12Likes
 LinkBack URL
 About LinkBacks


Indicator_Strength
These indicator have 3 Choice [ MA ; MACD ; Stochastic ] for displays in histogram form.
The difference between either :
1. MA_Power=true ~ a fast and slow Moving Average.
2. MACD_Power=true ~ main and signal lines of a MACD indicator.
3. Stochastic_Power=true ~ main and signal lines of a stochastic indicator.
Only one option can be choosen (default is [MA] Moving Average) at any one time, although another indicator can be opened for another option.
This indicator also displays average (strength) levels of difference values above and below the zero line. The feature can be disabled (Set_Levels=false).
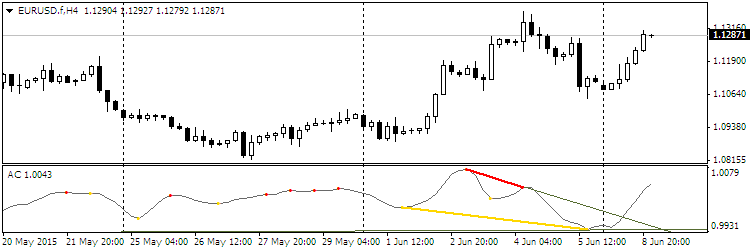
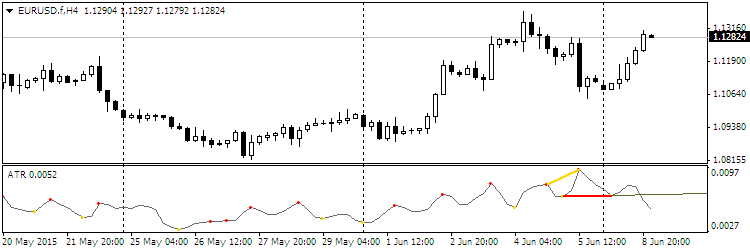
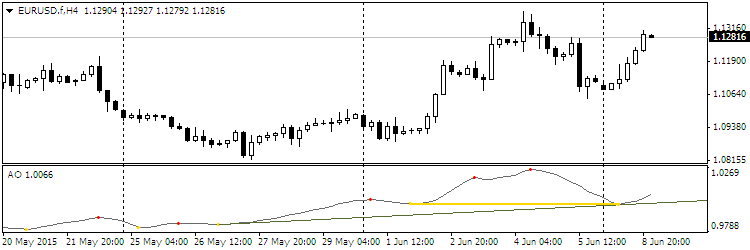
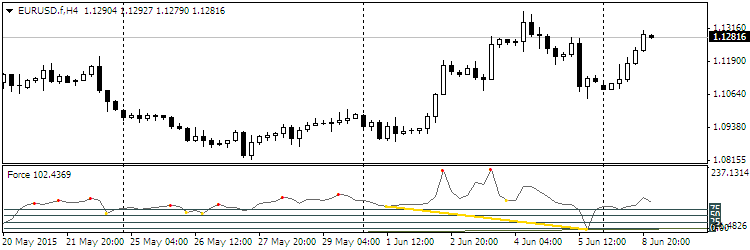
This indicator is meant to gauge the power/strength behind a price move.


 Reply With Quote


Bookmarks