Page 13 of 16 FirstFirst ... 3 11 12 13 14 15 ... LastLast
Results 121 to 130 of 158
Like Tree14Likes

Patterns by HWAFM

This is a discussion on Patterns by HWAFM within the Trading Systems forums, part of the Trading Forum category; Talking Points GBP/USD Technical Strategy: Sidelines Preferred Bullish Reversal Signal Finds Confirmation Doji On H4 Signals Indecision In Intraday Trade ...


  1. #121
    member TechnoMeter's Avatar
    Join Date
    Apr 2013
    Posts
    1,636
    Blog Entries
    421

    GBP/USD Cautious Advance Continues Following Bullish Pattern

    Talking Points

    • GBP/USD Technical Strategy: Sidelines Preferred
    • Bullish Reversal Signal Finds Confirmation
    • Doji On H4 Signals Indecision In Intraday Trade

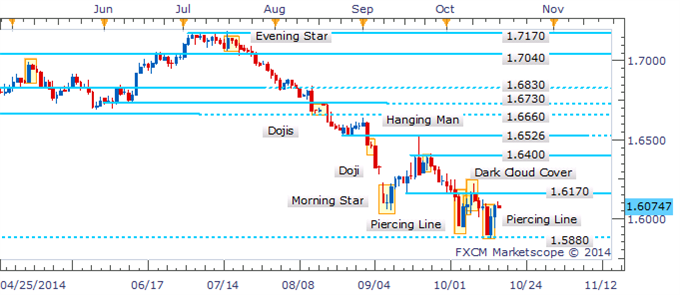
    GBP/USD continues its cautious recovery following the appearance of a Piercing Line pattern near its recent lows. Yet recent reversal patterns have seen a limited response from traders. Alongside a core downtrend some skepticism over further advance may be warranted. Selling interest is likely to be renewed at the 1.6170 ceiling. While a daily close below 1.5880 would potentially open the way for a descent towards the mid-September 2013 low near 1.5770.

    Bullish Signal Emerges At Key Support


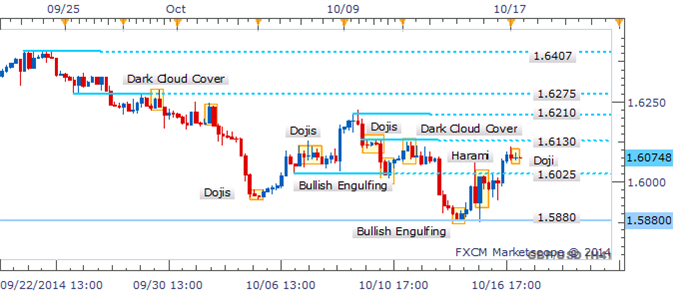
    The four hour may already be warning of fading upside momentum for the Pound. A Doji formation near 1.6130 suggests reluctance from the bulls to lead the pair higher. Yet an absence of classic reversal signals leaves a pullback as questionable over the session ahead.

    Doji Highlights Hesitation In Intraday Trade


    By David de Ferranti, Currency Analyst, DailyFX

    ===========

    Forming bullish Retracement pattern:

    Patterns by HWAFM-11.png


    Forming bullish ABCD pattern:

    Patterns by HWAFM-22.png


    Forming bullish 3-Draves pattern:

    Patterns by HWAFM-33.png


    More...

  2. #122
    Administrator newdigital's Avatar
    Join Date
    Feb 2013
    Posts
    10,474
    Blog Entries
    2911
    Follow newdigital On Twitter Add newdigital on Facebook Add newdigital on Google+ Add newdigital on MySpace
    Add newdigital on Linkedin
    Some patterns for this coming week.

    EURUSD D1 - forming Retracement pattern for downtrend:


    Patterns by HWAFM-eurusd-d1-metaquotes-software-corp-temp-file-screenshot-15048.png


    GBPUSD D1 - forming Retracement pattern for uptrend:

    Patterns by HWAFM-gbpusd-d1-metaquotes-software-corp-temp-file-screenshot-21909.png


    USDJPY W1 - forming Retracement pattern for downtrend:

    Patterns by HWAFM-usdjpy-w1-metaquotes-software-corp-temp-file-screenshot-853.png


    USDCHF D1 - forming Retracement pattern for uptrend:

    Patterns by HWAFM-usdchf-d1-metaquotes-software-corp-temp-file-screenshot-5988.png


    GOLD (XAUUSD) D1 - formed 3-Drives for uptrend:

    Patterns by HWAFM-xauusd-d1-metaquotes-software-corp-temp-file-screenshot-22827.png
    Premium Trading Forum: subscription, public discussion and latest news
    Trading Forum wiki || MQL5 channel for the forum
    Trading blogs || My blog

  3. #123
    Administrator newdigital's Avatar
    Join Date
    Feb 2013
    Posts
    10,474
    Blog Entries
    2911
    Follow newdigital On Twitter Add newdigital on Facebook Add newdigital on Google+ Add newdigital on MySpace
    Add newdigital on Linkedin
    Just some charts with GOLD (XAUUSD) indicating uptrend in long term situation:

    Patterns by HWAFM-xauusd-w1-metaquotes-software-corp-temp-file-screenshot-40317.png


    Patterns by HWAFM-xauusd-w1-metaquotes-software-corp-temp-file-screenshot-23504.png
    Premium Trading Forum: subscription, public discussion and latest news
    Trading Forum wiki || MQL5 channel for the forum
    Trading blogs || My blog

  4. #124
    member ForeCastle's Avatar
    Join Date
    Apr 2013
    Posts
    1,077
    Blog Entries
    236

    EURUSD - Elliott Wave 3 Coming After FOMC?

    Talking Points
    -Bearish 3rd wave in the Elliott Wave count is the preferred scenario
    -Bullish (X) wave is the alternate Elliott Wave count
    -Look for short opportunities near 1.15 or 1.1085
    The September FOMC meeting concludes with a lot of media debating if the Fed will hike rates or not. It is an interesting debate because economic data such as jobs are improving. However, other parts of the world are slowing in growth (think China) and US inflation is non-existent. Though the Fed would like to lift off of zero bound interest rates, the fear is that increasing rates in a dis-inflationary environment will create more economic problems. So the debate continues.

    We will look at the technical picture of the EUR-USD using Elliott Wave Theory. We will share a preferred bearish scenario and an alternate bullish scenario with levels to watch.

    Wave Count

    1. Preferred Bearish 3rd Wave
    The August 24 high was a meaningful high. The move to the downside since then has taken place in 5 waves which terminated on September 3. At that point, we look for a 3 wave counter trend upward bounce labeled a-b-c. It appears this corrective bounce is evolving into a more complex correction (labeled w-x-y). In that case, we could see another spike up to 1.14-1.15. A less likely scenario is that the move finished on September 14 at 1.1375 and wave (iii) down has already started.

    Patterns by HWAFM-bearish1.png

    Therefore, we have evidence building the trend is shifting to the downside and that the next meaningful move would be to the downside. At the same time, upside mobility should be limited to below 1.1500. This next move to the downside, if it transpires, would be labeled a wave (iii).

    Third wave moves tend to be the longest and strongest. This viewpoint also places the EUR/USD in a similar situation to the Sterling, which we wrote about last week.

    A break below 1.0975-1.1000 builds the case that a third wave is unfolding.

    2. Alternate X Wave Leading to a Bullish Move
    There is an alternative view we are tracking as well. Remember, when trading with Elliott Wave Theory we are never certain of the wave picture until the waves are finished. Therefore, we must bring a probabilistic approach and realize there are many wave counts in play and that we let the market exclude certain counts because they break one or more of Elliott’s rules.

    Patterns by HWAFM-bullish0.png

    Since the March 2015 low, prices have been overlapping higher in complex fashion as a correction. Though the preferred wave count is that a resumption of the trend continues lower to retest the March lows, there is an alternative count that needs to be considered.

    This wave picture is a bit trickier because so long as prices are above 1.08, this picture still is possible and ultimately suggests a retest of the 1.1700 high. In other words, wave (x) could sell off towards 1.08 and keep the door open for an eventual visit to 1.17.

    In these scenarios, it is important to look at the internal structure of the waves and seek out equal wave patterns or overlapping waves that suggest the corrective nature would continue higher. To date, this exists and we need to keep it in mind.

    Again, this alternate suggests we form a partial retracement lower before one final move higher to retest 1.17.

    Now that we have a preferred and alternate count in mind, what does sentiment and volume suggest that might sway our bias?

    Conclusion

    Patterns by HWAFM-bullish1.png

    The wave pictures are suggesting we could soon embark upon a wave 3 sell off. Therefore, a break below 1.1085 or a rise up to 1.15 would spark short trades. And we have a bullish alternative, a meaningful rise above 1.15 or a sell off towards 1.11 that is not impulsive would shift the scales towards entering long the market.

    ---Written by Jeremy Wagner, Head Trading Instructor, DailyFX EDU

    more...
    Premium Trading Forum: subscription || The Forex Guide to Fundamentals Fundamentals
    Trading blogs || My blog

  5. #125
    member FinanceGlossy's Avatar
    Join Date
    Mar 2014
    Posts
    108
    Blog Entries
    95

    Harmonic Trading Made Easy

    Have you heard any recent "buzz" about something called Harmonic Trading or Elemental Trading? Until recently not many people in the investment and trading world were familiar with these techniques. Fortunately, you don't need to be a mathematician or engineer in order to get results in your trading from employing these highly probably chart patterns as part of your overall technical analysis.
    Part of the knowledge now known as harmonic trading began with H.M. Gartley who published a book in 1935 called Profits in the Stock Market. This video illustrates what the original Gartley pattern is and how this pattern as well as the more recent discoveries can be easily employed in your trading business in Forex, stocks, commodities, and futures.

    Patterns by HWAFM-eurusd-h8-metaquotes-software-corp.png


    When a pattern forms with specific high and low proportions that are measured with fiboncacci ratios it has been discovered that these patterns will be followed by a "potential reversal zone" which creates a highly probably trading opportunity. Besides the original Gartley pattern including the bullish Gartley and bearish Gartley, there are patterns discovered more recently by Scott Carney in 2000 and 2001. Carney is credited with discovering and researching these patterns including the bullish bat, bearish bat, bullish crab, bearish crab, Traders who are familiar with Elliott Wave will also see how these patterns correspond to Elliott Wave patterns but are a specific type of pattern that is known to be highly probably for producing a turning point and a trade entry that is likely to work out as a profitable trade.

    Patterns by HWAFM-eurusd-w1-metaquotes-software-corp.png


    The structure of the Butterfly pattern was discovered by Bryce Gilmore. The butterfly includes a 78.6 Fibonacci retracement of the XA leg as the B point. The CD leg is extended to 127% or 161.8% of AB.

    Patterns by HWAFM-eurusd-w1-metaquotes-software-corp-2.png


    These patterns have now been incorporated into an indicator for Metatrader 4 and Metatrader 5 which draws the pattern clearly on the chart when it forms and produces a trading alert which can be emailed or sent as SMS text to a cell phone.

    Trading Forum wiki || FXstreet Trading Strategies thread
    Trading blogs || My blog

  6. #126
    member 1Finance's Avatar
    Join Date
    Feb 2014
    Posts
    1,518
    Blog Entries
    351
    Quote Originally Posted by newdigital View Post
    The only pair which is interesting concerning patterns for this week is XAUUSD - all developing/forming patterns (see red arrows on separate windows on the chart) are showing uptrend :

    Attachment 2317

    Attachment 2318

    Attachment 2319

    What is the Pip Cost for Gold and Silver?


    1. Gold: Symbol XAU/USD
      The pip cost for 1 ounce of Gold (minimum trade size) is $0.01 per pip.
    2. Silver: Symbol XAG/USD
      The pip cost for 50 ounces of Silver (minimum trade size) is $0.50 per pip


    Example with GOLD (XAU/USD): 1221.39 - 1218.02 = 337 pips
    Trading blogs || My blog

  7. #127
    Administrator newdigital's Avatar
    Join Date
    Feb 2013
    Posts
    10,474
    Blog Entries
    2911
    Follow newdigital On Twitter Add newdigital on Facebook Add newdigital on Google+ Add newdigital on MySpace
    Add newdigital on Linkedin
    USD/CAD before Canada's GDP

    As I see - all the developing patterns for the timeframes started with M30 are estimating the uptrend so we will see how the situation will be developed during this high impacted news events today:

    Patterns by HWAFM-usdcad-m30-metaquotes-software-corp.png


    Patterns by HWAFM-111111.png


    Patterns by HWAFM-usdcad-h2-metaquotes-software-corp.png


    Patterns by HWAFM-usdcad-h12-metaquotes-software-corp.png
    Premium Trading Forum: subscription, public discussion and latest news
    Trading Forum wiki || MQL5 channel for the forum
    Trading blogs || My blog

  8. #128
    member 1Finance's Avatar
    Join Date
    Feb 2014
    Posts
    1,518
    Blog Entries
    351

    Chart Patterns for Futures/Equities/Options/Forex Traders

    Chart Patterns for Futures/Equities/Options/Forex Traders

    Patterns by HWAFM-chart-patterns.png
    Trading blogs || My blog

  9. #129
    member 1Finance's Avatar
    Join Date
    Feb 2014
    Posts
    1,518
    Blog Entries
    351
    Just example with bullish gartley (developing pattern):

    Patterns by HWAFM-bullishgartlety.png
    Trading blogs || My blog

  10. #130
    Administrator newdigital's Avatar
    Join Date
    Feb 2013
    Posts
    10,474
    Blog Entries
    2911
    Follow newdigital On Twitter Add newdigital on Facebook Add newdigital on Google+ Add newdigital on MySpace
    Add newdigital on Linkedin
    NZD/USD W1, bearish developing Gartley:

    Patterns by HWAFM-nzdusd-w1-metaquotes-software-corp-5.png
    Premium Trading Forum: subscription, public discussion and latest news
    Trading Forum wiki || MQL5 channel for the forum
    Trading blogs || My blog

Page 13 of 16 FirstFirst ... 3 11 12 13 14 15 ... LastLast

Tags for this Thread

Bookmarks

Posting Permissions

  • You may not post new threads
  • You may not post replies
  • You may not post attachments
  • You may not edit your posts
  •