Page 6 of 8 FirstFirst ... 4 5 6 7 8 LastLast
Results 51 to 60 of 74

Price Action and Patterns

This is a discussion on Price Action and Patterns within the Trading Systems forums, part of the Trading Forum category; Low volatility is a major source of frustration among many traders as the amount of opportunity to trade – or ...


  1. #51
    member ForeCastle's Avatar
    Join Date
    Apr 2013
    Posts
    1,077
    Blog Entries
    238

    Becoming a Better Trader: Frustrated by Low Volatility? Don’t Be

    Low volatility is a major source of frustration among many traders as the amount of opportunity to trade – or should I say, make ‘good’ trades – diminishes. Frustration generally only breeds one thing – more frustration. We can’t control how the market behaves just as we can’t control the outcome of our trades, but what we can control is how we react and conduct ourselves.

    Price Action and Patterns-eurusd-w1-metaquotes-software-corp.png


    Volatility ebbs from low to high and back again, across all time-frames. In that statement lies the silver lining; when volatility is low, look at it like this – it will pick back up again (and maybe soon). But until it does we need to accept what the market is providing. It is imperative to lower expectations so as to protect both trading and mental capital (always want to keep your head as clear as possible). To combat uneasiness which can arise by the lack of opportunity, be mindful and think – For every loss I avoid, it’s one less loss I have to make back when volatility or optimal trading conditions return…” And, again, volatility will return.

    We examined (again) the simple concept of using a checklist, whether it be a physical one (i.e. spreadsheet) or a mental one (which seasoned traders are likely to use). A checklist includes various criteria such as risk management parameters and criteria needed for a trade set-up. Like volatility, your trading activity and performance won’t be evenly distributed; there will be times where set-ups appear frequently and other times when they don’t.


    When the market is ‘dull’ there are things we can do to still be productive; study trade history/review journal entries, read books/websites, listen to and read what seasoned traders have to say, and even – relax! You have to trust that a good trade or better environment is around the corner. So, at the end of the day, if a proper mentality is adopted, one not need to become frustrated.

    more...
    Premium Trading Forum: subscription || The Forex Guide to Fundamentals Fundamentals
    Trading blogs || My blog

  2. #52
    member ForeCastle's Avatar
    Join Date
    Apr 2013
    Posts
    1,077
    Blog Entries
    238

    Becoming a Better Trader: Classic Chart Patterns, Part II

    Triangles/Wedges

    These types of patterns develop as a result of contracting volatility which portend price expansion upon breakout. There are three types – symmetrical, ascending, and descending.
    Symmetrical triangles are the most neutral of the three variations as higher lows and lower highs converge towards the apex of the formation. If they develop early in a trend they tend to act more as an indication of pending continuation of the trend prior to development, however; if they form after extended moves they are more prone to leading to reversals. In any event, as is the case with any one of the three variations, a confirmed breakout is needed before the pattern is set into motion, because these, especially, can go either way.
    Ascending wedges are marked by higher lows and a flat top. They show that market participants are willing to step in at increasingly higher prices despite the market capped by resistance. While this indicates a bullish bias in an upwardly trending market, if they break to the downside then a top can form. Conversely if development comes after an extended downtrend and break to the top-side they can result in a bottom.
    Descending wedges are marked by lower highs and a flat bottom. With this variation the market is indicating that sellers are coming in at lower and lower levels with increasing pressure on horizontal support. A break of the bottom of the formation in-line with the downward trend is a continuation-style pattern. If they form after an extended up-move, we see a break of the flat bottom, then they are topping in nature.


    Bull & Bear-flags

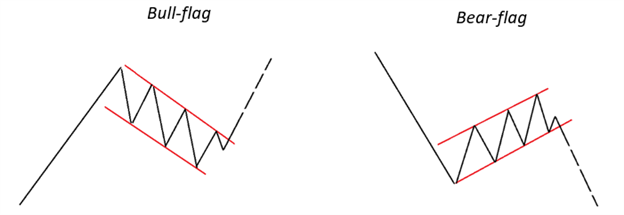
    Bull-flags develop after a rally and occur as a result of gradual selling, but nothing significant enough to change the trend (also known as a ‘correction’). The downward channel which takes shape is eventually triggered by the market trading above the top-side trend-line. The extent of the move which the pattern projects is for a new swing-high to develop at the least, and the measured move target is the depth of the pattern added to the point of breakout.
    Bear-flags develop after a sell-off and occur as a result of gradual buying, but not enough to change the bearish trend (aka, ‘correction’). The upwardly sloped channel is eventually triggered by a move below the lower trend-line which makes up the underside of the pattern. In reverse of the bull-flag, a move to a new swing-low is targeted, with the ‘MMT’ determined by the depth of the formation subtracted from the breakout point.


    Continuation-style ‘Head-and-shoulders’

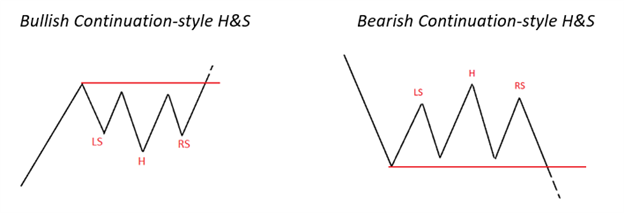
    While traditionally head-and-shoulders are thought of as reversal patterns (which we discussed in Part I), they can form in the direction of a trend and act as continuation patterns. These can also take on the shape of an ascending wedge in an uptrend and a descending wedge in a downtrend. In any event, the implications are the same. The measured move target is the distance from the head to the neckline added or subtracted from the neckline depending on whether it is a bullish or bearish sequence. Again, other technical levels should be taken into consideration when determining targets.


    Rectangles (consolidations)

    This is a very simple pattern, which until either side of the range (or consolidation) is broken is to be avoided. Trading in the middle of the range isn’t prudent. These are often considered continuation patterns, but if they develop after an extended trend and break in the opposite direction, they can mark a top. As is the case with all technical patterns, the size of the pattern determines the measured move target once a breakout occurs.


    more...
    Premium Trading Forum: subscription || The Forex Guide to Fundamentals Fundamentals
    Trading blogs || My blog

  3. #53
    member ForeCastle's Avatar
    Join Date
    Apr 2013
    Posts
    1,077
    Blog Entries
    238

    3 Trading Tips for RSI

    What is RSI (Relative Strength Index)?

    Price Action and Patterns-eurusd-d1-fx-choice-limited-2.png


    RSI (Relative Strength Index) is counted among trading's most popular indicators. This is for good reason, because as a member of the oscillator family, RSI can help us determine the trend, time entries, and more.
    The Relative Strength Index (RSI) was developed by J. Welles Wilder to measure the speed and change of price movements. RSI oscillates and is bound between zero and 100. There are many different uses for RSI and by far the most popular is trading overbought and oversold crossovers.

    Think beyond the crossovers

    When traders first learn about RSI and other oscillators, they tend to gravitate to overbought and oversold values. While these are intuitive points to enter in the market on retracements, this can be counterproductive in strong trending environments. RSI is considered a momentum oscillator, and this means extended trends can keep RSI overbought or oversold for long periods of time.

    Watch the center line

    All oscillators have a center line and more often than not, they become a forgotten backdrop compared to the indicator itself. RSI is no different, with a center line found in the middle of the range at a reading of 50.
    Technical forex traders use the centerline to show shifts in the trend. If RSI is above 50, momentum is considered up and traders can look for opportunities to buy the market. A drop below 50 would indicate the development of a new bearish market trend.

    Check your parameters

    RSI like many other oscillators is defaulted to a 14 period setting. This means the indicator looks back 14 bars on whatever graph you may be viewing, to create its reading. Even though 14 is the defaulted setting that may not make it the best setting for your trading. Normally short-term traders use a smaller period, such as a nine period RSI, to replicate shorter term movements in the market.. Longer-term traders may opt for a higher period, such as a 25 period RSI, for another indicator line.

    more...
    Premium Trading Forum: subscription || The Forex Guide to Fundamentals Fundamentals
    Trading blogs || My blog

  4. #54
    member ForeCastle's Avatar
    Join Date
    Apr 2013
    Posts
    1,077
    Blog Entries
    238

    Top 10 most volatile currency pairs

    FX markets are susceptible to a range of factors which affect their volatility, and many traders look to tailor their strategies to capitalize on the most volatile currency pairs.

    Volatility, usually measured using the standard deviation or variance of a currency, gives traders an expectation of how much a currency can deviate from its current price over a certain period. The higher the volatility of the currency, the higher the risk. Volatility and risk are usually used as interchangeable terms.
    Different currency pairs have different volatilities. The major currency pairs like the EUR/USD, USD/JPY, GBP/USD and USD/CHF generally have less volatility than the emerging market currency pairs like the USD/ZAR, USD/KRW and USD/BRL. Normally, more liquid currency pairs have less volatility.

    What are the most volatile currency pairs?


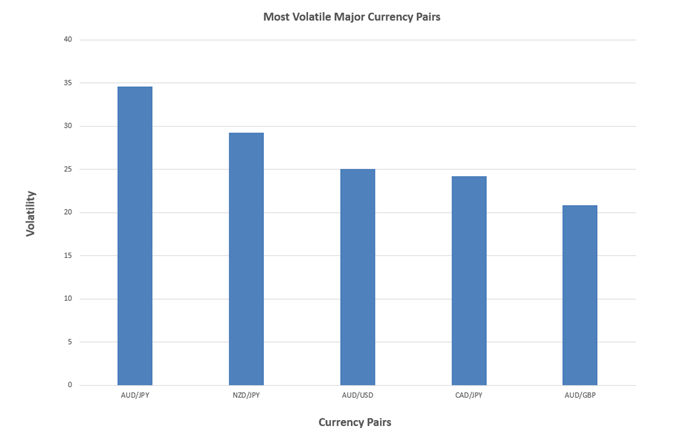
    Top 10 Most volatile currency pairs
    Among the major currency pairs, the AUD/JPY, NZD/JPY and AUD/USD are currently the most volatile.


    The USD/ZAR, USD/KRW, USD/BRL and other emerging market currencies pairs tend to be highly volatile due to their low liquidity and because of the risk that is inherent in emerging market economies.

    more...
    Premium Trading Forum: subscription || The Forex Guide to Fundamentals Fundamentals
    Trading blogs || My blog

  5. #55
    member FinanceGlossy's Avatar
    Join Date
    Mar 2014
    Posts
    108
    Blog Entries
    95

    Reversing: The holy grail or a dangerous delusion?

    Reversing is a type of martingale. Such systems suggest lot doubling after a losing trade, so that profit could cover previous trade's losses in case of success.
    Price Action and Patterns-gbpusd_cci__1.png


    read more here
    Trading Forum wiki || FXstreet Trading Strategies thread
    Trading blogs || My blog

  6. #56
    member ForeCastle's Avatar
    Join Date
    Apr 2013
    Posts
    1,077
    Blog Entries
    238

    What is Stock Market Volatility and How to Trade It

    Stock market volatility is an integral concept for traders to understand. Knowing the stocks with the highest potential for significant price movement, as well as how to trade them optimally, can mean exciting opportunities. In this piece, we explore high volatility stocks in more depth, look at how to identify the most volatile stocks, and provide best practice tips for trading them.

    What is volatility in stocks?

    Stock market volatility refers to the range of price movement of a stock over time. A more volatile trade has the potential for significant gains, but also substantial losses. Volatility in stocks can be understood using the following measures:
    1) Standard deviation
    Standard deviation is the average amount the price of a stock has differed from the mean over a given period. Bollinger bands can be used by chartists to analyze standard deviation.
    2) Beta

    A stock’s Beta is a measure of its volatility in relation to the wider market. The market has a beta of 1.0, with more volatile stocks having a value greater than this (eg 2.0), and less risky stocks having a value closer to zero.

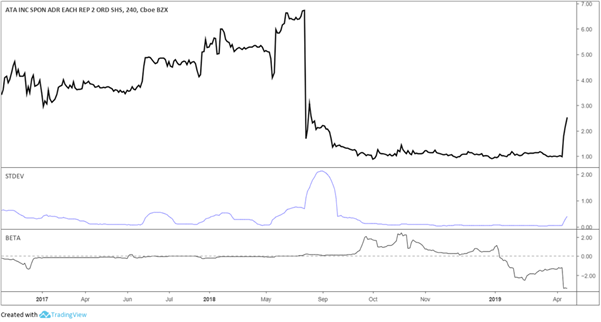
    The chart below shows the price for the ATA Inc. stock (ATAI), listed among the most volatile by TradingView as of April 2019, with both the standard deviation and Beta measures of volatility included on the chart.


    What are the most volatile stocks?

    When it comes to volatility and stocks, there is no one set of stocks that are always more volatile than another. Stocks can be classed as ‘currently volatile’, describing those stocks with current high swings, or ‘expected to be volatile’, meaning stocks that may be stable at this moment but have potential for high volatility in the future.

    As can be seen in the above example, stocks can have periods of high volatility, for example showing a Beta near zero, then an increasing Beta to 2.0, and then falling back to near zero months later.

    Identifying high volatility stocks

    When identifying high volatility stocks, traders can use a stock screener, search the derivatives market, and use third party websites.

    Stock Screener/Filter
    A stock screener or stock filter is an automated program that reveals a list of stocks that fit certain criteria.
    For example, using a stock screener to monitor the stocks that had the biggest percentage gains or losses in a prior trading session, making sure each has enough volume per day, can be helpful to ascertain subsequent volatility. Helpful criteria to find volatile stocks may include ‘show stocks where the average day range (50) is above 4%’

    Searching the derivatives market
    Traders can use parameters in the corresponding derivatives market such as put call ratio, which is a tool to gauge market sentiment, open interest, the number of contracts outstanding on an exchange at any one time, and implied volatility, a market forecast of likely price movement. For these indicators, it is advisable to go to the official exchange website.

    How to trade stock market volatility

    Trading stock market volatility successfully involves effective hedging, knowing when to sell stocks, employing sound risk management, and spotting buying opportunities when renowned stocks see a fall in price.

    Hedging
    Hedging against spikes in volatility is important to offset losses. This can be done by buying put options, which allow the sale of assets at an agreed price on or before a particular date, and trading inverse exchange-traded funds, which act as the inverse of the index or benchmark it tracks. Traders can also explore aggregated stocks through an index to protect against volatility (see below).

    Selling stock/managing risk
    If extreme volatility is affecting your mindset, it may be wise to sell off some stock and put your money into less dynamic securities. This leaves you free to trade another day without risking more than you are prepared to lose.
    Practising sound risk management is essential when dealing with aggressive price action. Volatile stocks can lose you a lot of money and should not be traded if your mindset isn’t right that day, particularly if day trading.

    Spotting buying opportunities
    Sometimes a buying opportunity arises when high volatility hits the price of high-quality stocks. For example, in early 2019 the NASDAQ and S&P 500 constituent Apple cut its earnings forecast, leading to its price dropping 10-15% in the following days. However, just three months later, it completely recovered and approached a $1 trillion valuation once more. Identifying opportunities to go long when the market conditions reverse is one way traders look to speculate when coupled with prudent trade management techniques.

    Volatile stocks for day trading
    Like the most volatile currency pairs, volatile stocks can show significant movement throughout the day, making them potentially an attractive option for day traders. While some stocks may move 0.5% in a single day, others may move as far as 5% in the same period, meaning traders should be constantly alert.
    To find a volatile stock for day trading, watch a stock you found with your stock screener for intraday movement. If a stock opens down 10% and starts moving, as opposed to staying static, it is being day traded and may be worth consideration.
    Due to the speed of price movement, executing day trades can be a physical endeavour and good reflexes win the day.

    Volatile Stocks for Swing Trading
    Swing traders hold positions for more than a day, making the effects of volatility potentially smaller than when day trading. Stocks that may be suitable for swing trading include large cap stocks such as Apple, Facebook and Microsoft, because they have a large volume of shares changing hands at any given point.

    more...
    Premium Trading Forum: subscription || The Forex Guide to Fundamentals Fundamentals
    Trading blogs || My blog

  7. #57
    member ForeCastle's Avatar
    Join Date
    Apr 2013
    Posts
    1,077
    Blog Entries
    238

    Exponential Moving Average (EMA) Defined and Explained

    What is Exponential Moving Average (EMA)?

    The exponential moving average (EMA) is a derivative of the simple moving average (SMA) technical indicator. Compared to the SMA, the EMA weighs recent price changes more heavily than later changes in price. This means that the EMA is more responsive than the SMA to current price fluctuations.
    The chart below represents the difference between the SMA and EMA. The 200-EMA is seen reacting earlier to the highlighted decline in price on the left side of the chart. The same is seen with an increase in price emphasizing the variance in lag.

    How is the Exponential Moving Average (EMA) Calculated?

    Nearly all charting packages perform this calculation on the respective platforms and apply the calculation to the chart. For the numbers people, the formula will be shared below, but the important thing to remember is that EMA will react quicker to price trends relative to SMA.
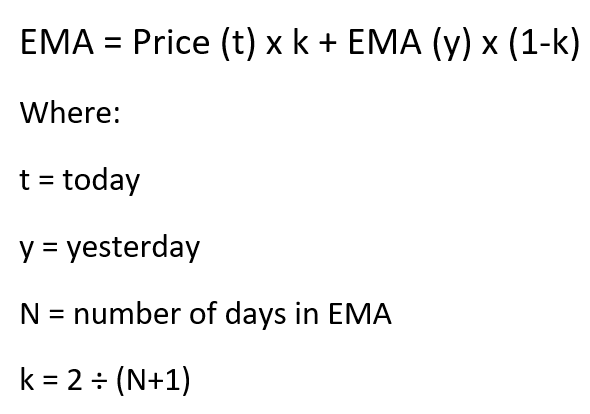
    The exponential moving average (EMA) is a weighted moving average calculated by taking the average price for a particular market over a defined period of time and adjusting this figure to increase the weight of recent price data. The formula below breaks down the components of the calculation making it easy to visualize and compute.

    How do you use the Exponential Moving Average in your trading strategy?

    The EMA trading strategy can be used in the same manner as the SMA. When the shorter term EMA crosses above the longer term EMA, this signals a buy signal. When the shorter term EMA crosses below the longer term EMA, traders look to enter short positions. The EMA values are completely up to the trader’s preferences. The example below uses 20, 50 and 200 EMA designations, while other traders favour Fibonacci figures.

    Exponential Moving Average: A Summary

    The EMA is valuable indicator to have as a trader. This indicator is simple to use and a great way for novice traders to get a feel for technical analysis in relation to identifying trends and entry prospects. More experienced traders tend to use the EMA in conjunction with other tools, but this makes it no less influential.
    Steps to follow when trading with the EMA:

    • Use long-term EMA to identify general trend
    • Identify crossing points between shorter term EMA’s and longer term EMA’s
    • Look to enter ‘long’ or ‘short’ positions accordingly


    more...
    Premium Trading Forum: subscription || The Forex Guide to Fundamentals Fundamentals
    Trading blogs || My blog

  8. #58
    member ForeCastle's Avatar
    Join Date
    Apr 2013
    Posts
    1,077
    Blog Entries
    238

    Using Price Action As Your First Indicator

    What is Price Action?

    Price action is the study or analysis of price movement in the market. Traders use price action to form opinions and base decisions on trends, key price levels and suitable risk management. Trend identification is frequently utilized as the initial step in price action trading. All other facets to price action indicators require a trend basis to begin price action analysis.

    Price Action and Patterns-head.jpg


    Price Action as Your First Indicator

    Technical analysis setups generally begin with price action as the initial form of evaluation. The first thing to remember when using an indicator is that it is a function of price action. The indicator itself is not the ultimate tool when it comes to trading, but rather comes in behind price action. Price action governs the information that the indicator will ultimately provide on the chart. As such, a trader must determine what price action is doing (i.e. the trend) before consulting the indicator for an entry signal. Once the trend is determined, the trader can then consult the indicator for an entry signal in the direction of the trend.Traders trade on the price movement of an instrument therefore, the focus is on the change in price as opposed to the change in indicator value. Some traders base trading decisions and analysis purely on price action whilst other prefer a combination of price action and technical indicators which serve as a support system.

    Price Action and Patterns-dax30-m30-alpari-international.png


    Technical indicators are derivatives of price action - price action governs the information that indicators provide on the chart. These indicators are calculated using varying periodic price data which provide substantiation for entry, exit, and stop distance criteria. Trend identification is also important in market analysis to ascertain how the market is functioning on a holistic scale (time frame dependent).

    Price Action and Technical Indicators: A Summary

    Price action is a broad technical analysis technique that incorporates various trading strategies which traders apply to analyze the markets. Technical indicators work well in conjunction with price action to allow traders to formulate more accurate trade decisions.

    more...
    Premium Trading Forum: subscription || The Forex Guide to Fundamentals Fundamentals
    Trading blogs || My blog

  9. #59
    member mql5's Avatar
    Join Date
    May 2013
    Posts
    2,463
    Blog Entries
    1681

    Morning Star - indicator for MetaTrader 5

    Morning Star - indicator for MetaTrader 5

    Price Action and Patterns-morningstar11.png


    This indicator is showing the ' Morning Star ' pattern on the chart.
    The indicator has several settings, which allows it to be used both for the Forex market and for exchange symbols: ' Gap ', ' Candle 2 type ' and ' Candle sizes '.
    Price Action and Patterns-pat1.gif

    Click image for larger version. 

Name:	pat1.gif 
Views:	70 
Size:	51.9 KB 
ID:	40977

    Price Action and Patterns-pat3.gif

    Price Action and Patterns-pat5.png
    Metatrader 5 / Metatrader 4 for MQL5 / MQL4 articles preview preview
    Trading blogs || My blog

  10. #60
    member TheNews's Avatar
    Join Date
    Feb 2013
    Posts
    7,428
    Blog Entries
    1037

    Gold Price Outlook

    Price Action and Patterns-xauusd-c-d1-just2trade-online-ltd.png


    Gold prices turn to US CPI data in the week ahead as elevated global bond yields continue to make a tough road ahead for XAU/USD. Fed Chair Jerome Powell commentary eyed.

    more...
    Analytics and News section || Trading News Events thread
    Trading blogs || My blog

Page 6 of 8 FirstFirst ... 4 5 6 7 8 LastLast

Tags for this Thread

Bookmarks

Posting Permissions

  • You may not post new threads
  • You may not post replies
  • You may not post attachments
  • You may not edit your posts
  •