Page 1 of 7 1 2 3 ... LastLast
Results 1 to 10 of 70

Price Action and Patterns

This is a discussion on Price Action and Patterns within the Trading Systems forums, part of the Trading Forum category; Pre-Trend Chart Patterns Every Trader Should Know: Part I Talking Points: Benefits of Pattern Recognition The First Pre-Trend Pattern: Zig-Zag ...


  1. #1
    member ForeCastle's Avatar
    Join Date
    Apr 2013
    Posts
    1,077
    Blog Entries
    236

    Price Action and Patterns

    Pre-Trend Chart Patterns Every Trader Should Know: Part I

    Talking Points:

    • Benefits of Pattern Recognition
    • The First Pre-Trend Pattern: Zig-Zag
    • Setting Stops & Profit Targets

    “…markets are chaotic in nature, but within this chaos are non-random patterns that repeat and are predictable”
    -Larry Pesavento,

    Some traders love to look for common price action patterns before entering in the direction of the overall trend to improve the risk: reward ratio. Others however, prefer to steer clear from patterns and focus solely on price action. However, the two are not mutually exclusive and can be combined for a powerful trading combination whether you’re swing trading or day trading.

    Benefits of Pattern Recognition

    Let’s start off with the mental traps you can get into with pattern recognition. Of course, I’m a trader as well, and if you’re going to make progress and reach your goals, you must have the right mindset. The right mindset has us looking for a methodical edge that we can exploit with the full understanding that there is no guaranteed outcome on any trade, only risk with a favorable edge.

    Learn Forex: Sometimes an Edge Works & Other Times they do not


    However, pattern recognition has allowed me to enter trades at incredible turns with excellent risk: reward. This article will be the first of a 4 part series on common patterns that you should be aware of that precede the resumption of a trend.

    The First Pre-Trend Pattern: Zig-Zag

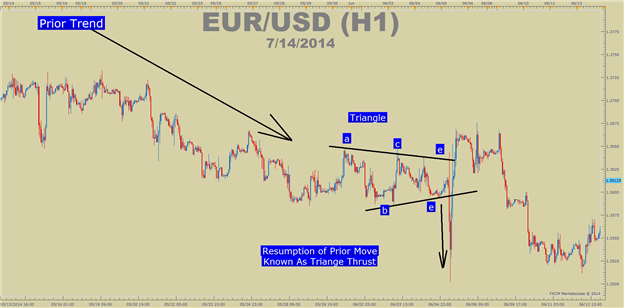
    The patterns that we will cover will span through common Elliott Wave patterns. While there is price action combinations such as pin bars or indecision candles that have a shorter-term focus, such as only a few candles counter-trend, this 4-part series will span the corrections known in Elliott Wave.

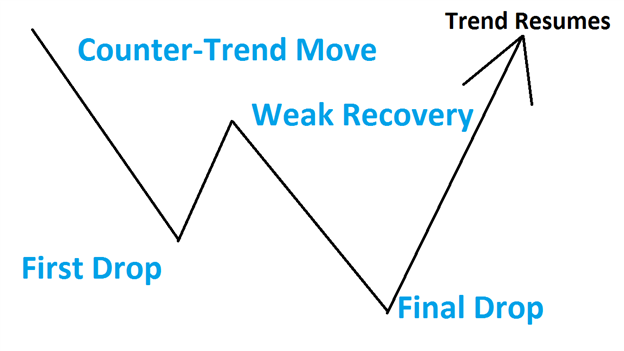
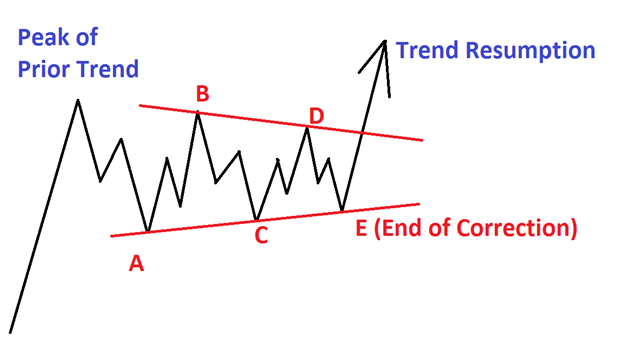
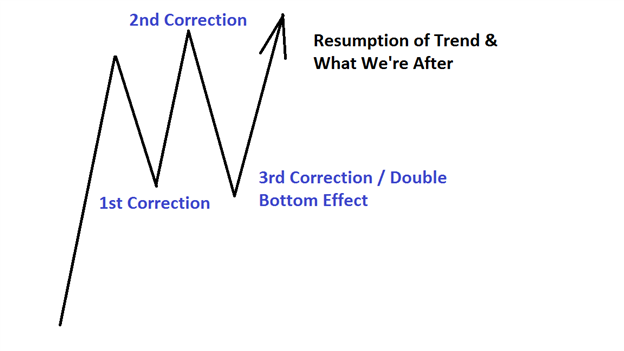
    In the nomenclature of Elliott Wave, it’s good practice to look for moves against the trend to develop in three-drives. These three wave patterns are what we’re going to focus on so that we can look to their exhaustion. When the counter-trend movement is exhausted, as we can see through price action and common patterns, we can look to enter back in the direction of the overall trend with limited risk in case we’re wrong about our entry and the trend isn’t ready to resume yet.

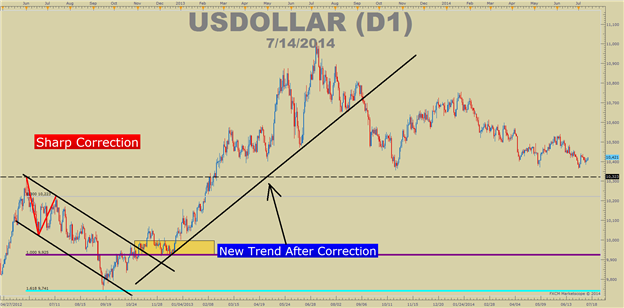
    Learn FX: Idealized Sharp 3-wave Correction (Not Likely on Candle Charts)


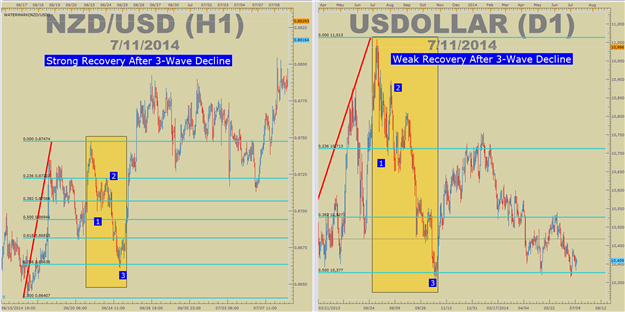
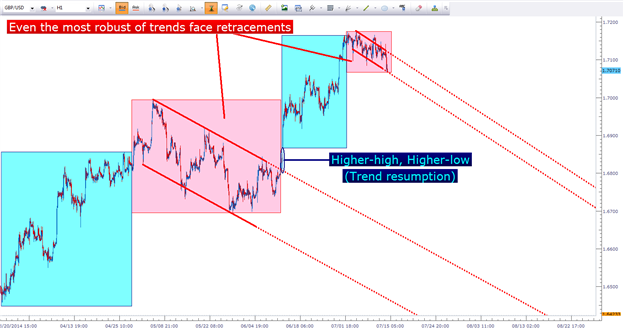
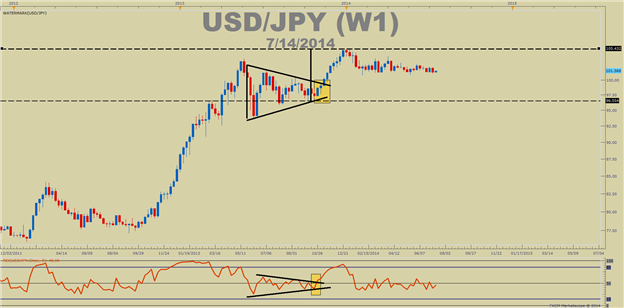
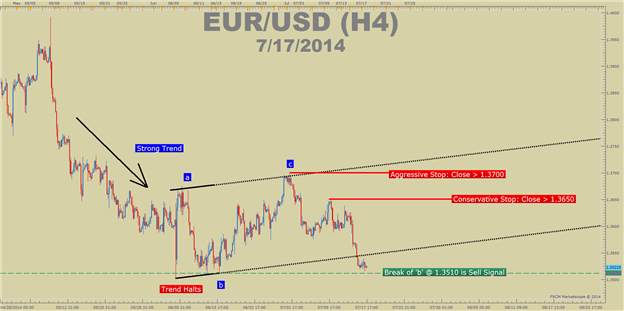
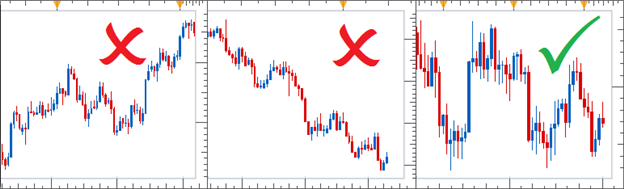
    The zig-zag is unique to the future patterns to be discussed as it is a sharp correction. This three-wave move often develops early in the trend. The clear sign that a zig-zag is in play is if the second move, in the direction of the prior trend, is very weak. If it’s very weak and another move against the trend develops, we can look for the end of that move to help us enter the trend.

    Setting Stops & Profit Targets

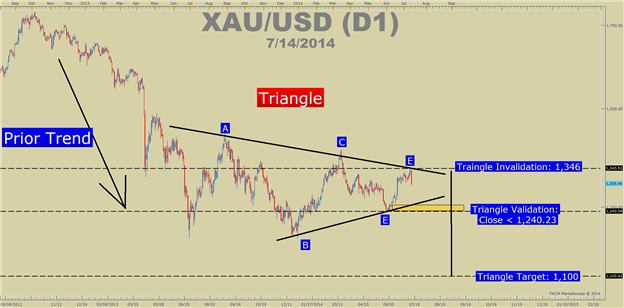
    There are three ways we can identify a zig-zag and additionally, use that information to enter back in the direction of the prior trend.

    • Look for the common sharp counter-trend three wave-moves
    • Apply Fibonacci Retracements to see if the exhaustion is at a Fibonacci Collision
    • Find price-action indecision at the end point that allows you to enter with a good risk: reward

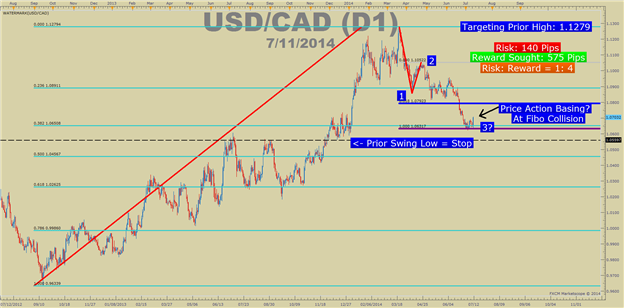
    Setting a stop is relatively easy, and so is setting a profit target. The stop can and should be placed below the prior swing low in an uptrend or prior swing high in a downtrend. You can choose one of two profit targets depending on your risk tolerance.

    Learn Forex: Risk: Reward Is the Focus of Entries on Corrections


    The conservative profit target is the prior turning point or recent high in an uptrend. If the trend truly does continue, then you will likely get out early but that’s OK as you saw an edge and were able to take money out of the market because of it. This is also a good methodology in a range-bound market.

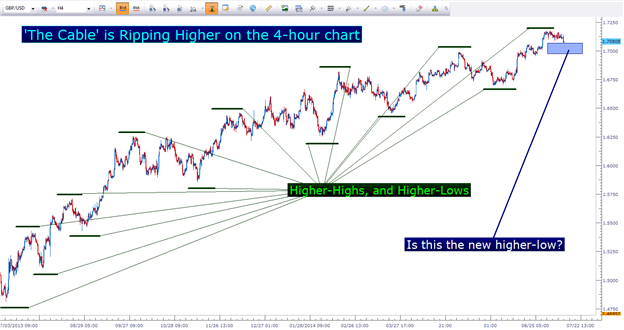
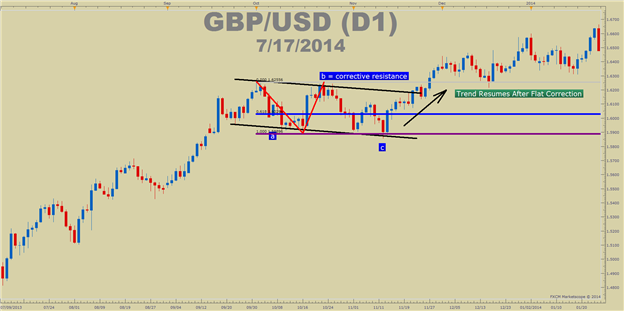
    The other option is to trade with only a trailing stop so that if the trend really does take off, you can try and ride it as long as possible. In a low volatility market this isn’t as favorable as true breakouts are hard to be sustained. However, there are always the few moves, like USDCAD or GBPUSD that defy the common patterns and a trailing stop is just the ticket.

    Closing Thoughts

    Because the 3-wave sharp correction happens at the beginning of the trend, when you recognize a potential entry, you should have a great risk: reward on your trade. Because we’re putting our stop below the prior low, we’re likely to be involved in the resumption of the prior trend or be alerted, through being stopped out, that a major reversal could be underway.

    Happy Trading!
    ---Written by Tyler Yell, Trading Instructor

    More...

  2. #2
    member ForeCastle's Avatar
    Join Date
    Apr 2013
    Posts
    1,077
    Blog Entries
    236

    How to Attack Trends Using Price Action

    In this article, we’re going to focus on what many traders consider to be the most attractive of the three conditions: Trends.

    Why Trends?

    Of the three possible market conditions, trends are often considered to be the most desirable for a few different reasons. Future price movements are unpredictable. Price action merely gives traders a clear and concise view of the market so that they can look to implement strong risk-reward ratios in their strategies.

    This is why trading in trending environments can be so attractive. If the trend is to continue, the trader can reap three, four, or five times the initial risk that was used to enter the position… and if the trend isn’t going to continue, the trader can look to cut their losses quickly.

    Further – trading trends via price action is a way to decrease ‘guess-work’ with fundamental analysis.
    If fundamentals are improving for an economy, then traders will generally look to buy in anticipation that those fundamentals may, eventually, bring on higher rates in that economy.

    As traders move prices higher with increasing demand, price action will show the up-trend with higher-highs and higher-lows; and if those rate expectations are to continue to increase and if the fundamental news is going to continue to improve, the rational expectation is that the trend will also continue to move higher.

    Threading the Needle with Multiple Time Frame Analysis

    Traders can use multiple time frame analysis to get two different vantage points of a market; with the primary goal being to enter trades and trigger positions in terms of the ‘bigger picture’ trend.

    Rather than basing the entirety of a trader’s decisions on a single time frame, traders can look to a longer-term chart to determine the ‘general condition’ and trend of that market. In the 4-hour chart below, we’re looking at GBPUSD making continual higher-highs and higher-lows over the past year:

    Up-trend in GBPUSD over the past year


    As you can see in the above chart, GBPUSD has been on a tear since July of 2013, putting in a +2200 pip up-trend; and this is shown via price action with the continual higher-highs and higher-lows.

    When a situation like this presents itself, the trader should look for opportunities to go long so that if this +2200 pip trend can continue, they can look to take part in the move.

    The only question is whether or not a new ‘higher-low’ has actually been made on this longer-term chart, and the answer to that will never be known until it’s too late. But this is the advantage of price action; the premise of whether or not this is going to be a ‘higher-low’ can allow the trader to look for a risk-efficient entry.

    Executing the Entry

    As we said above, you’ll never know whether a higher-low has been set until after price action has proven that the trend will continue: But the hypothesis that a higher-low ‘may’ have been set is enough for traders to assimilate risk management of a potential position.

    In the below chart, we’ve moved down to the hourly time frame so that we can more accurately plan an entry in the same market we had looked at above.

    The hourly chart presents greater granularity for plotting and planning the entry


    Traders can watch the shorter-term chart to begin planning their entries; and in the event of an up-trend, as was seen above, traders want to wait for support to be set (the higher low) so that they can look to buy with a stop just below that ‘higher-low.’
    What allows this to Work – and why are Trends so desirable?

    As we’ve said a few different times in this article, future price movements are unpredictable; and the goal of price action analysis isn’t to get a 100% accurate forecast of what will happen because nothing in this world can offer that.

    Rather, this is simply a way for traders to look to get the probabilities of success on their side, if even just a little bit by getting the most clear and concise view of a market.

    Make no mistake about it; retracements can last for a prolonged period of time. Case-in-point, check out the down-trending channels in the same GBPUSD chart we looked at just a moment ago:

    Traders can wait for higher highs and lows to show on entry chart before triggering position


    What allows trend trading via price action to work so effectively for some traders is the fact that if and when they’re on the right side of the trade, they can reap far more than they had to risk to get into the position.
    This could be a risk-reward ratio of 1-to-2, 1-to-3, or 1-to-4. Traders can look to ‘scale-out’ of positions as trades move further in their favor; even adding a break-even stop to ensure against taking a loss in the position should prices happen to turn around.

    If a trader is able to average out of their positions with a 1-to-2 risk-to-reward ratio, they need to be right approximately 33% of the time to break-even; spreads or commissions not included. If a trader wins $2 when they’re right, but loses only $1 when they’re wrong – well if they win 40% of the time, they stand a legitimate chance at making a profit: These traders don’t need to win 60 or 70% just to get a chance to break-even on their strategy.

    --- Written by James Stanley

    More...

  3. #3
    member ForeCastle's Avatar
    Join Date
    Apr 2013
    Posts
    1,077
    Blog Entries
    236

    Pre-Trend Chart Patterns Every Trader Should Know: Part II

    Talking Points:

    • Recap of the Zig-Zag & The Study of Corrections
    • The Second Pre-Trend Pattern: Triangles
    • Setting Stops & Profit Targets

    “All patterns fail, but the key is to know when to trade them and when to avoid them.”
    -Suri Dudella


    Trading patterns can be seen as a short-cut to in-depth technical analysis. You were recently introduced to the first type of corrective trading pattern known as a 3-wave correction or zig-zag, which commonly plays out before a trend. A Zig-zag is a sharp counter-trend moves that has the effect of flushing out the optimism of the prior trend before resuming again.

    Learn Forex: Example of a clean Zig-Zag


    Some traders will do in-depth Intermarket analysis or other types of lengthy analysis, which can be helpful. However, you only need three things to use this type of analysis successfully.

    • A well-defined trend with higher highs & higher lows (or reverse for down move)
    • Knowledge of the common pre-trend patterns (our objective with this series)
    • Knowledge of levels that validate trend resumption


    A firm knowledge of the prior three aspects will help you be ready to pounce when a new trend is born with a tight level of risk.

    The Second Pre-Trend Pattern: Triangles

    Of the corrective patterns, triangles are the easiest to recognize, but there are a few key points to keep in mind. First, a triangle habitually will involve 5-points against the prior trend composed of 3-wave movements. The triangle will often show a decline in volatility as price looks to be pressing against each other with break outs failing to develop.

    Learn Forex: Idealized Triangle (Not This Clean of Candle Charts)


    The reason that triangles are important to take note of are two-fold. First, they often chew-up the clock. In other words, they are sideways patterns that take time to develop and are best avoided for swing-traders. Second, they are of great use for finding great range-trading environment for range traders.

    When looking for the resumption of the prior trend, there are a few key points that should hold your focus. First, trendlines against the corrective extreme are helpful to see when a legitimate breakout occurs. Second, price action around Points C & D after they have been marked. Failure to break below the point marked, ‘C’, yet break above ‘E’, helps you to see a breakout has occurred.

    However, an important note about triangles is that they often occur prior to the terminal thrust or move within the trend. Therefore, you want to have a specific and conservative target along with a firm stop, to be in place so that you’re not holding onto a trade that starts profitable but ends with a drop in your account equity. While there is more to be said on triangles, please note they occur on multiple time-frames. Here’s a triangle on a EURUSD hourly chart and a USDJPY Weekly Chart

    Learn Forex: Hourly EURUSD Triangle


    You can see that the move out of the triangle was sharp and fast. Secondly, you‘ll notice that once that move / thrust was finished, a reversal developed. This is a helpful recognition that has put me in many trades at excellent levels.

    Learn Forex: Weekly USDJPY Triangle


    Setting Stops & Profit Targets

    The uniqueness of the triangle formation is that you can use the triangle itself as a target for the thrust. You do this by taking the height of the trend lines and apply the height in pips from the termination point of the triangle, known as point E. You can see from the chart of USDJPY that the target hit within a 5 pip range

    The stop on the triangle thrust trade can and should be below E, the last leg of the triangle. If you’re wanting to assume the end of the triangle, before it takes place, you can focus on a stop below ‘C’.

    Learn Forex: Triangle Target & Stops on XAUUSD


    If Gold is working out the first move out of the triangle, then we’d need to see a few levels give way. The first is a close below 1,304 (100-dma), which would place a stop above the level now marked, ‘E’ around 1,345.10. Because this is happening as oscillators are diverging negatively, we can turn our focus to the point marked ‘D’ near 1,240. A close below there would have us confidently looking for a thrust lower to resume while managing our trade carefully because this would likely be the terminal move to the downside.

    Happy Trading!
    ---Written by Tyler Yell, Trading Instructor

    More...

  4. #4
    member ForeCastle's Avatar
    Join Date
    Apr 2013
    Posts
    1,077
    Blog Entries
    236

    The Easiest Pre-Trend Price Pattern To Recognize & How to Trade It

    Talking Points:

    • Recap of thePrior Pre-Trend Patterns Discussed
    • The 3rd Pre-Trend Pattern: Flat Corrections / Double or Triple Bottoms
    • Setting Stops & Profit Targets

    If you can get a clean understanding of the typical patterns that develop before the trend resumes, you can find yourself entering at incredibly favorable entries with an excellent risk: reward ratio. This series of articles takes a look at common patterns that are known as trend corrections and can be applied to any time frame you trade.

    Recap of the Prior Pre-Trend Patterns Discussed

    The two patterns we’ve looked at so far are sharp zig-zags, which are 3-wave patterns against a prior trend that doesn’t make a new low and will often move into a Fibonacci retracement, and Triangles. Triangles are a congestion pattern that take up a decent amount of time but usually end with an aggressive thrust out of a triangle. A key note about triangles that we discussed was that the move out of the triangle can be the last move of the trend so you should be cautious of trend termination after the thrust out of the triangle is completed.


    Triangles are clean and easy to read, however being caught with an open trade during a triangle while anticipating a breakout can be frustrating. For that reason, the article discussed key technical levels that can help you seen what a triangle is likely over and the trend has resumed.

    The 3rd Pre-Trend Pattern: Flat Corrections / Double Bottom

    The name may not be exciting, but the flat correction is a clean pattern that can help traders clearly define and take advantage of risk. Also, the flat correction can take the form of an intra-trend double-bottom, which makes it easy to spot and trade. This type of move often happens after a strong or extended move but once broken, a stop can be put under the correctionary low or you can trail your stop with each new swing low.


    What’s important to see is that after a strong move higher or lower, the market goes into a period of consolidation or range environment. Cable or GBPUSD has had a handful of very clean flat corrections within the overall trend. You’ll notice that price makes no major moves higher or lower and looks to trace out the flag pattern, which is a traditional technical analysis pattern before resuming the trend.

    Clean Flat Correction Traces Out Before Trend Resumes


    When you’ve identified the making of a flat correction, you can look for three things to help you see that a flat correction is playing out and when the correction is over so that you can look to take a well-managed trade in the direction of the trend.

    • Draw a Channel from the Trend Top & ‘b’ Wave & Draw a Parallel to the ‘a’ point
    • Look For Fibonacci Relationships to Catch The Exhaustion of the Pattern
    • Look for the breaking of ‘b’ on a daily closes bases


    All three of these instances took place on this chart and a variation of these three will happen more often than one would think as you look for these flat corrections to take place on the chart before the trend resumes.

    Setting Stops & Profit Targets

    There are clear benefits and a few drawbacks to trading the easily recognizable flat pattern. The benefit is that it is easy to recognize in bull and bear markets and the risk is very clear when you believe a correction has ended. The drawback is that if you’re entering on a break of ‘b’, you might have a hard time finding a trade with a good risk: reward ratio if you’re putting your stop below the recent pivot. For that reason, I like to look for the corrective move within the leg of the trade you’re about to enter.


    You’ll notice above that you have two options for placing a stop when you recognize an entry. The path you choose will likely depend on your risk tolerance. If you’re looking to risk less, you’re likely going to choose the corrective high labeled as the “conservative stop”. The conservative name is due to taking on less risk to see if the trade works out in your favor.

    Happy Trading!
    ---Written by Tyler Yell, Trading Instructor

    More...

  5. #5
    member ForeCastle's Avatar
    Join Date
    Apr 2013
    Posts
    1,077
    Blog Entries
    236

    How a Range Strategy Can Make Sideways Markets Tradable

    Talking Points:

    • Price is considered range bound when it is not trending up or down.
    • We can connect swing highs and lows together to create support and resistance levels.
    • Entering a trade with a positive Risk:Reward ratio can tip the odds in our favor.

    Forex market conditions have been changing over the last couple years. Trend based strategies that worked well in the past are showing mixed results and frustrating many FX traders, myself included. However, recently I’ve been branching out into different strategies that embrace this low volatility environment. Today, we are going to talk about how a range strategy can make sideways markets tradable.

    Identifying a Sideways Market

    Our first step in range trading is to identify currency pairs that are moving sideways. We want to avoid currency pairs with prices that are sloping up or are sloping down. We can target whatever time frame and currency pair that we like, as long as recent price action has been more or less sideways.

    The image below is of 3 different currency pairs and their recent price moves. The 1st chart is a classic uptrend, the 2nd chart is a classic downtrend, and the 3rd chart is an example of a range. We want to find charts that don’t have a clear direction and are mostly moving sideways like chart #3.

    Uptrend, Downtrend, and Range Charts


    After we have found a few an examples of a potential ranging pair, it is then time to turn to technical analysis to help us find support and resistance.

    Locating Support & Resistance

    The terms “support” and “resistance” are trading jargon used to describe price levels where prices have bounced off of in the past. So anytime we see price bounce off a low or bounce off a high, that low and high price can be considered support or resistance.

    Identifying these highs and lows is very easy in my opinion. I prefer using a yellow ellipse on my Marketscope 2.0 charts to highlight the times where price has “bounced” from either a high or a low.

    Highlighting Highs and Lows


    The chart above shows a USDJPY daily chart with highlighted swing highs and lows. It looks like a mess at this point, but once we connect some of the ellipses together using the line tool, potential trading opportunities can be discovered.

    There are differing opinions on how lines should be drawn. I draw lines using a two-step process:
    The first step is to identify the highest high price and the lowest low price, and draw a horizontal line extending from each. The highest and lowest prices can act as strong support or resistance.

    The second step is to identify price levels that touch more than one ellipse; the more ellipses the better. So in this example, we can see there were a two main clusters of ellipses that were right around the same two price levels. We want to draw a horizontal line through both of those clusters.
    The results of these horizontal lines can be seen below.

    Connecting Highs and Lows to Create Support and Resistance Levels


    Trading With a Strong Risk:Reward Ratio

    Once our lines are in place, we are now ready to place a trade. Since these lines caused price to bounce off them in the past, they may cause price to bounce again in the future. So we want to look to buy when price is approaching a line from above and look to sell when price is approaching a line from below.

    It turns out that the USDJPY is right at one of the lower lines that we drew, giving us the possibility of buying at its current level.

    Our stop loss should be set beyond the line we are buying at or beyond the lowest low if it is not too far away. Because the lowest low is so close, I’ve opted to set my stop beyond that.

    Buy Trade Setup – Buying at Support With Positive Risk:Reward


    We want our exit strategy to have a positive risk:reward ratio, meaning we want our profit target (limit) to be further than where we set our stop. This is a key part of money management that can tip the odds in our favor.

    Keeping that in mind, we also want to try to place our profit target below the next closest line. This allows price to freely move to our profit target without being hindered by prior support or resistance levels.

    Revising Strategy for Ranges

    Traders that are fortunate enough to create a winning strategy must never get complacent. Changing market conditions can change your strategies effectiveness, so we need to be able to adapt. Low volatility usually leads to more market ranges, so it is good to know how to trade these types of scenarios.

    Good trading!
    ---Written by Rob Pasche

    More...

  6. #6
    member ForeCastle's Avatar
    Join Date
    Apr 2013
    Posts
    1,077
    Blog Entries
    236

    FX Reversals: EURCAD Resistance Update

    Talking Points

    • EURCAD starts week trading at R3 Resistance
    • Range targets sit at 1.4485, S3 pivot support
    • A move above 1.4555, R4 would signal a breakout on a higher high

    EURCAD 30min Chart


    The EURCAD has begun the week, trading near short term R3 resistance. With price failing to break out in early morning trading, range traders will look to take advantage of prices continuing to reverse back into the defined trading range pictured above. Currently range resistance is holding at 1.4532 as marked by the R3 pivot point. With price below this value, range traders can consider new sell entries in the event of an early morning price reversal. Range support currently stands at the S3 camarilla pivot which can act as potential range targets near 1.4485.

    Range traders should be cautioned of a breakout above the R4 camarilla pivot point. A move beyond R4 resistance at 1.4555 would signal a short term move towards higher highs, and denote an increase in volatility as well as a change in market conditions. At this point, range trading should be concluded and traders can consider entries with the markets new influenced direction. Likewise, a break below S4 support at 1.4464 would signal a creation of a new daily low and signal potential further declines.


    ---Written by Walker England, Trading Instructor


    More...

  7. #7
    member ForeCastle's Avatar
    Join Date
    Apr 2013
    Posts
    1,077
    Blog Entries
    236

    FX Reversals EURUSD Intraday Breakout

    Talking Points

    • EURUSD opens US trading below S4 pivot
    • A bias towards lower lows remains under 1.3502
    • A move above 1.3512 would signal a potential false breakout

    EURUSD 30min Chart


    The EURUSD has begun the US trading session beneath daily S4 camarilla pivot. Price began this drop by first falling below range support at 1.3512. As price continues to move towards lower lows, breakout and trend traders will look to take advantage of the currency pairs continued downside momentum. Currently price has surpassed a 1x extension of the camarilla pivot trading range, but as long as price remains under the previously mentioned line of support day traders and market scalpers can continue looking to initiate new sell based positions on the EURUSD.
    Breakout traders should always be aware of the potential for a false breakout. A move back above the S3 line of support would signal another price reversal for the day and an end to current market conditions. At this point, breakout and momentum trading should be concluded and traders can consider entries with the markets new influenced direction.


    ---Written by Walker England, Trading Instructor

    More...

  8. #8
    member ForeCastle's Avatar
    Join Date
    Apr 2013
    Posts
    1,077
    Blog Entries
    236

    What is a Good Win Ratio?

    As I’ve traveled and given FX strategy presentations around the world, one question that frequently comes up from the audience is an inquiry about the strategy’s win and loss ratio. In essence, the listener is attempting to judge the quality of the strategy by its win ratio.
    (The win ratio is simply the number of winning trades divided by the total number of trades. For example, a trader who won on 15 of 20 trades would have a 75% win ratio.)


    When confronted with the question about a strategy’s win ratio, I’ll provide the audience of my opinion and then follow up with another question.

    “Do you think that a 45% win ratio is a good win percentage?”

    I can tell by the gazed looks of most attendees that they are not sure how to respond.

    On the one hand, if the win percentage is not good enough, why would the DailyFX EDU team teach the strategy?

    IF that previous statement was true, then where is the line drawn between a good strategy’s win ratio and the poor strategy’s win ratio?
    I then follow up with another question, “I have a strategy that wins on 90% of its trades. Are you interested in seeing the strategy’s buy and sell rules?” Inevitably, I will get several interested parties who raise their hand.

    I’ve seen too many traders drawn to higher win ratios thinking they are better strategies when in fact the ratio is not giving insight about the strategy profitability. The point here is that judging a strategy solely based on its win ratio is like judging a book solely based on its cover. You don’t get the whole story and a win ratio in isolation could be misleading.

    How can a strategy that wins on 90% of its trades be a losing strategy?

    How can a strategy that wins on 45% of its trades be a winning strategy?

    The answer lies in analyzing the strategy’s win ratio alongside the risk-to-reward ratio. The result of the analysis provides us with an expectancy of the strategy.

    For example, the reason the 90% win ratio loses money is because it wins a lot of small trades, and then loses big.

    You can do the math yourself to see if a strategy is expected to produce positive results over time. Simply take the average number of winning trades multiplied by the average size of the winner in pips. Then, subtract the average number of losing trades multiplied by the average size of loser in pips. The result is your expectancy.

    Let’s compare two hypothetical examples of Strategy ‘A’ that wins 90% of the time and strategy ‘B’ that wins only 45% of the time.
    Forex Education: Strategy ‘A’ wins 90% of Trades


    Notice how even though strategy won on 90% of the trades, it still lost over the long haul as the 10 losers lost more ground than the 90 winners made.

    Now, let’s look at Strategy ‘B’.

    Forex Education: Strategy ‘B’ wins 45% of Trades


    On the other hand, this strategy with a 45% win ratio and 1-to-2 risk-to-reward ratio has a positive expectancy. Over the long run, this type of strategy is expected to show net profits. (A 1-to-2 risk-to-reward ratio means that for every pip of risk, there are at least 2 pips of potential reward.)

    In the first example above (Strategy A), clearly the trader is risking a lot while profiting a small amount. Although they might feel good about being on the winning side of the trade frequently, they are blind-sided when the strategy is negative after a basket of 20 or 50 trades.

    Many traders fall into this camp because they get emotionally tied to a trade and take profits too quickly or hang onto losing trades too long. There are many reasons for getting emotionally attached from lacking confidence in their trading knowledge or perhaps over leveraging their account. Regardless of the reason, the outcome has a negative bias associated with taking profits too quickly while exposing your account to relatively larger losses.

    On the other hand, Strategy B wins on fewer trades, but the trader is confident in their approach in that their edge is the risk management on the trade. They are not as concerned about winning on each trade and are more concerned about progress being made over a basket of trades.
    Whether you are analyzing your own trading performance or the performance for choosing a Forex automated strategy, take a minute and run through the calculations above to see if the strategy yields a positive expectancy.

    ---Written by Jeremy Wagner, Head Trading Instructor, DailyFX Education

    More...

  9. #9
    member ForeCastle's Avatar
    Join Date
    Apr 2013
    Posts
    1,077
    Blog Entries
    236

    FX Reversals: EURAUD Breaks Support

    Talking Points

    • EURAUD opens US trading below S4
    • A bias towards lower lows remains under 1.4257
    • A move above 1.4296 would signal a potential false breakout

    EURAUD 30min Chart


    The EURAUD began its sharp overnight decline on Aussie CPI data coming out in line with expectations. Price began to immediately drop, and move below trading range support at 1.4296. The end result was price breaking out and now trading under the S4 support line found at 1.4257. As price continues to move towards lower lows, breakout and trend traders will look to take advantage of the currency pairs continued downside momentum.

    Price of the EURAUD has repeatedly tested the S4 line of support, and Breakout traders should always be aware of the potential for a false breakout. A move back above the S3 Camarilla pivot point, would signal another price reversal for the day and an end to current market conditions. At this point, breakout and momentum trading should be concluded and traders can consider fresh entries with the markets new influenced direction.


    ---Written by Walker England, Trading Instructor


    More...

  10. #10
    member ForeCastle's Avatar
    Join Date
    Apr 2013
    Posts
    1,077
    Blog Entries
    236

    FX Reverseals: AUDUSD Support Update

    Talking Points

    • AUDUSD Moves to Support at .9431
    • R3 Range Resistance Sits at .9476
    • Price Under S4 Signals a Breakout to New Lows

    AUDUSD 30min Chart


    The AUDUSD spent most of the overnight trading session reversing between key points of support and resistance. With price failing to break out below S4 pivot support, range traders will look to take advantage of prices reversals back into the defined trading range pictured above. Currently, range support for the AUDUSD is found at .9431 as denoted by the S3 pivot point. With price above this pivot, range traders can consider new buy entries in anticipation of an early morning price reversal. Range resistance currently stands at the R3 camarilla pivot which can act as potential range targets near .9476.

    Range reversal traders should always be cautioned of the potential for a breakout. A move below the S4 support line at .9409 would signal a short term move towards lower lows, and signal a change in current market conditions. At this point, range trading should be concluded and traders can consider entries with the markets new influenced direction.


    ---Written by Walker England, Trading Instructor


    More...

Page 1 of 7 1 2 3 ... LastLast

Tags for this Thread

Bookmarks

Posting Permissions

  • You may not post new threads
  • You may not post replies
  • You may not post attachments
  • You may not edit your posts
  •