Page 4 of 7 FirstFirst ... 2 3 4 5 6 ... LastLast
Results 31 to 40 of 70

Price Action and Patterns

This is a discussion on Price Action and Patterns within the Trading Systems forums, part of the Trading Forum category; Talking Points -Short term triangle keeps the larger triangle pattern in play -An immediate move below 117.28 negates the short ...


  1. #31
    member ForeCastle's Avatar
    Join Date
    Apr 2013
    Posts
    1,077
    Blog Entries
    236

    USD/JPY Stuck in a Triangle

    Talking Points
    -Short term triangle keeps the larger triangle pattern in play
    -An immediate move below 117.28 negates the short term triangle
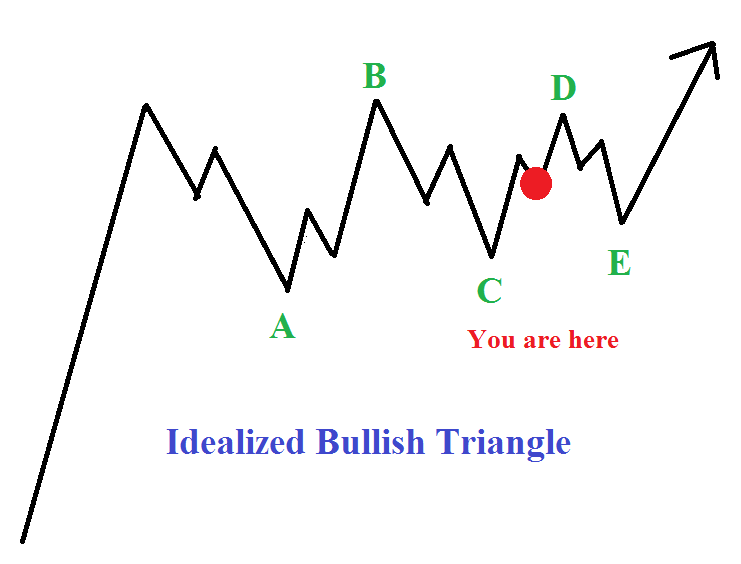
    -Look for resistance 119-120 to end wave D of a bullish triangle

    The USDJPY has been stuck in a sideways range since December and appears to be carving out a larger degree 4th wave triangle. That means that each of the 5 sub-waves of the triangle should shape up as a zig-zag, triangle, or combination between them.


    Indeed, the price action for the past week appears to be carving out a smaller degree triangle. Triangles are one of my starting points in identifying a wave count because there are only certain places in the count where triangles form.
    Therefore, this smaller degree triangle is in play so long as we are above 117.28. Use this level as risk for a revisit to the 119-120 handle.

    USD/JPY 2 Hour Price Chart


    More...

  2. #32
    member ForeCastle's Avatar
    Join Date
    Apr 2013
    Posts
    1,077
    Blog Entries
    236

    EURUSD Reverses Early Morning Decline

    Talking Points
    • EURUSD opens to a false breakout
    • Today’s trading range starts at 1.0707
    • A breakout above 1.0796 may signal a broader reversal

    EURUSD 30 Minute Chart


    The EURUSD has opened this morning attempting to breakout towards lower lows. However, despite printing a new weekly low at 1.0675 price has failed to stay below its S4 pivot at 1.0678. Price is currently being seen moving back inside of its pivot range, starting at the S3 Camarilla pivot found at 1.0707. If price remains supported at this value, it may suggest a price bounce from this point towards values of resistance. Currently todays R3 pivot sits at 1.0767, completing todays 60 pip range.

    In the event that price trades back below its S4 pivot, this would open the possibility of another daily close lower for the week. However, a reversal through today’s trading range and a breakout above the R4 pivot at 1.0796 would suggest a reversal back in the direction of the EURUSDs previous short term trend.


    ---Written by Walker England, Trading Instructor

    More...

  3. #33
    member ForeCastle's Avatar
    Join Date
    Apr 2013
    Posts
    1,077
    Blog Entries
    236

    USDJPY Finds Daily Resistance

    Talking Points

    • USDJPY starts trading in a 59 pip range
    • Price is bouncing from support at 124.47
    • R4 breakouts begin at 125.35

    USDJPY 30 Minute Chart


    The USDJPY has moved to a new 2015 high this week, peaking at a price of 125.05. However, price found resistance at this point, under today’s R3 Camarilla pivot at 125.06. After testing resistance the USDJPY quickly descended through today’s 59 pip trading range, back to values of support. The pair is currently being supported by the S3 Camarilla pivot, found at 124.47. It should be noted that prices have already traversed through today's pivot range once, causing traders to look for ranging market conditions to continue unless a breakout scenario develops.

    In the event of a breakout, traders will begin looking towards the R4 pivot found at 125.35. Such a move would create a new high for the USDJPY, and suggest a return of momentum back in the direction of the daily trend. Conversely, a move below the S4 pivot at 124.18 would suggest a bearish reversal counter to the markets primary direction. In either scenario, a breakout would signal an end to the present range bound market and traders can begin to adjust their strategies accordingly.


    ---Written by Walker England, Trading Instructor

    More...
    Premium Trading Forum: subscription || The Forex Guide to Fundamentals Fundamentals
    Trading blogs || My blog

  4. #34
    member ForeCastle's Avatar
    Join Date
    Apr 2013
    Posts
    1,077
    Blog Entries
    236

    EURGBP Double Bottom View Backed by FX Sentiment & Volume Analysis

    Talking Points:
    • EURGBP trading volume was muted on 3 attempts at multi-year lows
    • Double Bottom Pattern looks to have attractive risk: reward
    • EURGBP SSI shows 84% of traders are short favoring further upside off higher low

    “All truth passes through three stages. First, it is ridiculed. Second, it is violently opposed. Third, it is accepted as being self-evident.”
    Arthur Schopenhauer, German philosopher (1788 – 1860)

    A failure on a chart can easily communicate as much as a confirmed move. Some of the best trades come when a prior held move is invalidated because it isn’t catching the bids it previously had. Such a scenario seems to be playing out cleanly on EURGBP. This failure has brought together a chart pattern, sentiment signal, as well as volume validation of a trade against the prior trend.
    The failure on EURGBP brings a clear message for the time being. The message is that the market has little to no interest in additional exposure long GBP and short EUR below 0.7000. The inability for the market to build momentum past this point favors the new move higher. A key way to recognize this lack of momentum is to see whether price and volume are in agreement or disagreement around this level. Because volume dropped when approaching this key zone, we’ll look for a trade set up that favors a new directional bias.

    Price Action and Patterns-eurgbp-w1-metaquotes-software-corp-temp-file-screenshot-40735.png


    Complementing sentiment and volume is the technical analysis approach. Technical analysis looks for potentially repeatable patterns that can provide an edge, so long as risk is managed. The chart above shows EURGBP working out a potential double-bottom patter. This is a reversal pattern and should be watched carefully for invalidation.

    More...
    Premium Trading Forum: subscription || The Forex Guide to Fundamentals Fundamentals
    Trading blogs || My blog

  5. #35
    member ForeCastle's Avatar
    Join Date
    Apr 2013
    Posts
    1,077
    Blog Entries
    236

    EUR/USD Wave Structure Points Towards 1.09-1.10

    Talking Points
    -Today’s break below 1.1200 clears the wave picture
    -Expanded flat downward correction likely continues towards 1.09-1.10
    -Long opportunity near 1.09-1.10 with 1.0815 as risk level

    With the EURUSD breaking below 1.1200 earlier today, it elevates the potential of an expanded flat downward correction according to Elliott Wave Theory.


    For those unfamiliar with Elliott Wave Theory, it is a form of technical analysis that assesses the characteristics of the waves without regard to the corresponding news. When reading this article, remember that Elliott Wave is probabilistic in that anything is possible so long as it conforms to the Elliott Wave theory rules.

    With that said, each pattern has an idealized look and guidelines exist as to its ‘typical’ shape. Those counts that fit many guidelines are considered higher probability in nature, but that doesn’t mean what is anticipated will occur. As with any risk in the market, know where you are wrong and get out of the trade when the market is carving something else.

    Well, now that prices have broken below 1.1200, this elevates the expanded flat pattern identified last week as the higher probability move.

    Expanded Flat

    The higher probability scenario we are currently tracking is a smaller degree expanded flat correction that eventually works down towards 1.09-1.10.

    Expanded flats are corrective moves meaning they move in the direction against the trend. In this case, since it is a downward expanded flat correction, we can anticipate that once this flat is exhausted, we’ll see a continuation of the EURUSD trend higher (see idealized pattern above).

    Since the expanded flat is a corrective move, it will unfold in three bigger waves labeled on the chart below as (a)-(b)-(c). The sub-waves give a 3-3-5 appearance meaning wave (a) consists of three waves, wave (b) consists of three waves, and wave (c) consists of five waves.

    Therefore, it appears we are in the middle of wave the (c) wave lower. Since the (c) wave typically acts as a false break on the (a) wave, prices could dig into the 1.09 handle.


    Expanded flats are challenging patterns that are designed to fool many traders. It is essentially a dual false breakout pattern. We experienced a false breakout higher above the June 4 high which means we’ll likely see a false break below the June 5 low.

    Once this expanded flat is exhausted, there will be an opportunity to buy the EURUSD and target new highs above 1.15. Therefore, if a trader enters near 1.10 with a 1.08 stop loss and a target of 1.15, that provides a target 2.5 times the distance of the stop loss.

    Other Possibilities

    As mentioned above, Elliott Wave is probabilistic in that nothing is certain, simply likely. Therefore, another option which would transpire calls for a break below 1.0815. Therefore, this 1.0815 level is key to determining the direction of the medium term trend.


    More...
    Premium Trading Forum: subscription || The Forex Guide to Fundamentals Fundamentals
    Trading blogs || My blog

  6. #36
    member ForeCastle's Avatar
    Join Date
    Apr 2013
    Posts
    1,077
    Blog Entries
    236

    CAC40 Prepares for an Inside Bar Breakout

    Talking Points
    • The CAC40 is set to close inside Fridays price action
    • Reference resistance is set at 4,950
    • Current ATR sets bullish projections to 4,904.21

    Like many indicies around the world, the CAC40(FRA40) is hovering near new highs for the month of October. The index has experienced a fresh round of bullish momentum based on the most recent statements from the ECB suggesting that the central bank may exapand their current QE program. However, after Thursdays initial breakout and Fridays continuation, the CAC40 can be seen consolidating to start this weeks trading.

    Price Action and Patterns-insidebar1.png


    The CAC40 is set with the formation of an inside bar pattern. This formation is indicative of market consolidation, and is created using Fridays candle as a reference for values of support and resistance. Support is identified using Fridays low at a price of 4,822. Resistance is found using Fridays high at a price of reference of 4,950. With prices closing “inside” today, traders may begin preparing for a breakout later in the week.

    Price Action and Patterns-cf-w1-alpari-limited.png


    In the event that the market breaks through either support or resistance, traders may use ATR to plan their projections for the index. Currently 1X daily ATR reads at 82.21 which will place bullish projections at a price of 4,904.21. Conversely, if prices break through support at 4,822, traders will begin to project prices towards a value of 4,739.79 on fresh bearish momentum.

    Alternatively, if prices fail to breakout, it may signal continued consolidation for the CAC40 along with other indices. In this scenario, any breakout of support or resistance may be delayed. Traders may continue to wait for a breakout in this scenario, or opt to look for new range based positions based off of the markets current conditions.

    more...
    Premium Trading Forum: subscription || The Forex Guide to Fundamentals Fundamentals
    Trading blogs || My blog

  7. #37
    member ForeCastle's Avatar
    Join Date
    Apr 2013
    Posts
    1,077
    Blog Entries
    236

    Buy or Sell: EUR/USD Stares Down A Big Week

    Talking Points
    -Huge event risk this week with ECB monetary policy statement and the US jobs report
    -Bullish patterns suggest a minimal move back towards 1.08-1.09
    -On Balance Volume and Sentiment readings suggest a mature trend ripe for a reversal

    For those who don’t closely watch the FX markets, this is a big week for the EUR/USD and a big month for the US Dollar Index. On Thursday, ECB President Mario Draghi will provide a statement regarding the ECB’s monetary policy. Economists are expecting a shift towards expansion of the QE program which could weigh heavily on the EUR.

    Additionally, we have the US Non-Farm Payroll report coming out on Friday. One month ago, the NFP report was a surprise to the upside which fueled additional expectations for a Fed rate hike coming up December 16.

    On the one hand, you have a central bank (ECB) which is leaning towards more easing. On the other hand, you have the Fed contemplating when to raise rates. FX traders love diverging monetary policies between two central banks as it can create strong trends. This is in large part why the EUR/USD has sold off aggressively for the past 5 weeks. However, these fundamental stories have yet to unfold and even if they do, is this the beginning of the trend or a buy the rumor then sell the news type of trade?
    As we look through the technical patterns, it appears the higher probability move is for a couple hundred pips of US Dollar weakness. This could send the EUR/USD higher towards 1.08-1.09.

    Price Action and Patterns-eurusd-w1-alpari-limited.png


    Bullish Scenario – Completion of the Ending Diagonal

    Until November 18, 2015, the moves lower have appeared impulsive. However, the sustained move below 1.0615 has occurred in sloppy over lapping waves. As we pointed out in Monday’s US Opening Bell webinar, one pattern we keep an eye on in that situation is a diagonal pattern (image 1 above). Since the diagonal is appearing towards the end of a long move lower from August, we believe it is taking shape as an ending diagonal pattern. This pattern typically retraces to the origination which happens to be near 1.0830. A move above 1.1090 suggests the correction lower is complete with a likely retest towards 1.17 down the road.

    Bearish Scenario – Wave iii of (iii)

    A break below 1.0440 would leave the chart as labeled in Image 1 as incorrect. That is because on an immediate drop below 1.0440, wave iii would be the shortest of waves i, iii, v which is not allowed under Elliott’s rules.

    Therefore, we shift the patterns towards being in the middle of a wave iii of (iii) lower. Since 1.0440 is the point of invalidation for longs, a stop and reverse order could be considered near there.


    more...
    Premium Trading Forum: subscription || The Forex Guide to Fundamentals Fundamentals
    Trading blogs || My blog

  8. #38
    member ForeCastle's Avatar
    Join Date
    Apr 2013
    Posts
    1,077
    Blog Entries
    236

    USD/CAD Ranges Ahead of FOMC

    Talking Points
    • USD/CAD remains locked in a 57 pip range
    • US Dollar pairs wait for FOMC

    Price Action and Patterns-usdcad-d1-alpari-limited.png


    Expectations are set for the Fed to raise key rates to .50%. However, if the Fed again leans towards inaction, it could cause increased volatility for US Dollar based pairs. As such, traders may continue to monitor values of support and resistance for market direction up until tomorrows even at 13:00 GMT. Currently, the USD/CAD is trading at today’s central pivot at 1.3732 after bouncing from support, which is found at 1.3703. Prices have already traded through today’s 57 pip range twice, with resistance found at the R3 camarilla pivot at a price of 1.3760.
    Traders looking for a late day breakout for the USD/CAD, should continue to monitor the S4 and R4 pivots. A move above the R4 pivot point at 1.3789, would be seen as a bullish continuation after last weeks 397 pip advance. Conversely, a move below the S4 pivot at 1.3674 would be significant, as it would signal a potential change in the markets trend.

    more...
    Premium Trading Forum: subscription || The Forex Guide to Fundamentals Fundamentals
    Trading blogs || My blog

  9. #39
    member ForeCastle's Avatar
    Join Date
    Apr 2013
    Posts
    1,077
    Blog Entries
    236

    Gold Prices Trade in a Triangle Ahead of NFP

    Talking Points

    • Gold Traders Prepare for a Breakout Ahead of NFP
    • Bullish Breakouts Begin Over $1,248.44

    Price Action and Patterns-xauusd-d1-alpari-limited.png


    Gold prices have remained relatively quiet this morning, and are currently range bound ahead of tomorrow’s NFP (Non-Farm Payrolls) data release. Tomorrow’s NFP announcement is set to provide volatility for a variety of US Dollar based pairs, and potentially create event risk for commodities. Current expectations for the event are set at 193k. It should be noted that last month’s release came in under expectations at 151k. This miss spurred an immediate selloff in the US Dollar, while also sending Gold prices higher.

    Technically, Gold is currently consolidating in a symmetrical triangle as seen in the graph above. In the event of a bullish breakout, traders will first look for prices to rise above Tuesdays high at $1,248.44. At that point, traders may begin to target a new 2016 high above $1,263.37. Conversely, bearish breakouts begin under support found near 1,225.0. In this scenario, traders can potentially look for the beginning of a new downtrend after initially targeting the triangle low at $1,190.82.

    more...
    Premium Trading Forum: subscription || The Forex Guide to Fundamentals Fundamentals
    Trading blogs || My blog

  10. #40
    member ForeCastle's Avatar
    Join Date
    Apr 2013
    Posts
    1,077
    Blog Entries
    236

    Gold Prices Press 4 Week Lows

    Gold prices dropped today on the heels of the Brussels attack yesterday. From yesterday’s high to today’s low in XAU/USD, a CFD which tracks gold, we have a $45 range or over 3% of the price. This negative price action over the emotional two day period suggests the pressure in the short term on gold is to the down side.

    Price Action and Patterns-xauusd-h8-metaquotes-software-corp.png


    From a technical perspective, the gold price correction does not appear to be complete. Shorter term, there are two wave relationships showing up near $1210. Though today’s low of $1215 might be close enough to satisfy the shorter term correction, the medium term retracement has been rather shallow at near 25% in price.

    Price Action and Patterns-xauusd-h12-metaquotes-software-corp.png


    Elliott Wave technical analysis would suggest perhaps a deeper dip into the $1190-$1195 price zone may offer a compelling risk to reward ratio opportunity to the upside.

    more...
    Premium Trading Forum: subscription || The Forex Guide to Fundamentals Fundamentals
    Trading blogs || My blog

Page 4 of 7 FirstFirst ... 2 3 4 5 6 ... LastLast

Tags for this Thread

Bookmarks

Posting Permissions

  • You may not post new threads
  • You may not post replies
  • You may not post attachments
  • You may not edit your posts
  •