Page 2 of 6 FirstFirst 1 2 3 4 ... LastLast
Results 11 to 20 of 52

The Forex Guide to Fundamentals

This is a discussion on The Forex Guide to Fundamentals within the Trading Systems forums, part of the Trading Forum category; Talking Points NFP Is a Highly Anticipated News Event Expectations are Set at 230k Traders Will Track the USD Based ...


  1. #11
    member ForeCastle's Avatar
    Join Date
    Apr 2013
    Posts
    1,077
    Blog Entries
    236

    Forex News: Trading Fridays NFP Release

    Talking Points

    • NFP Is a Highly Anticipated News Event
    • Expectations are Set at 230k
    • Traders Will Track the USD Based on Results

    The release of the monthly Non-Farm Payroll figures is a highly anticipated moment for Forex traders. This is with good cause as the Non-Farm Payrolls, also known as NFP, has been historically known to produce volatility in the market place. As with other news releases on the economic calendar, traders will use this data to determine the strength or weakness of the underlying economy. NFP specifically looks at whether the US economy is expanding or contracting through new jobs being added to the labor force. With NFP set to be released this Friday at 8:30am ET,let’s take a momentto preview this week’s upcoming event.

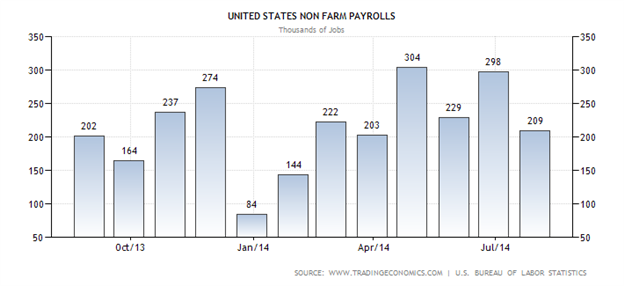
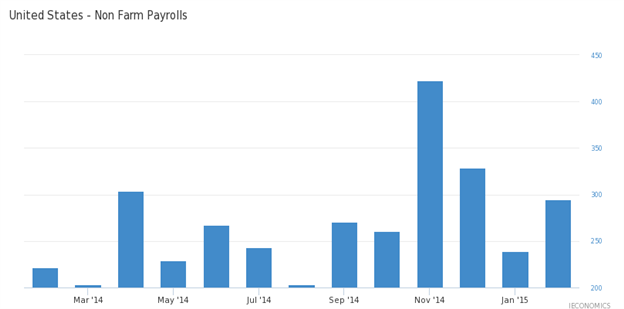
    First, NFP looks specifically at net changes in employment as jobs are created or subtracted in an economy in any given month. The term Non-Farm is used since farm / agricultural workers are not included in the employment count. The decision to not include agricultural jobs lies in these jobs being largely seasonal that could possibly produce small temporary shifts in labor reporting. Below we can see a composite of past NFP events from September 2012 through last month’s release. Through graphing we can see that employment figures have gradually been getting higher, after bottoming with the 2014 low of Just 84k new jobs reported in January.


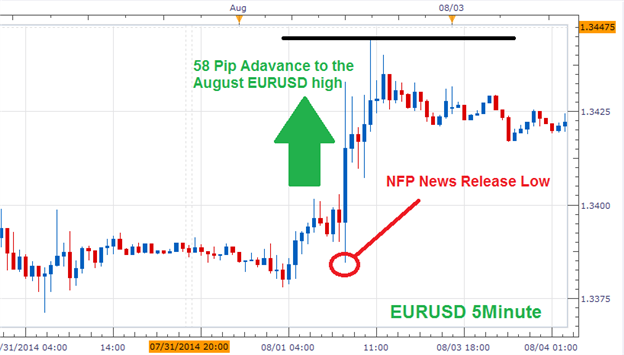
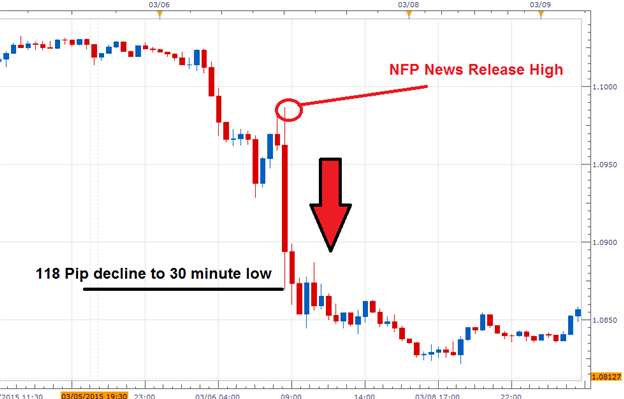
    To get an idea of what may be in store for this week’s NFP announcement, we can take a moment and review last month’s event. Below we can see a EURUSD 5 minute chart tracking price during the NFP news release. NFP numbers were expected to be released at 230k, meaning analysts expected 230,000 new jobs to be added to the economy. However, at the time of release the NFP number was issued lower than expected at 209k. Traders were left to react to this lower number with the market immediately reacting by selling off the US Dollar. After a few hours price action settled with the EURUSD increasing in value as much as 58 pips from the event low at 1.3189.

    It should be noted that even though the news print was slightly lower than expected, traders generally took this data as USD positive. The August 1st high at 1.344, proved to be the monthly high for the EURUSD, with the USD rallying as much as 333 pips against the EUR through yesterday’s price action.

    EURUSD August 2014 NFP Release


    So what should traders look for this month, with NFP totals again being released on Friday the 5th? Expectations are set for 216k new jobs to be created. Taking a cue from last month’s report, if expectations are missed this could again lead to a selloff of the US Dollar across multiple currency pairs. However if NFP numbers are better than expected, or if the number is a narrow miss, traders may take this as a positive sign and look for the US Dollar to rally. Once a direction is established traders can then trade the news using the strategy of their choosing.

    ---Written by Walker England, Trading Instructor

    More...

  2. #12
    member ForeCastle's Avatar
    Join Date
    Apr 2013
    Posts
    1,077
    Blog Entries
    236

    Trading Forex In a Runaway Market Due to News Events

    Talking Points:

    • What Causes a Runaway Market
    • Identifying a Runaway Market on the Charts
    • Indicators to help you exit in an Orderly Fashion

    “Buy the Rumor, Sell the News”
    -Trading Lore

    Markets can experience many types of emotions. These emotions can easily be seen on the chart using price action that moves higher, lower, or sideways. When markets move in one direction too far too fast however, that can lead to excited traders without a plan for exiting, which is dangerous.

    Stages of a Runaway Market


    What Causes a Runaway Market?

    At the risk of oversimplification, forex markets trade on available information about the economies backing the currencies. When no new information is present that would change anyone’s view, the markets tend to move sideways. Therefore, if there is no news the markets tend to be range bound between easily identifiable levels of support and resistance.
    When new information comes into the market, the nature of the market news can cause a sharp move. Depending on the nature of the news, the moves can be sharp and many times before the news prints, if a credible rumor comes alive that many believe, the markets move higher / lower aggressively in anticipation.

    Anticipated News Can Move Markets More Aggressively Than News Itself


    Identifying a Runaway Market on the Charts

    There are a few ways to identify a runaway market in the FX Market so you can find the one that works for you. You can also use the same methodology to find when the runaway market is slowing down or potentially reversing. The methods that are commonly looked to identify runaway markets on the charts are oscillators, like the Relative Strength Index or RSI, a sharp angled trendline or the very valuable Heikin-Ashi modified Candle.

    RSI Behaves Differently In Strong Trends


    When a market becomes extended, the RSI will show an “overbought” reading for an extended period of time. RSI being overbought is not a sell signal until the overbought range is broken and even then should be watched carefully. Strong trends can have weak retracements before resuming in the direction of the overall trend.

    Indicators to help you exit in an Orderly Fashion


    You can benefit from recognizing the early signs of a reversal so that you can step aside from a good trade when the probability of a profit taking move is underway.

    As shown above, markets that chase price higher or lower will often show similar characteristics via momentum. For example, RSI can get compressed in the upper range of 70-100 in an uptrend or the lower range of 30-0 in a downtrend. You can use simple trendlines on RSI to see when a break is occurring or look for RSI divergence to help you see when you should tighten your stops or potentially take profits.

    Closing Thoughts

    When new information gets pumped into markets, traders get excited and new potential values based on the rumors can cause traders to buy or sell emphatically. When you find yourself in this situation, you should enter your trades carefully and manage your risk even more carefully.
    Traders love new possibilities as any IPO on the New York Stock Exchange can help you to see and because of the potential, reason goes out the window. You can use this to see when the momentum in favor of the runaway trend extends in which case you can stay in the trade or when the momentum begins to breakdown so that you can safely step aside.


    Happy Trading!
    ---Written by Tyler Yell, Trading Instructor


    More...

  3. #13
    member ForeCastle's Avatar
    Join Date
    Apr 2013
    Posts
    1,077
    Blog Entries
    236

    USD/CAD Extends Higher on Surprise Rate Cut

    Talking Points
    -Bank of Canada surprises with a 25 basis point cut due to drop in Oil
    -USD/CAD rockets higher on the news
    -Potential extended 5th wave of the Elliott Wave sequence

    The USDCAD has gained nearly 450 pips in the last two days. Prices accelerated higher after the Bank of Canada surprised the market with a 25 basis point cut. Oddly enough, 7 years ago tomorrow (January 22, 2008), the Bank of Canada and the Federal Reserve released emergency rate cuts to the market to keep deflation at bay. Here we are 7 years later and fighting the forces of deflation in Europe which is trying to sneak onto North American soil.

    Though the larger degree Elliott Wave count going back to 2007 could be debated, the recent price action suggests we are in an extended wave 5. There is a wave relationship that comes into play near 1.2550. The reaction, if any, at the 1.2550 price level will provide additional clues about the importance of that wave measurement.

    USD/CAD Daily


    Since Canada relies on oil, a strong move in oil can also drive the USDCAD.


    -Written by Jeremy Wagner, Head Trading Instructor, DailyFX EDU


    More...

  4. #14
    member ForeCastle's Avatar
    Join Date
    Apr 2013
    Posts
    1,077
    Blog Entries
    236

    NFP Expectations for April

    Talking Points

    • NFP is historically a volatile event
    • Last month’s miss caused the EURUSD to decline over 118 pips
    • Expectations for this Friday sit at 248k

    NFP (Non-Farm Payrolls) figures are released monthly and is one of the markets most highly anticipated events. This event tracks monthly changes in employment in the United States, and gives traders a glimpse into the health of the economy. Also, it should not be overlooked that the FED (Federal Reserve) looks to these employment numbers to influence their decisions regarding monetary policy.
    Below we can see a series of the 12 previous NFP totals graphically displayed. While these numbers have been mixed, it is important to see what effects they can have on the Forex market. So how can NFP affect the market, and what are the expectations for Friday’s event?


    The previous NFP event transpired last month on March 6th. To review, expectations were set at 235k, but on release the figures surprised the market. As seen in the graph above, the total amount of new jobs outside of the agricultural sector came in at 293k. This beat of expectations quickly drove traders to accumulate the US Dollar against the majority of major currencies.

    Below we can see the price action for the EURUSD during the March NFP event using a 30 minute chart. Immediately after the announcement, prices formed a new lower high for the week at 1.0988. This rise in price only lasted seconds, as traders began to accumulate US Dollars on the news. This caused prices to drop as much as 118 pips over the next 30 minutes. Not only did the EURUSD decline for the day, this event caused the EURUSD to continue its trend and form a new monthly low in the following trading week.
    So what can we expect for Fridays trading?


    The next NFP event is set for this Friday April, 3rd at 8:30 am New York time. After reviewing last month’s release, it makes sense for traders to be on their guard for unexpected volatility at this time. Currently expectations are set for 248k. Traders should primarily focus on whether or not NFP beats or misses expectations. By using last month as a model, a beat above expectations could cause another major US Dollar rally. Conversely, if prices miss expectations, it could signal a sell off for the US Dollar against other Major G8 currencies.


    ---Written by Walker England, Trading Instructor


    More...

  5. #15
    Administrator newdigital's Avatar
    Join Date
    Feb 2013
    Posts
    10,473
    Blog Entries
    2909
    Follow newdigital On Twitter Add newdigital on Facebook Add newdigital on Google+ Add newdigital on MySpace
    Add newdigital on Linkedin
    Just to remind that we are having news trading tools (related to dailyfx calendar) as the following:

    - DailyFX Economic Calendar indicator for new MT4 is on this post. This is updated version for the new MT4 (build 600 and above).
    - DailyFX Economic Calendar indicator for MT5 is on this post.
    - NewsTrader EA based on DailyFX Economic Calendar and forex-factory calendar is on this thread. Templates and pre-set files (the settings) for 5.96 version is on this post.
    Premium Trading Forum: subscription, public discussion and latest news
    Trading Forum wiki || MQL5 channel for the forum
    Trading blogs || My blog

  6. #16
    Administrator newdigital's Avatar
    Join Date
    Feb 2013
    Posts
    10,473
    Blog Entries
    2909
    Follow newdigital On Twitter Add newdigital on Facebook Add newdigital on Google+ Add newdigital on MySpace
    Add newdigital on Linkedin
    This is DailyFX Economic Calendar indicator for MT4:

    The Forex Guide to Fundamentals-eurusd-h1-alpari-limited.png


    The Forex Guide to Fundamentals-eurusd-h1-alpari-limited-2.png

    Premium Trading Forum: subscription, public discussion and latest news
    Trading Forum wiki || MQL5 channel for the forum
    Trading blogs || My blog

  7. #17
    Administrator newdigital's Avatar
    Join Date
    Feb 2013
    Posts
    10,473
    Blog Entries
    2909
    Follow newdigital On Twitter Add newdigital on Facebook Add newdigital on Google+ Add newdigital on MySpace
    Add newdigital on Linkedin
    This is DailyFX Economic Calendar indicator for MT5:

    The Forex Guide to Fundamentals-eurusd-m5-metaquotes-software-corp.png

    Premium Trading Forum: subscription, public discussion and latest news
    Trading Forum wiki || MQL5 channel for the forum
    Trading blogs || My blog

  8. #18
    Administrator newdigital's Avatar
    Join Date
    Feb 2013
    Posts
    10,473
    Blog Entries
    2909
    Follow newdigital On Twitter Add newdigital on Facebook Add newdigital on Google+ Add newdigital on MySpace
    Add newdigital on Linkedin
    This is NewsTrader EA:

    The Forex Guide to Fundamentals-newstrader1.png


    The Forex Guide to Fundamentals-newstrader2.png

    Premium Trading Forum: subscription, public discussion and latest news
    Trading Forum wiki || MQL5 channel for the forum
    Trading blogs || My blog

  9. #19
    member ForeCastle's Avatar
    Join Date
    Apr 2013
    Posts
    1,077
    Blog Entries
    236

    GBP/USD: post NFP bearish breakdown

    The Forex Guide to Fundamentals-gbpusd-m30-alpari-limited.png


    • "The US Dollar has initially rallied from this news, causing pairs such as the GBP/USD to decline in value. Now that NFP has concluded traders may continue to watch for further declines under today’s S4 pivot point, which resides at a price of 1.4556. In the event of a breakout below this value traders may begin to extrapolate today’s 59-pip range to find initial targets near 1.4497."
    • "If the current bout of US Dollar strength begins to falter, traders will begin looking for bullish reversal for the GBP/USD over 1.4585. This value is represented above by the S3 pivot point, and a move beyond this point may suggest price action attempting to test values of resistance. It is worth noting that range resistance is currently found at 1.4644, and todays R4 pivot point resides at a price of 1.4674. In the event that prices trade up to these values, it would suggest that the GBP/USD’s bearish momentum has at least temporarily concluded."

    The Forex Guide to Fundamentals-gbpusd-h4-alpari-limited.png


    If H4 price will break 1.4505 support level from above to below so the bearish breakdown will be continuing.
    If H4 price will break 1.4644 resistance level to above so the local uptrend as the bear market rally will be started.
    If H4 price will break 1.4731 resistance so we may see the reversal of intra-day price movement from the primary bearish to the primary bullish market condition.
    If not so the price will be ranging within the levels.


    more...
    Premium Trading Forum: subscription || The Forex Guide to Fundamentals Fundamentals
    Trading blogs || My blog

  10. #20
    member ForeCastle's Avatar
    Join Date
    Apr 2013
    Posts
    1,077
    Blog Entries
    236

    The GBP/USD Breaks Lower by 100 pips on NFP Data

    GBPUSD intra-day price (M5 timeframe) broke key support level for 100 pips lower during the NFP news events:

    The Forex Guide to Fundamentals-gbpusd-m5-alpari-limited.png


    • "The GBPUSD is currently rebounding off its daily lows after declining during today’s NFP (Non-Farm Payrolls) event. NFP figures were expected to be released at +190k; however, these expectations were missed with a total of 151k. Initially major pairs declined against the US Dollar. As seen above, the GBP/USD is still trading below todays S4 Camarilla pivot point at 1.4511. If the pair continues to fall, traders may extrapolate today’s 77 pip trading range to place initial bearish targets at 1.4434."
    • "In the event of a bullish price reversal, the GBP/USD will first need to rebound above 1.4550. This area on the chart represents range support, and a move here would suggest a change in the present bearish market conditions. With today’s S3 pivot being found at 1.4550, range resistance is conversely found at the R3 pivot at a price of 1.4625."


    more...
    Premium Trading Forum: subscription || The Forex Guide to Fundamentals Fundamentals
    Trading blogs || My blog

Page 2 of 6 FirstFirst 1 2 3 4 ... LastLast

Tags for this Thread

Bookmarks

Posting Permissions

  • You may not post new threads
  • You may not post replies
  • You may not post attachments
  • You may not edit your posts
  •