 12Likes
 LinkBack URL
 About LinkBacks


why? just download from the forum using this threadOriginally Posted by topcat275


This is a discussion on Ichimoku within the HowToBasic forums, part of the Announcements category; Originally Posted by topcat275 Hi, For some reason I am not able to get any of the indicators from Igor ...
why? just download from the forum using this thread
Premium Trading Forum: subscription, public discussion and latest news
Trading Forum wiki || MQL5 channel for the forum
Trading blogs || My blog


Hi, Thanks for getting back to me so quick. why? just download from the forum using this thread, . I cant open where you say (this thread), or any of the indicators from Igor. I dont know why.
It was wrong link sorry. Corrected now.
This link trading forum wiki
Premium Trading Forum: subscription, public discussion and latest news
Trading Forum wiki || MQL5 channel for the forum
Trading blogs || My blog

Talking Points:
- Major JPY crosses never broke out bearishly in Q1 2014
- Ichimoku Momentum Only Showed A Correction
- Signals For GBP/JPY Trend Continuation Abound
“Be patient and wait for the fat pitch.”
-James Montier
As fun as trends are to trade, they are rarer than many would like to admit. The number that often floats around with traders is that markets only trend about a 1/3 of the time. In other words, 2/3rds of the time, markets are in a correctionary pattern, an Elliott Wave term, or are ranging before their next breakout either higher or lower.
Today’s article is going to discuss how a multitude of JPY crosses like USDJPY, EURJPY, GBPJPY, and others are starting to show bullish signs again. Our preference for viewing an overall shift is Ichimoku which incorporates a trend filter, momentum, & a time component.
Major JPY Crosses Never Broke Out Bearishly
Many JPY crosses hit their 2014 highs on January 2nd, the first trading day of the year. This sounds like a bearish statement, however the downside lasted only a handful of weeks before the rebound began. What’s more, the JPY cross downside was limited as you can see that USDJPY only retraced ~50% from the October ’13 to January ’14 range.
Learn Forex: USDJPY & GBPJPY Weakness Was Limited in Q1 2014
Without Ichimoku, you can see that at the very least, USDJPY continues sideways or moves higher. The technical terms is that USDJPY either impulse higher or corrects sideways in a triangle formation which shows that the downside is limited. In other words, what won’t go down will often eventually go up.
Ichimoku Momentum Showed a Correction
Ichimoku allows you to grasp the entire market and its trending power in one glance. If you’d like a fuller view of the indicator, you can see the explanation here. However, with Ichimoku, when price is above the cloud and the lagging line or Chinkou Span is also above the cloud then you have both price and momentum in a trend.
Learn Forex: USDJPY is near a Bullish Breakout from Ichimoku’s Viewpoint
EURJPY & GBPJPY are also popular pairs to trade. Ichimoku has done a great job with GBPJPY to help you decipher a trend correction vs. a trend reversal. The ability to abstain from chasing a false breakout alone make Ichimoku a great tool to add to your trading. The benefit to using Ichimoku is to allow the trend filter to help you focus on price action patterns like the bullish pennant forming on GBPJPY.
Learn Forex: GBPJPY near Bullish Breakout Point at 173.56
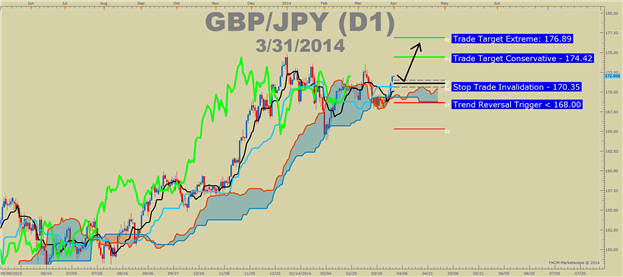
Signals for GBP/JPY Trend Continuation Abound
The GBP has been one of the strongest currencies around the world although not as strong as the AUD. Of course, when a strong trend as present, many trades revolving around one very strong or one very weak currency be successful which is the reason behind trading the basket approach. The basket approach discussed in this article is the developing JPY weakness and specifically with the GBPJPY
Learn Forex: Levels Worthy of a GBPJPY Ichimoku Buy Signal
Entry to Buy: Price Holding > 170.5 (Base Line – Light Blue)
Protective stop: 170.35 (Below the Weekly Opening Range / Top of Cloud)
Limit: 174.42 (Conservative) / 176.89 (Extreme Trend) Based on Monthly Pivots
If this is your first reading of the Ichimoku report, here is a quick run-down on buy side rules:
-Full Candle Bodies above the Kumo Cloud
-The trigger line (black) is above the base line (light blue) or is crossing below
-Lagging line is above price action from 26 periods ago (Bright green line)
-Kumo ahead of price is bullish and rising (blue cloud = bullish Kumo)
Happy Trading!
---Written by Tyler Yell, Trading Instructor
More...
Ichimoku Trading for Beginners
====
Tenkan Kijun Senkou Span B Trading system is on this post with many indicators and templates. Trading rules are on this post.
Ichimoku Abraham Trend system is on this thread.
Ichimoku Alerts
- IchimokuAlert_v1 indicator for Metatrader 5 is on this post. This is the indicator with arrows/signals and alerts on them : Tenkan/Kijun, Chinkou/Cloud, Chinkou/Price and 4-all together
- IchimokuAlert_v1.1 indicator for Metatrader 5 is on this post. Warning alert was improved and autosettings feature was added.
Ichimoku average indicators:
- #Soho_Ichi_Average indicator is on this post
- #Soho_Ichi_Average_v1 indicator made by Igorad is here.
IchimokuHisto
- IchimokuHisto_v1 indicator is on this post. The indicator was created for "Chinkou Span crossing the historical price (candle) with 26 candles before current price".
- IchimokuHisto_v1.2 indicator is on this post. Improvement: color is gray if chinkou between High - Low candlestick; 26 shift forward for histogram position incl for recent chinkou - more explanation is on this post.
- Kumo vs Candle indicator and Tenkan Sen-Kijun Sen Histo2 indicator are on this post.
- Kijun-Sen_Envelopes indicator is on this post.
Ichimoku discussion thread is here.
Ichimoku_Monitor indicator is on this post. It is monitoring ichimoku signal on multi timeframe, based off various ichimoku strategies.
Alternative_Ichimoku_cfb_mtf indicator is on this post.
ichi380v8 indicator is on this post. This indicator coded based on ichimoku tenkan/kijun cross signal strategy.
Premium Trading Forum: subscription, public discussion and latest news
Trading Forum wiki || MQL5 channel for the forum
Trading blogs || My blog

Ichimoku: Strategies, Setups and What to Watch for
Many traders have had challenges trading the JPY pairs. However the Japanese traders have had large amounts of success in trading their native currency. This is not just due to familiarity, but the approach and indicators they use to measure key levels for these pairs - the Ichimoku Cloud.
This indicator is not only easy to learn, but highly accurate in giving JPY trading signals. When one learns how to use it correctly, one can build a very high accuracy and profit ratio trading the JPY pairs which can be some of the most volatile. Taking this class can give you a chance to master trading the yen and learn a unique approach to trading the Asian pairs as a whole.
Premium Trading Forum: subscription, public discussion and latest news
Trading Forum wiki || MQL5 channel for the forum
Trading blogs || My blog
Ichimoku Basics
Ichimoku indicator description
- Tenkan Sen - moving average of the highest high and lowest low over the last 9 trading days. (Highest high + Lowest low) / 2 over the last 9 trading days
- Kijun Sen - moving average of the highest high and lowest low over the last 26 trading days. (Highest high + Lowest low) / 2 over the last 26 trading days.
- Senkou Span A - the average of the Tenkan Sen and Kijun Sen, plotted 26 days ahead. (Tenkan Sen + Kijun Sen) / 2 plotted 26 days ahead
- Senkou Span B - the average of the highest high and lowest low over the last 52 days, plotted 26 days ahead. (Highest high + Lowest low) / 2 over the last 52 trading days plotted 26 days ahead.
- Chikou Span - the closing price plotted 26 days behind.
Premium Trading Forum: subscription, public discussion and latest news
Trading Forum wiki || MQL5 channel for the forum
Trading blogs || My blog
Ichimoku Part 2
- Tenkan Sen / Kijun Sen Cross - very weak signal but it is coming as the first one ... but it may be a lot of false signals
- price crossing Kijun Sen - more strong signal
- price crossing Sinkou Span A line (Kumo Breakout)
- price crossing Sinkou Span B line (Kumo Breakout)
- Senkou Span A crossing the Senkou Span B (trend reversal)
- Chikou Span crossing historical price - it is most strong signal for Ichimoku but it is lagging on timeframes started with H1, and not lagging for lower timeframes.
The combination of all those 6 signals = Ichimoku indicator.
Premium Trading Forum: subscription, public discussion and latest news
Trading Forum wiki || MQL5 channel for the forum
Trading blogs || My blog
Ichimoku Indicator - What's Best Time Frame to Use it?
On our "Q&A Friday," we had a question is from Ari who wrote:
"Hi Kiana, I find your book very easy to read. I noticed that you are a bit in favor of Ichimoku Kinko Hyo. My question to you is: what are the best time frames in correlation with Ichimoku ? Peace! Ari"
Premium Trading Forum: subscription, public discussion and latest news
Trading Forum wiki || MQL5 channel for the forum
Trading blogs || My blog

Talking Points:
- Value of Ichimoku
- Transitioning to Short-Term Thinking
- An Example with GBPUSD
Many traders favor finding trends at some level of the chart. The trend may be within an overall range, but these traders know if they can catch an intermediate trend, that one move can make their day, week, or month if they catch it right. Thankfully, Ichimoku can help you limit risk while capturing upside.
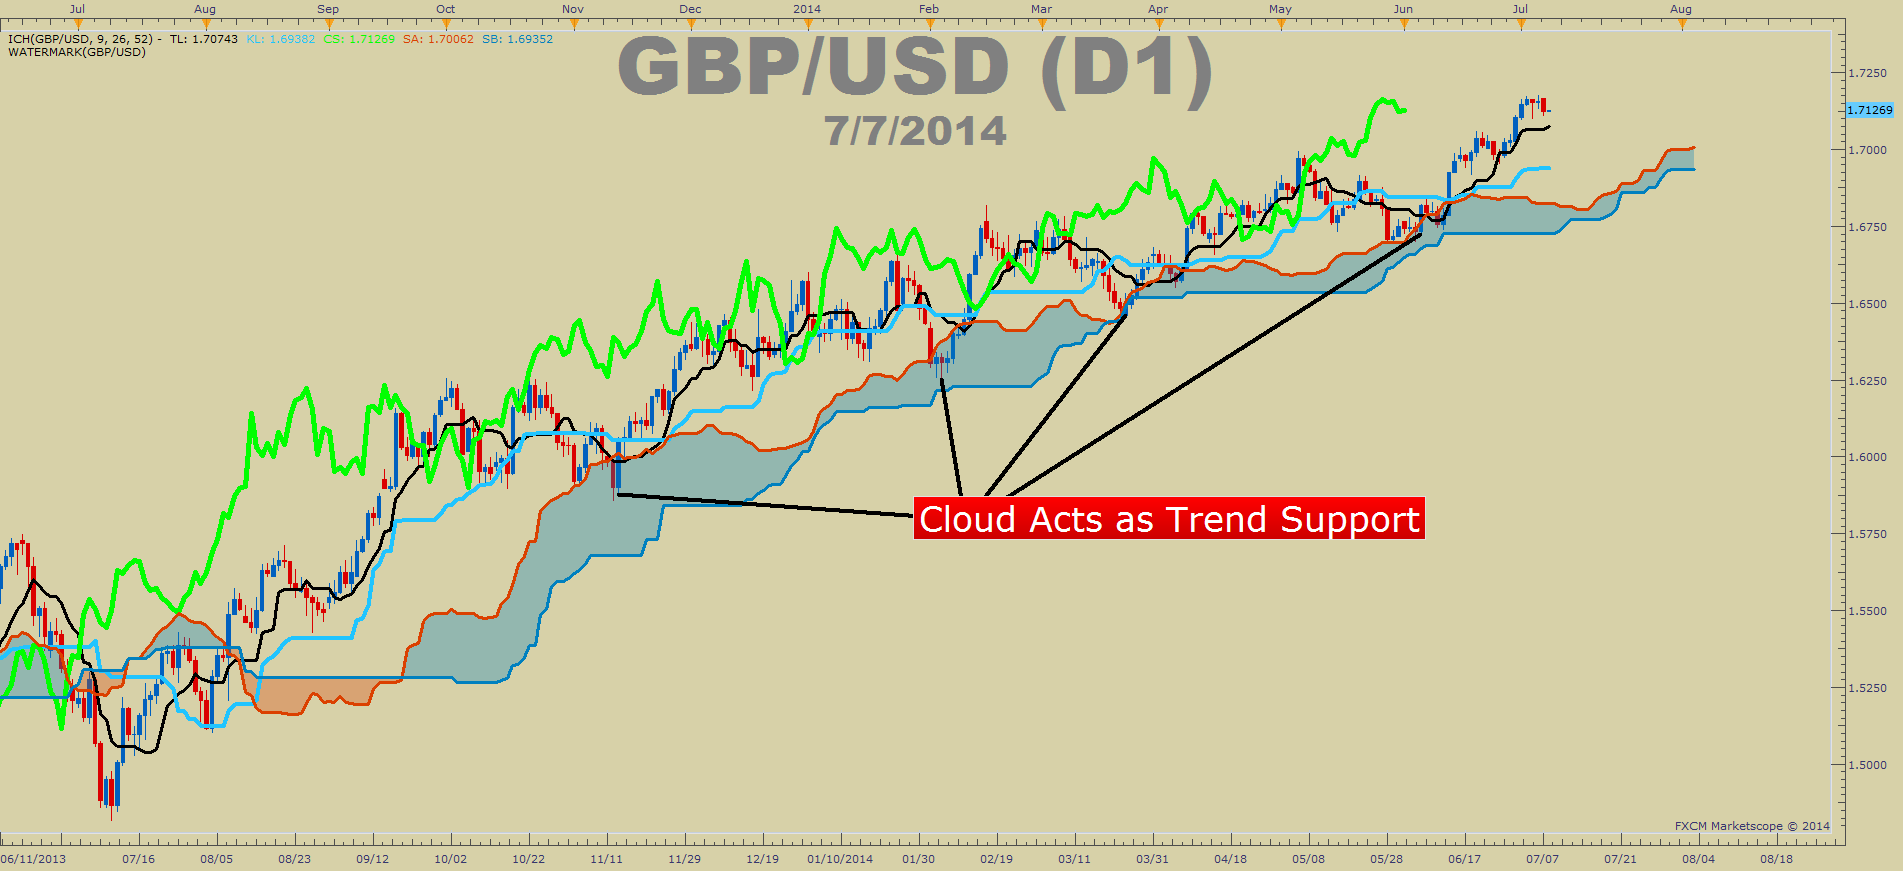
Value of Ichimoku
Ichimoku is a trend following indicator that in and of itself can comprise an entire trading system. The value of Ichimoku is the visual display of different forms of support in an uptrend or resistance in a downtrend. Regardless of your bias or approach, the cloud is a helpful tool to easily spot the path of least resistance in the market.
Learn Forex: Ichimoku Example
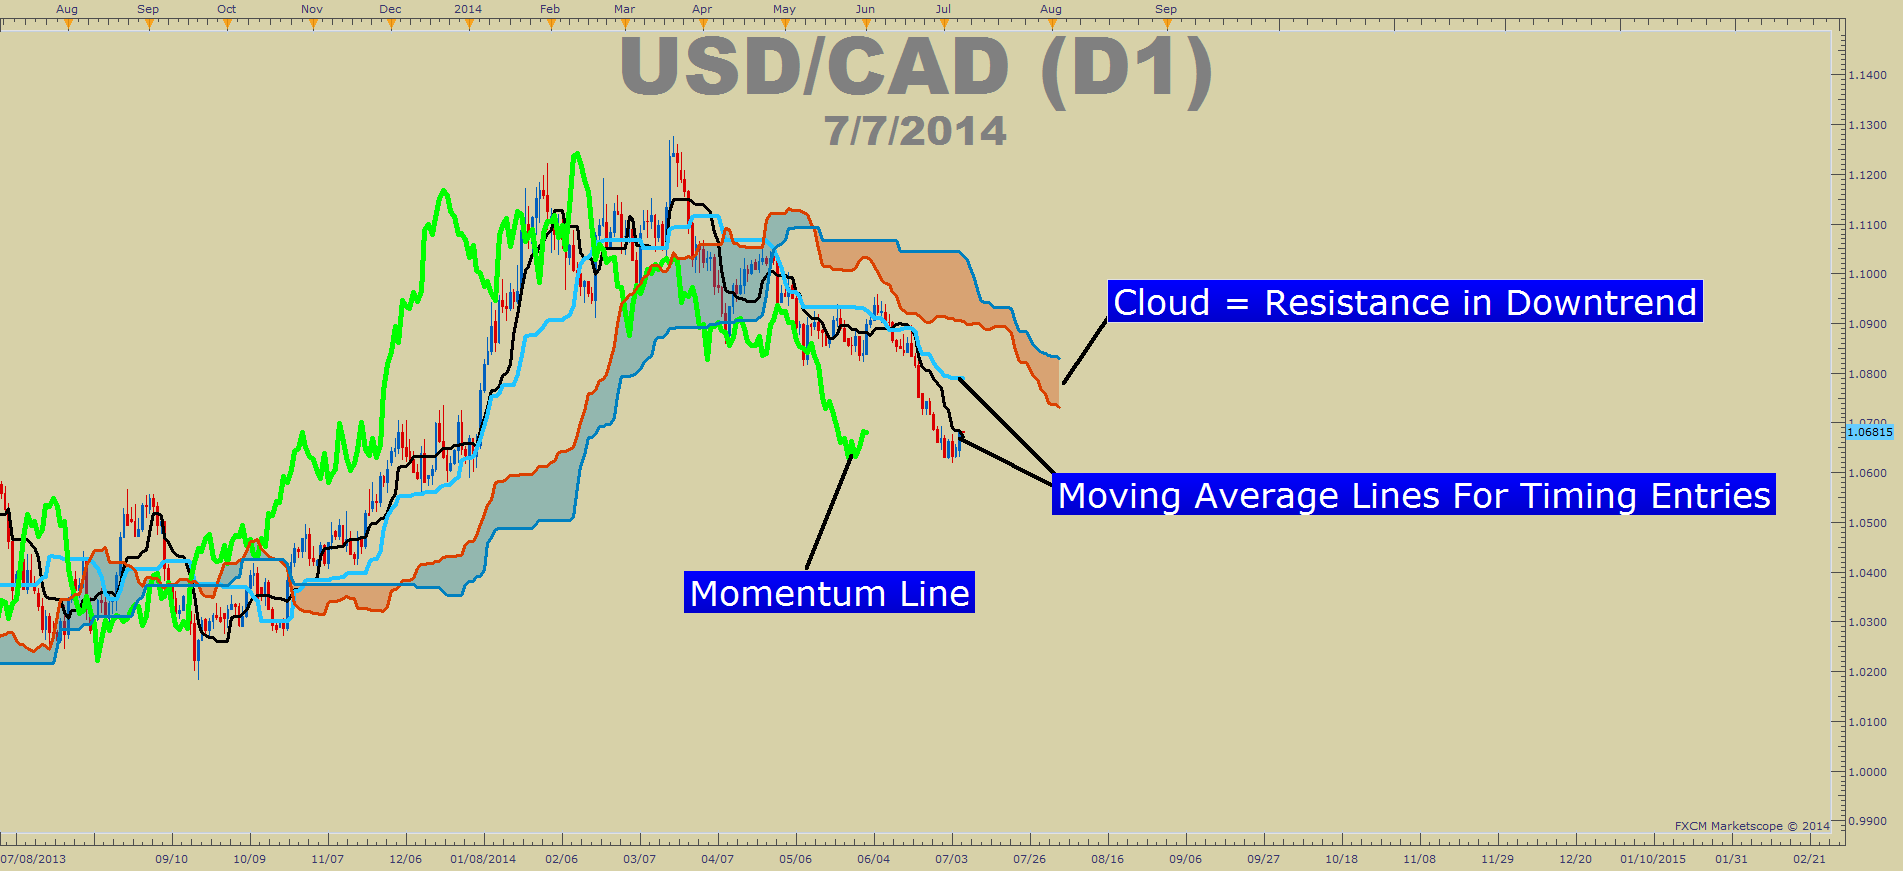
Each component of Ichimoku is helpful. However as you start to focus on shorter time frames two components become more critical. Those two components are the Cloud & the Momentum line.
Learn Forex: Ichimoku Diagram
Transitioning to Short-Term Thinking
To focus on short-term trading requires an eye for a few specific things. First, you need to know that trade management will make or break your trading and unmanaged stops and limits may leave you disappointed in the overall end result.
Second, you’re effectively trading momentum. Once momentum expires, so does your interest in the trade. Lastly, you’re best riding in the direction of the intra-day trend which can be defined by price riding the cloud.
An Example with GBPUSD
Based on what you just read, as a short-term trader, you’re focused on short-term trends and their corresponding momentum. If you want to take this within the scope of potential longer-term tops and bottoms you’re welcome to but of course, the idea here is to limit risk significantly by getting out of a trade when the intra-day trend reverses.
For those interested in the potential of a GBPUSD reversal and the potential resistance points on the major pair, here are a few things to look at followed by a short-term Ichimoku chart for you to focus on:
GBPUSD has been recently trading within a historically pivotal area around 1.7130-1.7180 but has failed to sustain a rally through there. Last week’s high was exactly 1.7180 with no follow through seen since then. The overall long-term set-up is similar to 1998, a time period that we have extensively referred to with regard to the USD-Index. Also, sentiment has reached extremes on multiple sentiment indicators. Short-term dynamics are also pointing to a correction within the uptrend.
Applying the short-term scope of Ichimoku to GBPUSD would have us focusing on taking a short short-term trade as long as two things are in play:
-Price stays below the cloud
-Lagging line, and thus momentum, also stays below the cloud
Learn Forex: Short-Term Set-Up If GBPUSD Breaks Below 1.7100
When momentum reverses, as seen by the lagging line reversing from the cloud, you can exit the trade knowing that either a reversal is at play or a correction. If a correction is at play and you stay in the trade, you run the risk of foregoing a better opportunity by binding up your margin in a non-active trade.
Happy Trading!
---Written by Tyler Yell, Trading Instructor
More...


 Reply With Quote


Bookmarks