
 LinkBack URL
 About LinkBacks


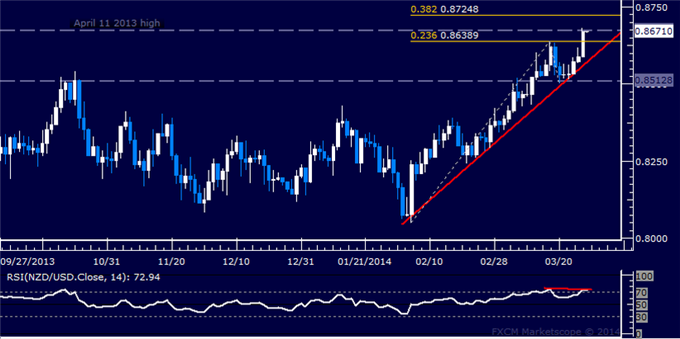
NZD/USD Minor Support Surrounds .8200
-NZDUSD has responded to a trendline confluence. The trendlines in question extend off of the October and January highs and August and November lows. The reaction is consistent with an important market turn.
-.8238 and .8187 are possible reaction areas.
LEVELS: .8136 .8187 .8237 | .8310 .8345 .8362
More...


 Reply With Quote


Bookmarks