

TechnoMeter
GBPUSD Technical Conditions Warn of a Top
by
, 07-14-2014 at 01:38 AM (1626 Views)
- EURUSD and USDCHF divergence (again)
- GBPUSD weekly RSI top warning
- USDJPY pattern becoming clearer
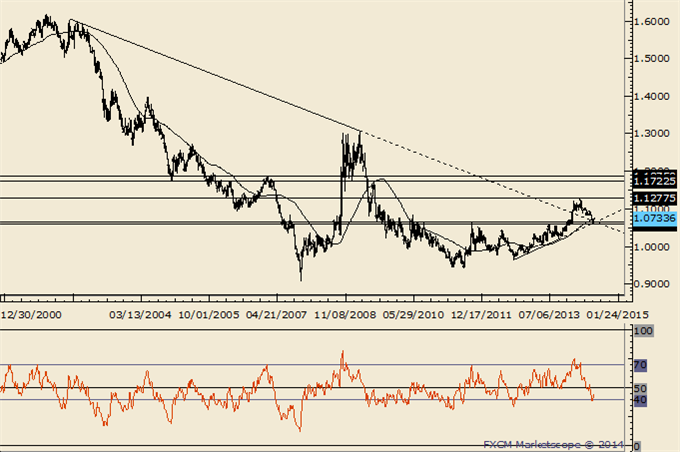
EUR/USD
Weekly
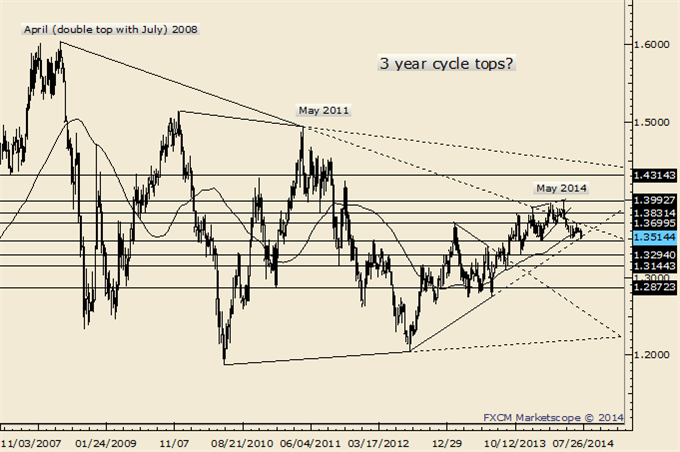
-Long term, a failed breakout and top would keep with the pattern of 3 year cycle tops. 1.3750 is an important reference point (year open).
-1.3670/85 is a level that should inspire a reaction (selling). How the market reacts at that level will help in assessing the next move. EURUSD found top at 1.3700 on July 1st and traded within pips of its February (year to date low) low today. The hullabaloo that surrounded the EURUSD test of the trendline that surrounds the last 2 Julys along with divergence with USDCHF (which did NOT exceed its June high) warns of a rip following this dip. Exceeding 1.3575 would cast doubt on the downtrend that commenced on July 1.
GBP/USD
Weekly
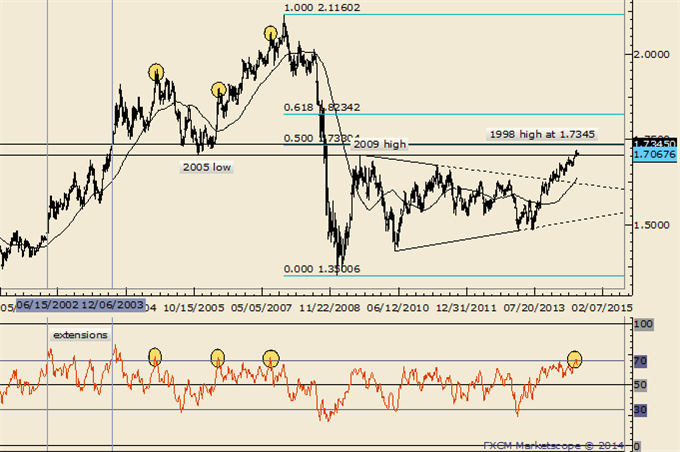
-GBPUSD recently traded at its best level since October 2008. The level is also home to the 2005 low. The next big confluence is from the 1998 high and 50% retracement of the decline from the 2007 high at 1.7330/45.
-Of note is a weekly outside reversal and weekly RSI rolling over from above 70 this week. Prior instances of RSI rolling over (2004, 2006, and 2007) from above 70 indicated tops of at least several months.
AUD/USD
Weekly
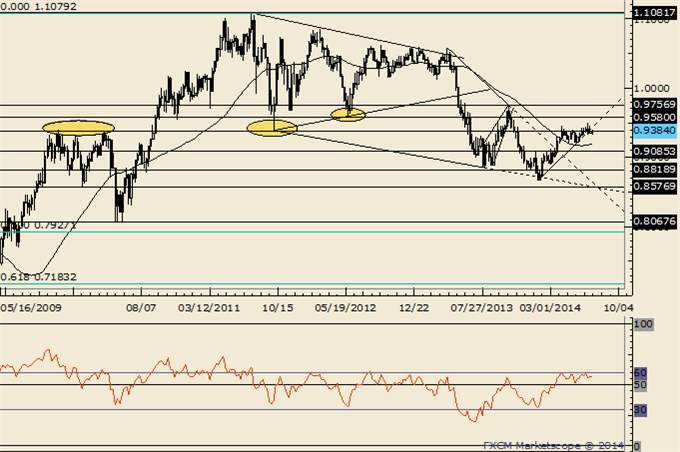
-The combination of the .9400 figure and weekly RSI failing near 60 indicates a lot of overhead to punch through. Since the 2011 top, each RSI failure near 60 has led to a top or topping process (range for several weeks then a breakdown...that may be the case now).
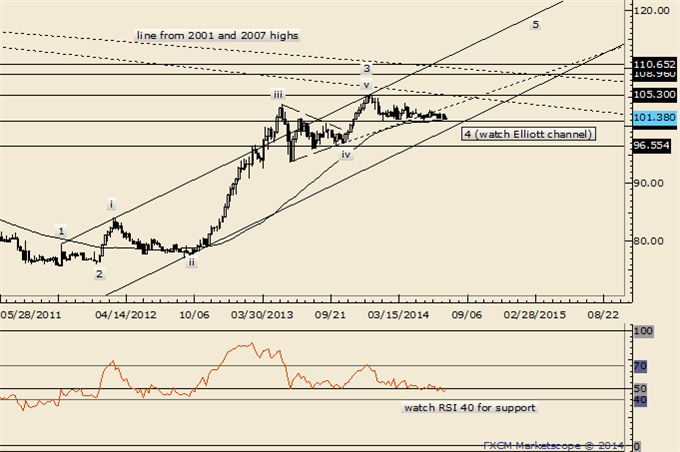
NZD/USD
Monthly
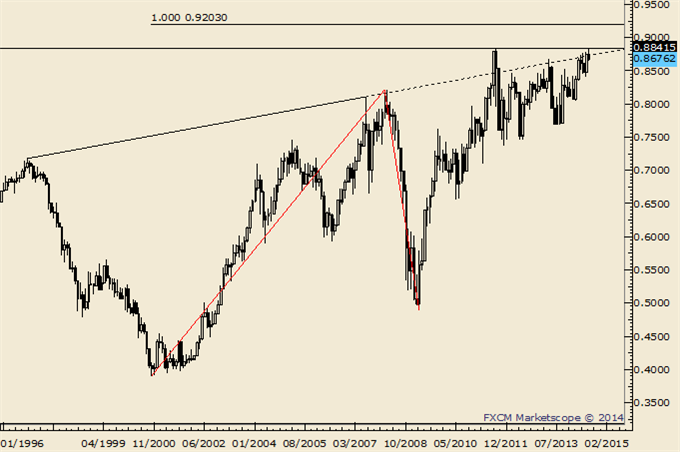
-Dont forget about the line that extends off of the 1996 and 2007 highs. That line crosses through the 2008, 2011, and highs as well. In 2011 (record free float high), the rate surged through the line in late July before topping on August 1st. The rate reversed this week from pips below the record high and above the mentioned line.
-Market conditions (volatility) are quite different that they were in 2011 but the record free float high did occur in blow-off fashion throughout July (the high was August 1st). If history were to rhyme, then know that the rally from the 2000 low would consist of 2 equal waves at .9203. Below .8400 would suggest that a long term top is in place.
USD/JPY
Weekly
-The miserable trading conditions in USDJPY are probably explained by its long term Elliott wave position. That is, the rate has been mired in a corrective 4th wave all year. The good news is that wave 4 probably ends within a month. A measured target for the end of wave 4 is 99.44 (2 equal legs from the high). This level intersects Elliott channel resistance in 3 weeks (week that ends 8/8).
USD/CAD
Weekly
-USDCAD has fallen apart which ironically means it is probably going to find some sort of low soon. The rate is nearing important price levels. The 2011 high at 1.0657 and current year open at 1.0634 are possible supports. The line that extends off of the 2012 and September 2013 lows is at about 1.0607 next week. This level is in line with the July 2013 high at 1.0608.
-USDCAD ended up finding low at 1.0620. However, failure at trendline resistance (see the daily) is reason enough to question whether or not lows are revisited once more before the larger turn higher.
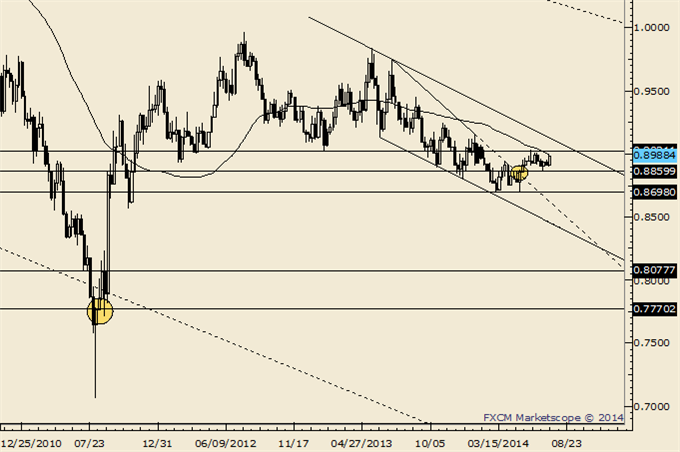
USD/CHF
Weekly
-USDCHF ended up finding low at the close of the weekly low (week that ended 5/9 the close was .8860) 2 weeks ago. As written in the EURUSD section, the risk is lower in the USD given the divergence between USDCHF and EURUSD (USDCHF stayed below its June high while EURUSD dropped below its June low).
More...


Updated 07-19-2014 at 09:40 AM by TechnoMeter
Tags:
fundamentals,
majors,
technicals,
weekly

- Categories
- Uncategorized
 Email Blog Entry
