

TechnoMeter
Price Pattern Technicals for Majors
by
, 11-17-2014 at 10:45 AM (1470 Views)
- EURUSD and USDCHF fail to confirm USDOLLAR move
- USDJPY at upper median line parallel
- AUDUSD follows through on last Fridays reversal
EUR/USD
Weekly
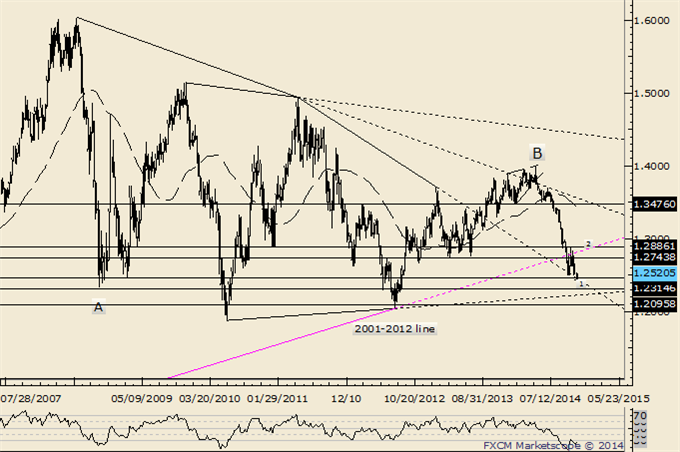
-BIG picture, monthly RSI has broken out of a triangle pattern. Sometimes, a pattern breakout in momentum (or OBV) precedes the breakout in price. The developments implications are obviously significant.
-Near term, price action since the October low likely composes a 4th wave correction within a 5 wave decline from the May high. Allow for additional sideways trading in order to complete wave 4 before a new low in wave 5 targets 1.2400 or 1.2315.
-EURUSD is at a new low and focus shifts to identifying possible reversal points for the end of wave 5. Wave 5 (from 1.2886) would equal wave (1.3993-1.3502) at 1.2395. Equality between waves 5 and 1 is a common relationship. Reversal risk is high. Fridays rally indicates follow through on the previous Friday reversal. Support is estimated at 1.2455.
GBP/USD
Weekly
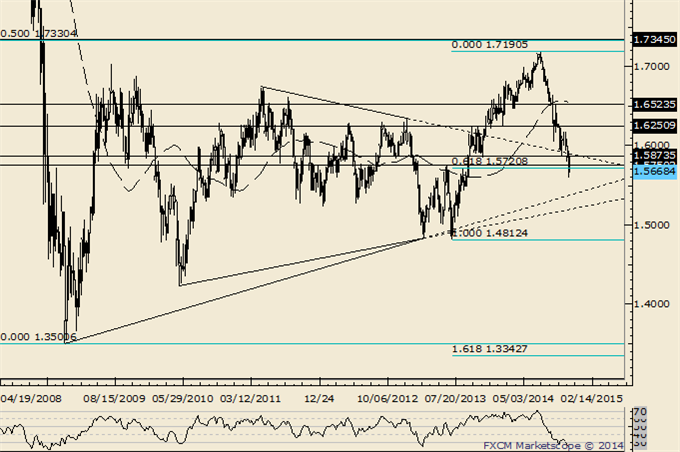
-GBPUSD is at a crossroads. The trend is down against 1.6184 but recent activity warns of a turn. The rate carved a key reversal last week and action since the low is constructive (decline from 1.6184 found low at the 61.8% of prior rally). Exceeding 1.6184 would confirm a 3 week bottoming pattern and yield an objective near 1.65.
-The rate traded 1.6181 this week before sinking to new lows. Favor the downside as long as price is below trendline resistance.
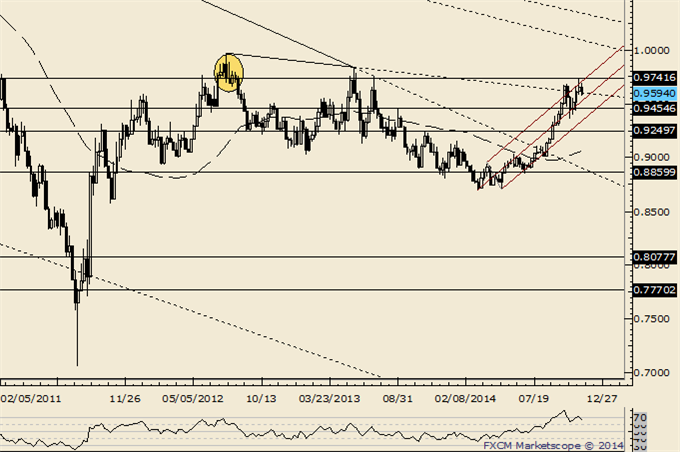
AUD/USD
Monthly
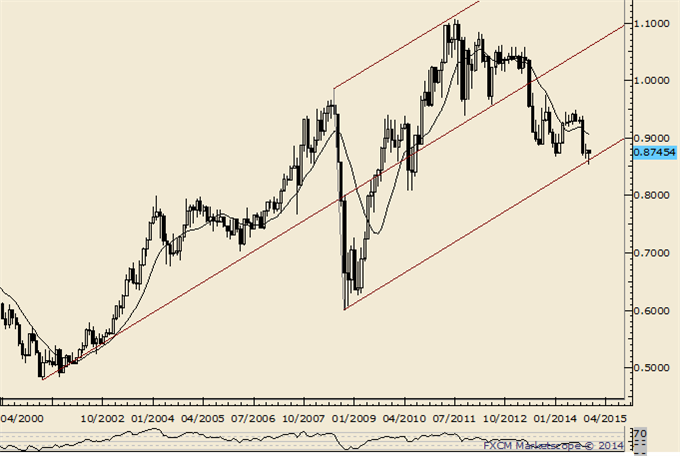
-The combination of the .9400 figure and weekly RSI failing near 60 indicates a lot of overhead to punch through. Since the 2011 top, each RSI failure near 60 has led to a top or topping process (range for several weeks then a breakdown...that may be the case now).
-Weakness has extended below the line that extends off of the 2008 and 2014 lows, warning of something much more significant on the downside. The 10/29 outside day reversal keeps me looking lower. A new low would expose expansion objectives at .8476 and .8373.
-AUDUSD made fresh lows this week but Fridays outside day reversal, at a long term median line parallel nonetheless, should not be ignored. A push above .8760 (weekly breakout bar) would lend credence to a more important reversal scenario. The market is pressing .8760 now. Support is estimated at .8630.
NZD/USD
Weekly
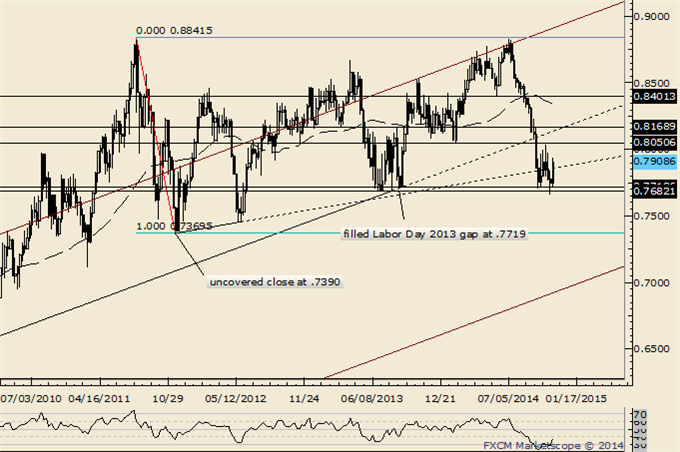
-Dont forget about the line that extends off of the 1996 and 2007 highs. That line crosses through the 2008, 2011, and highs as well. In 2011 (record free float high), the rate surged through the line in late July before topping on August 1st. The rate reversed this week from pips below the record high and above the mentioned line.
-The gap from Labor Day 2013 has held as support but last weeks spike into .8034 (just shy of the February low at .8050) probably completed 3 weeks of consolidation. In other words, start looking lower again. Ultimately, weakness below .7370 would confirm a double top with an objective of .5898.
-The Bird traded under the 2013 low last week but be aware of slowing momentum (RSI divergence + RSI > 30 on the daily) and a possible ending diagonal from the 10/21 high. The turn higher is impulsive. Watch for support at .7750.
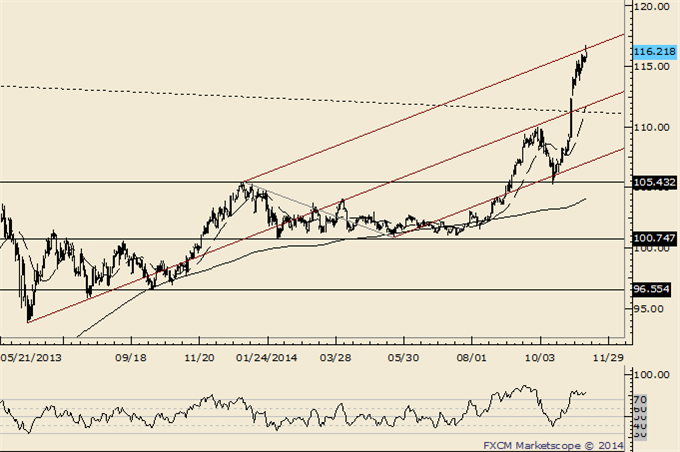
USD/JPY
Monthly
-The bull move is relentless but USDJPY traded into an upper median line parallel on Friday and pulled back (slightly). A drop below 114.87 is needed to do technical damage on the shortest term time frame and indicate that a setback is underway or topping process is unfolding.
USD/CAD
Weekly
-USDCAD traded to its best levels since July 2009 this week but finished in the middle of its range for the week. The close and weak momentum profile casts doubt regarding the validity of the breakout but continue to look higher as long as price is above 1.1080. The rate also encounters potential resistance near 1.1450 from the upward sloping line that connects the October and 2011 and March 2014 highs.
-This weeks high was 1.1465, a few ticks above the mentioned upward sloping line. Support is seen at 1.1270-1.1300 (there now) and weakness below 1.1120 is needed to break the bull trend.
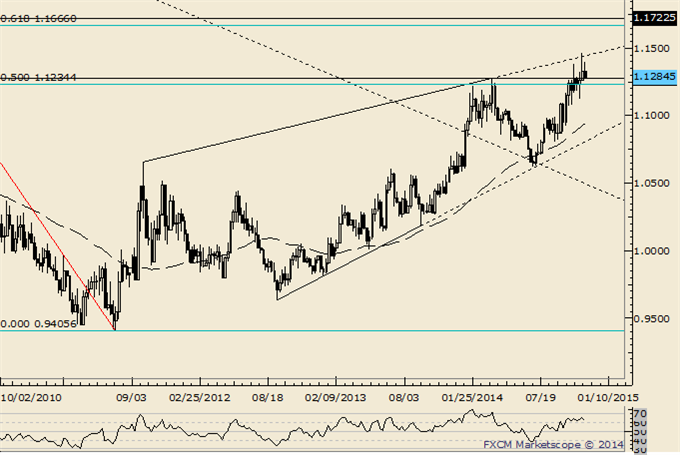
USD/CHF
Weekly
-USDCHF weakness has reset the market for another rally attempt. Remember, USDCHF broke above the trendline that extends off of the 2001 and 2010 highs. Like EURUSD, USDCHF monthly RSI broke from a potentially long term basing pattern. As long as .9358 holds, look higher.
-.9740 could serve as resistance for the next top. Last weeks high was .9740 and todays decline indicates follow through on the previous Fridays reversal. Like EURUSD, reversal risk is high.
More...


- Categories
- Uncategorized
 Email Blog Entry
