Page 41 of 147 FirstFirst ... 31 39 40 41 42 43 51 91 141 ... LastLast
Results 401 to 410 of 1461

Daily Market Analysis By FXOpen

This is a discussion on Daily Market Analysis By FXOpen within the Analytics and News forums, part of the Trading Forum category; ETHUSD and LTCUSD Technical Analysis – 28th APR, 2022 ETHUSD: Rounding Bottom Pattern Above $2,700 Ethereum was unable to sustain ...


  1. #401
    Junior Member FXOpen Trader's Avatar
    Join Date
    Dec 2020
    Location
    Asia
    Posts
    1,772
    ETHUSD and LTCUSD Technical Analysis – 28th APR, 2022


    ETHUSD: Rounding Bottom Pattern Above $2,700

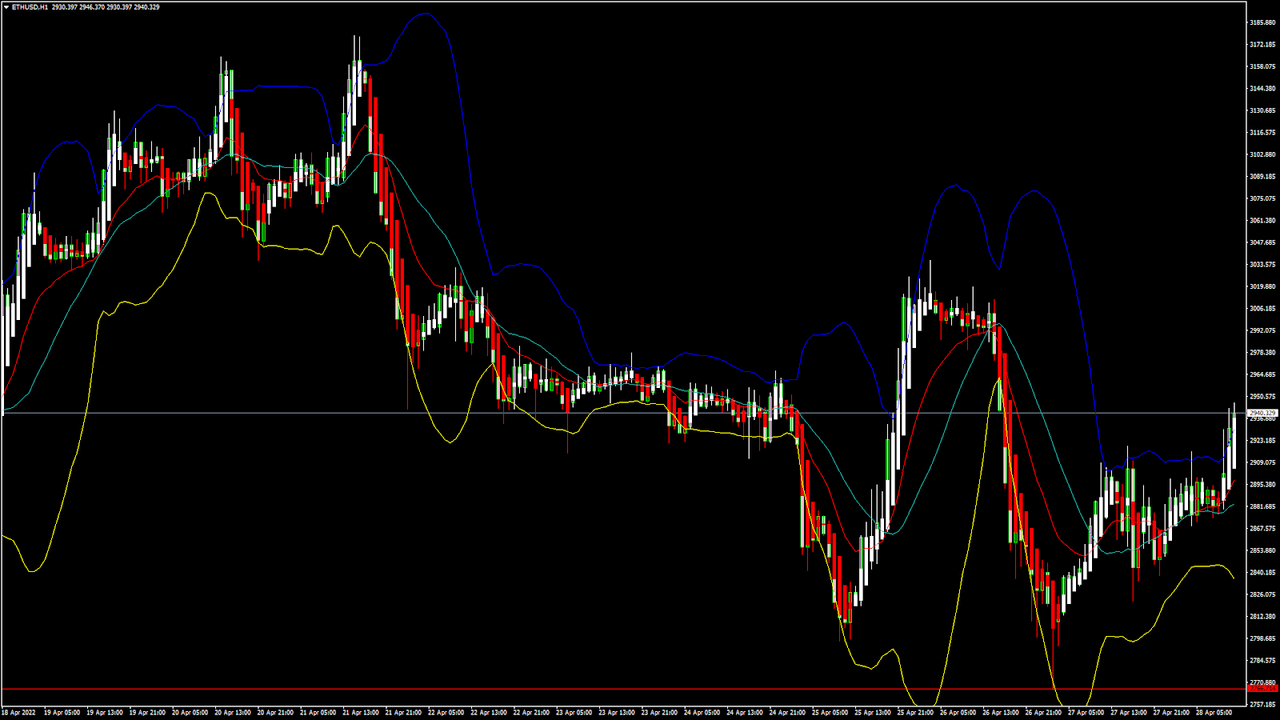
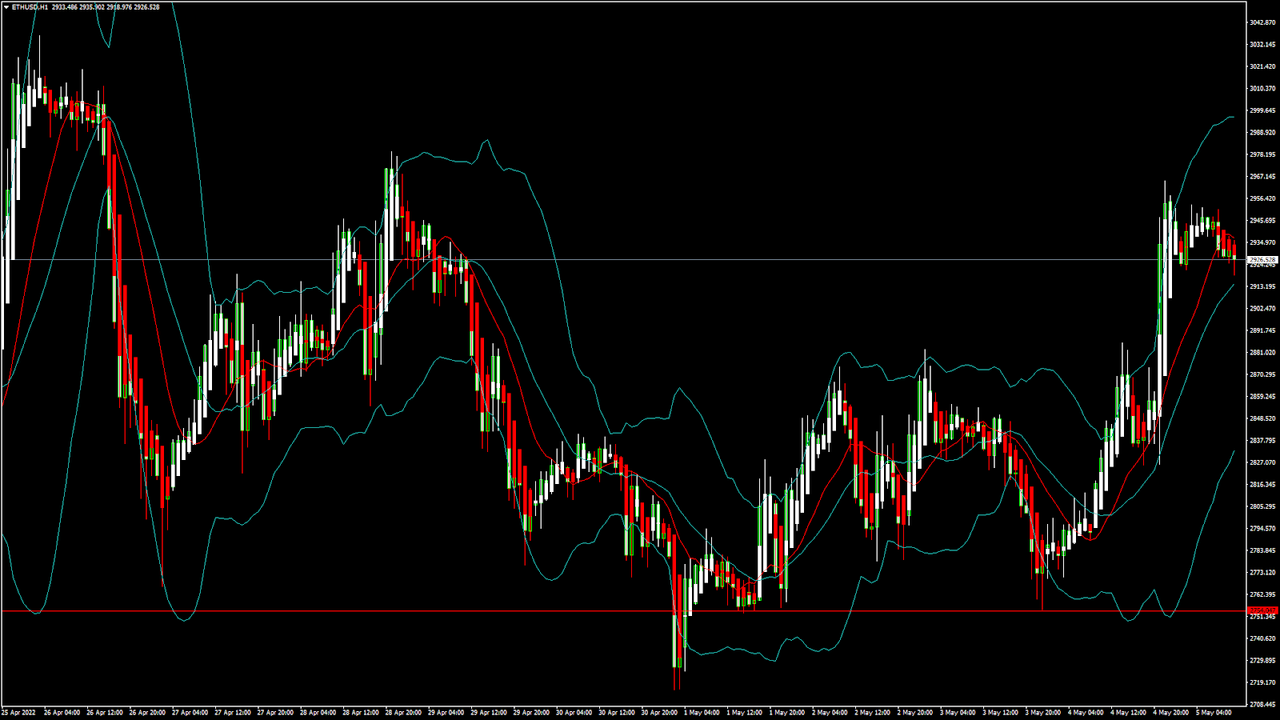
    Ethereum was unable to sustain its bullish momentum this week, and after touching a high of $3,036 on April 26th started to decline against the US dollar.

    The bearish momentum has pulled down the prices of Ethereum below the $2,800 handle touching a low of $2,766 on April 26th.

    The price has entered a consolidation channel above the $2,700 handle; we are in a mildly bullish phase in the European trading session.

    We can clearly see a rounding bottom pattern above the $2,700 handle, which is a bullish pattern signifying the end of a bearish phase and the start of a bullish phase in the markets.

    ETH is now trading just above its pivot level of $2,924 and is moving in a mildly bullish channel. The price of ETHUSD is testing its classic resistance level of $2,948 and Fibonacci resistance level of $2,966, after which the path towards $3,100 will get cleared.

    The relative strength index is at 63 indicating a STRONG demand for Ethereum and the continuation of the bullish trend.

    Both the StochRSI and Williams percent range are indicating an overbought level which means that the prices are due to decline in the short term.

    All of the technical indicators are giving a STRONG BUY market signal.

    All of the moving averages are giving a STRONG BUY signal, and we are now looking at the levels of $3,200 to $3,350 in the short-term range.

    ETH is now trading above both the 100 hourly and exponential MAs.

    • Ether: bullish reversal seen above the $2,700 mark
    • Short-term range appears to be mildly BULLISH
    • The daily RSI is below 50 at 45, indicating a NEUTRAL market
    • The average true range is indicating LESSER market volatility


    Ether: Bullish Reversal Seen Above $2,700


    ETHUSD is now moving in a mildly bullish channel, with the price trading above the $2,900 handle in the European trading session today.

    Ethereum’s demand is increasing, which is leading to a slow rise in its levels, and now we are looking at the immediate targets of $3,000 and $3,150.

    ETHUSD is now facing its immediate resistance level of $3,149 and $3,203, after which we will see a linear progression towards $3,300. The key support levels to watch are $2,869 and $2,880, and the price of ETHUSD need to remain above these levels for the continuation of the bullish trend.

    ETH has gained 1.88% with a price change of 54.35$ in the past 24hrs, and has a trading volume of 17.239 billion USD.

    We can see a decrease of 16.56% in the total trading volume in the last 24 hrs, which appears to be normal.

    The Week Ahead

    We can see the formation of a bearish harami pattern in the 15-minute timeframe, which indicates a potential short-term reversal in its levels. This is also confirmed by the MA200 crossover pattern located at $2,964 and $2,943.

    The transaction fees of Ethereum continue to decline by more than 90% in a period of 6 months. At present, the average transaction fee is about $5.80.

    The on-chain metrics are also indicating a bullish scenario for Ethereum in the medium-term range with a projection level of $3,800 to $4,000.

    The immediate short-term outlook for Ether has turned mildly BULLISH; the medium-term outlook has turned neutral; the long-term outlook for Ether is NEUTRAL in present market conditions.

    This week, Ether is expected to move in a range between $3,000 and $3,200, and next week, Ether is expected to enter a consolidation phase above the level of $3,200.

    Technical Indicators:

    Stoch (9,6): at 51.80 indicating a NEUTRAL level

    The moving averages convergence divergence (12,26): at 9.17 indicating a BUY

    The ultimate oscillator: at 56.21 indicating a BUY

    Bull/ Bear power (13-day): at 78.86 indicating a BUY


    Read Full on FXOpen Company Blog...

  2. #402
    Junior Member FXOpen Trader's Avatar
    Join Date
    Dec 2020
    Location
    Asia
    Posts
    1,772
    Gold Price And Crude Oil Price Hold Key Support


    Gold price is trading above a major support near $1,850. Similarly, crude oil price must stay above $94.30 to remain in a positive zone.

    Important Takeaways for Gold and Oil

    • Gold price started a downside correction from the $2,070 high against the US Dollar.
    • There is a major bullish trend line forming with support near $1,830 on the daily chart of gold.
    • Crude oil price also started a downside correction from the $126.37 high.
    • There is a key bullish trend line forming with support near $97.00 on the daily chart of XTI/USD.


    Gold Price Technical Analysis

    This past month, gold price started a strong increase from the $1,780 support zone against the US Dollar. There was a clear break above the $1,800 and $1,900 resistance levels.

    The price accelerated its gains above the $2,000 level and settled well above the 50-day simple moving average. It traded to a new multi-year high at $2,070 on FXOpen. Recently, it started a downside correction below the $2,000 level.

    Gold Price Daily Chart


    There was a break below the 50% Fib retracement level of the upward move from the $1,780 low to $2,070 high. It even traded below $1,925 and the 50-day simple moving average.

    An initial support on the downside is near the $1,872 level. The main support is near the $1,850 level and the 76.4% Fib retracement level of the upward move from the $1,780 low to $2,070 high. There is also a major bullish trend line forming with support near $1,830 on the daily chart of gold.

    Any further losses may perhaps open the doors for a larger decline towards the $1,800 and $1,780 levels in the near term. On the upside, an initial resistance is near the $1,925 level.

    The first major resistance is near the $1,935 level. A clear break above the $1,935 barrier might call for a move towards $2,000.


    Read Full on FXOpen Company Blog...

  3. #403
    Junior Member FXOpen Trader's Avatar
    Join Date
    Dec 2020
    Location
    Asia
    Posts
    1,772
    GBP/USD Struggle Continues, GBP/JPY Eyes More Gains


    GBP/USD started another decline from well above the 1.2900 level. GBP/JPY is rising and might gain pace above the 164.20 resistance zone.

    Important Takeaways for GBP/USD and GBP/JPY

    • The British Pound started a fresh decline after it failed near 1.2950 against the US Dollar.
    • Recently, there was a break above a key bearish trend line with resistance near 1.2500 on the hourly chart of GBP/USD.
    • GBP/JPY started a fresh increase after it formed a base above the 159.50 level.
    • There is a major bullish trend line forming with support near 163.25 on the hourly chart.


    GBP/USD Technical Analysis

    This past week, the British Pound started a major decline from the 1.3090 zone against the US Dollar. The GBP/USD pair broke the 1.3000 support zone to enter a bearish zone.

    There was a clear move below the 1.2900 support and the 50 hourly simple moving average. It even traded below the 1.2750 and 1.2620 support levels. Finally, there was a move below the 1.2450 level and the pair traded as low as 1.2411 on FXOpen.

    GBP/USD Hourly Chart


    It is currently attempting an upside correction above 1.2500. There was a move above the 23.6% Fib retracement level of the key decline from the 1.3090 swing high to 1.2411 low.

    There was also a break above a key bearish trend line with resistance near 1.2500 on the hourly chart of GBP/USD. However, the pair is facing a major resistance near the 1.3600 and 1.3620 levels. The next major hurdle is near the 1.2750 level.

    The 50% Fib retracement level of the key decline from the 1.3090 swing high to 1.2411 low is also near the 1.2750 level. If there is no upside break above 1.2620, the pair could start a fresh decline.

    An immediate support is near the 1.2525 level and the 50 hourly simple moving average. The next major support is near the 1.2500 level. If there is a break below the 1.2500 support, the pair could test the 1.2420 support.


    Read Full on FXOpen Company Blog...

  4. #404
    Junior Member FXOpen Trader's Avatar
    Join Date
    Dec 2020
    Location
    Asia
    Posts
    1,772
    EUR/USD and EUR/JPY Could Extend Downsides


    EUR/USD started a fresh decline from the 1.0750 resistance. EUR/JPY could extend downsides if there is a move below the 136.50 support.

    Important Takeaways for EUR/USD and EUR/JPY

    • The Euro failed to clear the 1.0750 resistance and started a fresh decline.
    • There is a key bullish trend line forming with support near 1.0500 on the hourly chart.
    • EUR/JPY started a downside correction from the 138.00 resistance zone.
    • A major bearish trend line is forming with resistance near 137.20 on the hourly chart.


    EUR/USD Technical Analysis

    The Euro made a couple of attempts to clear the 1.0750 resistance zone against the US Dollar. However, the EUR/USD pair failed to gain strength above 1.0750 and started a fresh decline.

    The pair declined below the 1.0600 support and the 50 hourly simple moving average. The pair even moved below the 1.0550 support level. A low was formed near 1.0470 on FXOpen before the pair started a short-term upside correction.

    EUR/USD Hourly Chart


    There was a move above the 1.0520 resistance level. It corrected above the 23.6% Fib retracement level of the key drop from the 1.0758 high to 1.0470 low.

    On the upside, the pair is facing resistance near the 1.0580 level. It is near the 38.2% Fib retracement level of the key drop from the 1.0758 high to 1.0470 low. The next major resistance is near the 1.0620 level.

    A clear break above the 1.0620 resistance could push EUR/USD towards 1.0700. If the bulls remain in action, the pair could revisit the 1.0750 resistance zone in the near term.

    On the downside, the pair might find support near the 1.0500 level. There is also a key bullish trend line forming with support near 1.0500 on the hourly chart. If there is a downside break below the 1.0500 support, the pair might accelerate lower. The next major support sits near the 1.0470 level, below which there is a risk of a larger decline.


    Read Full on FXOpen Company Blog...

  5. #405
    Junior Member FXOpen Trader's Avatar
    Join Date
    Dec 2020
    Location
    Asia
    Posts
    1,772
    ETHUSD and LTCUSD Technical Analysis – 05th MAY, 2022


    ETHUSD: Bullish Engulfing Pattern above $2,750

    Ethereum was moving in a bearish phase last week and touched a low of 2,725 on May 1st, after which it entered into a consolidation channel above the $2,750 handle.

    This week, ETHUSD started moving in a bullish channel, and managed to cross the $2,900 handle in the European trading session today.

    We can clearly see a bullish engulfing pattern above $2,750 which signifies the end of a bearish trend and the start of a bullish trend.

    We can see that the price of Ethereum has retracted from its highs due to some profit taking, but the bullish channel continues, and we are aiming for the upsides of $3,100 and $3,300 this week.

    ETH is now trading just below its pivot level of 2,936 and moving in a mild bullish momentum. The price of ETHUSD is now facing its classic resistance level of 2,944, Fibonacci resistance level of 2,960, and is now aiming towards the $3,000 handle in the US trading session.

    Most of the moving averages are giving a BUY signal.

    ETH is now trading below both its 100 hourly and 200 hourly simple MAs.

    • Ethereum is in a mildly bullish channel
    • Short-term trend reversal seen above $2,750
    • All the major technical indicators are giving a NEUTRAL to BUY signal
    • The average true range is indicating LESSER market volatility


    Ether: Bullish Channel Above $2900 Confirmed


    ETHUSD has consolidated its gains above $2,900 in the European trading session, and we can clearly see that the bullish channel is back.

    We are now aiming for the upsides of $3,000 to $3,100 in today’s US trading session. The retracement from $2,721 was very strong which suggests that there is more room for the upsides in Ethereum this month, and a level of $3,500 is the next target.

    We can see the MA crossover pattern above the level of 2,850 which means that in the immediate short term we will see the continuation of the bullish channel.

    ETH has gained 2.86% with a price change of 81.25$ in the past 24hrs, and has a trading volume of 17.890 billion USD.

    We can see an increase of 36% in the trading volume as compared to yesterday which means that new buyers are entering the markets and waiting for further correction in the levels of Ethereum.

    The Week Ahead

    Ether is printing above $2,980 today, and we can see levels of $3,000 to $3,200 this week.

    The medium-to-long term outlook for Ether remains bullish with targets of above 3,500 in May.

    With the US Federal Reserve increasing its benchmark interest rate by half a percentage point, the price of Ethereum continues rising along with other top cryptocurrencies.

    Ether has already broken its major resistance level of $2,800 and is now facing the next resistance level of $3,000.

    Technical Indicators:

    The commodity channel index (14-day): at 135.24 indicating a BUY

    The moving averages convergence divergence (14-day): at 14.80 indicating a BUY

    The ultimate oscillator: at 61.44 indicating a BUY

    The rate of price change: at 3.39 indicating a BUY


    Read Full on FXOpen Company Blog...

  6. #406
    Junior Member FXOpen Trader's Avatar
    Join Date
    Dec 2020
    Location
    Asia
    Posts
    1,772
    AUD/USD and NZD/USD Might Struggle To Recover Losses


    AUD/USD gained bearish momentum below the 0.7150 support zone. NZD/USD started a major decline after it faced sellers near 0.6565.

    Important Takeaways for AUD/USD and NZD/USD

    • The Aussie Dollar started a fresh decline after it struggled near 0.7265 against the US Dollar.
    • There was a break below a major bullish trend line with support near 0.7160 on the hourly chart of AUD/USD.
    • NZD/USD also started a major decline after it failed to stay above 0.6550.
    • There was a move below a key bullish trend line with support near 0.6445 on the hourly chart of NZD/USD.


    AUD/USD Technical Analysis

    The Aussie Dollar faced a strong selling interest near the 0.7265 level against the US Dollar. The AUD/USD pair started a major decline below the 0.7200 level.

    There was a clear move below the 0.7160 and 0.7150 support levels. Besides, there was a break below a major bullish trend line with support near 0.7160 on the hourly chart of AUD/USD. The pair declined below the 50% Fib retracement level of the upward move from the 0.7030 swing low to 0.7265 high (formed on FXOpen).

    AUD/USD Hourly Chart


    The pair even declined below the 0.7120 support level and the 50 hourly simple moving average. Finally, it tested the 76.4% Fib retracement level of the upward move from the 0.7030 swing low to 0.7265 high.

    On the upside, the AUD/USD pair is facing resistance near the 0.7120 level. The next major resistance is near the 0.7150 level. A close above the 0.7150 level and the 50 hourly simple moving average could start a steady increase in the near term.

    The next major resistance could be 0.7200. On the downside, an initial support is near the 0.7085 level. The next support could be the 0.7050 level.

    If there is a downside break below the 0.7050 support, the pair could extend its decline towards the 0.7000 level. Any more downsides might send the pair toward the 0.6920 level.


    Read Full on FXOpen Company Blog...

  7. #407
    Junior Member FXOpen Trader's Avatar
    Join Date
    Dec 2020
    Location
    Asia
    Posts
    1,772
    GBP/USD and EUR/GBP: British Pound Remains In Downtrend


    GBP/USD started a fresh decline from well above the 1.2650 level. EUR/GBP is rising and might attempt an upside break above the 0.8600 resistance zone.

    Important Takeaways for GBP/USD and EUR/GBP

    • The British Pound started a fresh decline from well above 1.2650 against the US Dollar.
    • There is a key bearish trend line forming with resistance near 1.2335 on the hourly chart of GBP/USD.
    • EUR/GBP formed a base above 0.8350 and started a fresh increase.
    • There is a major bullish trend line forming with support near 0.8535 on the hourly chart.


    GBP/USD Technical Analysis

    The British Pound struggled to settle above the 1.2620 resistance zone against the US Dollar. The GBP/USD pair started a fresh decline below the 1.2550 support zone.

    There was a clear move below the 1.2500 level and the 50 hourly simple moving average. The bears pushed the pair below the 1.2400 level and a new multi-week low was formed near 1.2278 on FXOpen.

    GBP/USD Hourly Chart


    The pair is now consolidating losses above the 1.2280 level. On the upside, an initial resistance is near the 1.2335 level. There is also a key bearish trend line forming with resistance near 1.2335 on the hourly chart of GBP/USD.

    The next main resistance is near the 1.2400 zone and the 50 hourly simple moving average. It is close to the 23.6% Fib retracement level of the key decline from the 1.2637 swing high to 1.2278 low.

    The main resistance is now forming near the 1.2450 level. It is close to the 50% Fib retracement level of the key decline from the 1.2637 swing high to 1.2278 low. A clear upside break above the 1.2450 and 1.2460 resistance levels could open the doors for a steady increase in the near term.

    If not, the pair might continue to move down below 1.2280. The next major support is near the 1.2220 level. Any more losses could lead the pair towards the 1.2150 support zone or even 1.2120.


    Read Full on FXOpen Company Blog...

  8. #408
    Junior Member FXOpen Trader's Avatar
    Join Date
    Dec 2020
    Location
    Asia
    Posts
    1,772
    BTCUSD and XRPUSD Technical Analysis – 10th MAY 2022


    BTCUSD: Rounding Bottom Pattern Above $29,700

    Bitcoin was not able to sustain its bullish momentum last week, and after touching a high of $40,000 on May 4th, started to decline heavily against the US dollar.

    The short-selling continued pushing the price of BTC below the $30,000 handle, after which we can observe some consolidation.

    We can see a pullback in the market at levels above $30,000, which is expected to continue towards $35,000.

    We can clearly see a rounding bottom pattern above the $29,700 handle — which is a bullish reversal pattern signifying the end of a downtrend and a shift towards an uptrend.

    The Stoch and Williams percent range are indicating an overbought level which means that in the immediate short term, a decline in the prices is expected.

    The relative strength index is at 44 indicating a WEAK demand for bitcoin at the current market level.

    Bitcoin is now moving below its 100 hourly simple and 200 hourly exponential MAs.

    Some of the major technical indicators are giving a BUYsSignal, which means that in the immediate short term, we are expecting targets of $32,000 and $34,000.

    The average true range is indicating LESSER market volatility with a mildly bullish momentum.

    • Bitcoin: bullish reversal seen above $29,700
    • The StochRSI is indicating an OVERBOUGHT level
    • The price is now trading just below its pivot level of $31,810
    • Some of the moving averages are giving a BUY market signal


    Bitcoin: Bullish Reversal Seen Above $29,700


    Bitcoin has moved out of the falling trend seen last week and now continues to consolidate its gains above the $30,000 handle in the European trading session. The bounce that we have seen above $30,000 is expected to continue this week, and we are now looking at targets of $32,000 and $35,000 in the medium-term range.

    The immediate short-term outlook for bitcoin is mildly bullish; the medium-term outlook has turned neutral; the long-term outlook remains neutral under present market conditions.

    We are now looking at possible reversal and short selling at 32,946 and 34,350 as indicated by the MA50 and MA100 crossover patterns. This is further validated by an overbought level seen in the Stoch and Williams percent range.

    The price of BTCUSD is now facing its classic resistance level of $32,009, Fibonacci resistance level of $32,240 after which the path towards $34,000 will get cleared.

    In the last 24hrs, BTCUSD has declined by -5.59% with a price change of 1872$, and has a 24hr trading volume of USD 81.634 billion. We can see an increase of 111% in the trading volume as compared to yesterday, which is due to the heavy selling seen across global cryptocurrency markets.

    The Week Ahead

    The price of bitcoin touched an intraday low of $29,829 in the Asian trading session, and an intraday high of $32561 in today’s European trading session.

    The daily RSI is printing at 30 which means that the medium range demand continues to be weak. This is also an opportunity for long-term investors to enter into the markets at lower levels.

    The current market condition is suitable for entering into a BUY position with targets of $33,000 and $35,000 next week.

    The price of BTCUSD will need to remain above the important support level of $30,000 this week.

    The weekly outlook is projected at $33,000 with a consolidation zone of $32,500.

    Bitcoin Down by 50%

    The price of bitcoin touched an all-time high of $67,566 in November, 2021, and with the current market price of $31,570 marks a drop of 50% in its value.

    The ongoing global economic crisis, rise in the interest rates, the Russia-Ukraine war and its effects on the global investor sentiments are driving bitcoin to historic lows, which has led to a decline in the total market capitalization of bitcoin to $600 billion USD.

    Technical Indicators

    The StochRSI (14-day): at 74.78 indicating a BUY

    The average directional change(14-day): at 28.58 indicating a NEUTRAL level

    The rate of price change: at 1.349 indicating a BUY

    The moving averages 20: indicating a BUY


    Read Full on FXOpen Company Blog...

  9. #409
    Junior Member FXOpen Trader's Avatar
    Join Date
    Dec 2020
    Location
    Asia
    Posts
    1,772
    EUR/USD Remains At Risk, USD/JPY Might Correct Gains


    EUR/USD is attempting an upside correction and facing resistance near 1.0550. USD/JPY might correct lower if it trades below 130.00.

    Important Takeaways for EUR/USD and USD/JPY

    • The Euro started an upside correction from the 1.0500 zone.
    • There is a key bearish trend line forming with resistance near 1.0560 on the hourly chart of EUR/USD.
    • USD/JPY extended rally above 130.00 and traded to a new multi-year high.
    • There is a major bullish trend line forming with support near 130.00 on the hourly chart.


    EUR/USD Technical Analysis

    This past week, the Euro started saw bearish moves below the 1.0650 level against the US Dollar. The EUR/USD pair declined heavily below the 1.0550 support zone.

    The pair even broke the 1.0500 level and settled below the 50 hourly simple moving average. A low was formed near 1.0482 on FXOpen and the pair is now correcting higher. There was a move above the 1.0550 resistance level.

    EUR/USD Hourly Chart


    However, the pair failed to gain pace above the 1.0600 level. It is now moving lower and trading below 1.0550. There was a break below the 50% Fib retracement level of the recent increase from the 1.0495 swing low to 1.0592 high.

    It is now consolidating near the 61.8% Fib retracement level of the recent increase from the 1.0495 swing low to 1.0592 high. An immediate resistance on the upside is near the 1.0542 level. The next major resistance is near the 1.0560 level.

    There is also a key bearish trend line forming with resistance near 1.0560 on the hourly chart of EUR/USD. The main resistance is near the 1.0600 level. An upside break above 1.0600 could set the pace for a steady increase.

    If not, the pair might drop and test the 1.0500 support. The next major support is near 1.0480, below which the pair could drop to 1.0420 in the near term.

    Read Full on FXOpen Company Blog...

  10. #410
    Junior Member FXOpen Trader's Avatar
    Join Date
    Dec 2020
    Location
    Asia
    Posts
    1,772
    Cryptocurrencies Under Pressure as Bitcoin’s Slide Continues


    Bitcoin is the most important cryptocurrency, and its price fluctuations influence the entire cryptocurrency market. When the price of bitcoin advances or declines, all other coins do the same.

    In other words, the thousands of other coins literally depend on what bitcoin does.

    So far this year, bitcoin has been under pressure: it opened the year around $50,000, and now threatens to drop through the $30,000 level. Only this time around, the decline in bitcoin’s price is more relevant than in the past. Nowadays, bitcoin has been adopted by market players other than retail traders.

    For years, retail traders and believers in the cryptocurrency space have hoped that institutional investors would adopt bitcoin. They have, but with increased adoption came increased risks. For example, now that bitcoin is part of numerous portfolios, it acts like the general market does. As such, the dollar’s strength in 2022 is seen in the price of bitcoin too.


    Head-and-Shoulders Pattern Points To $20,000

    One of the most powerful reversal patterns is called “head-and-shoulders”. It is formed by two shoulders and one head, resembling the human body, and it has a measured move, calculated by measuring the distance from the highest point in the pattern to the neckline, and projecting it to the downside. This is the minimum distance that the market needs to travel in order to confirm the reversal.

    In bitcoin’s case, the measured move points to a decline towards $20,000. Such a move alone is enough to put further pressure on bitcoin hodlers, but also on the financial system.

    Last week, MicroStrategy, a US-based publicly listed company that had invested heavily in bitcoin, revealed that it would receive a margin call should the price of bitcoin drop to $21,000.

    To buy its bitcoins, the company borrowed money, and now it needs to serve $2.5 billion in debt with $500 million in revenues. As such, a decline in the price of bitcoin is not a risk only for retail hodlers, but also for other financial market participants.

    To sum up, the price of bitcoin remains bearish while trading below the head-and-shoulders’ neckline. With every day that passes, the pressure mounts, and retail hodlers may be forced to liquidate just as big players are too.

    It would also be interesting to see what other big investors, such as Tesla, would do with their bitcoin holdings when the price declines below their buying price. A move below $30,000 would put pressure on Tesla, and when and if big investors flee, it might be the end of the cryptocurrency market as we know it.

    FXOpen Blog

Page 41 of 147 FirstFirst ... 31 39 40 41 42 43 51 91 141 ... LastLast

Bookmarks

Posting Permissions

  • You may not post new threads
  • You may not post replies
  • You may not post attachments
  • You may not edit your posts
  •