Page 132 of 164 FirstFirst ... 32 82 122 130 131 132 133 134 142 ... LastLast
Results 1,311 to 1,320 of 1633

Wave Analysis by InstaForex

This is a discussion on Wave Analysis by InstaForex within the Analytics and News forums, part of the Trading Forum category; Forex Analysis & Reviews: Forecast for EUR/USD on November 18, 2022 Despite the euro's strong desire to go down yesterday, ...


  1. #1311
    Senior Member InstaForex Gertrude's Avatar
    Join Date
    Sep 2015
    Posts
    1,885
    Forex Analysis & Reviews: Forecast for EUR/USD on November 18, 2022

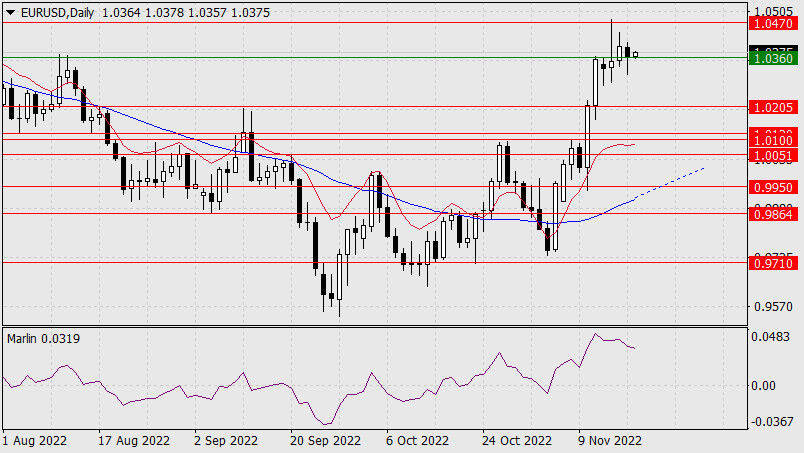
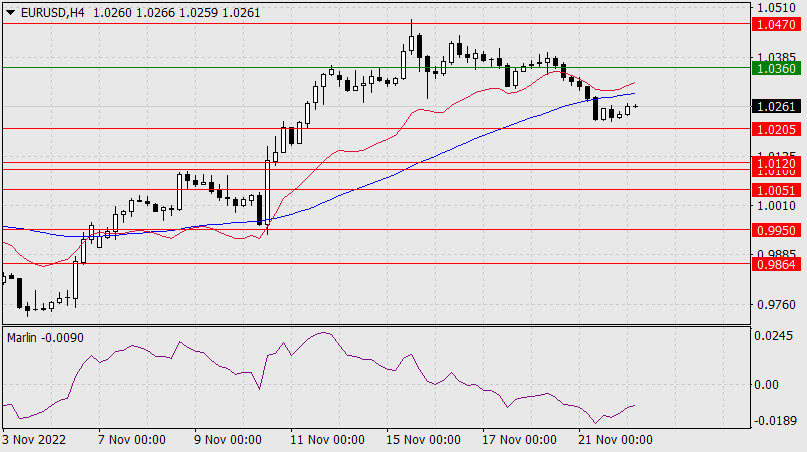
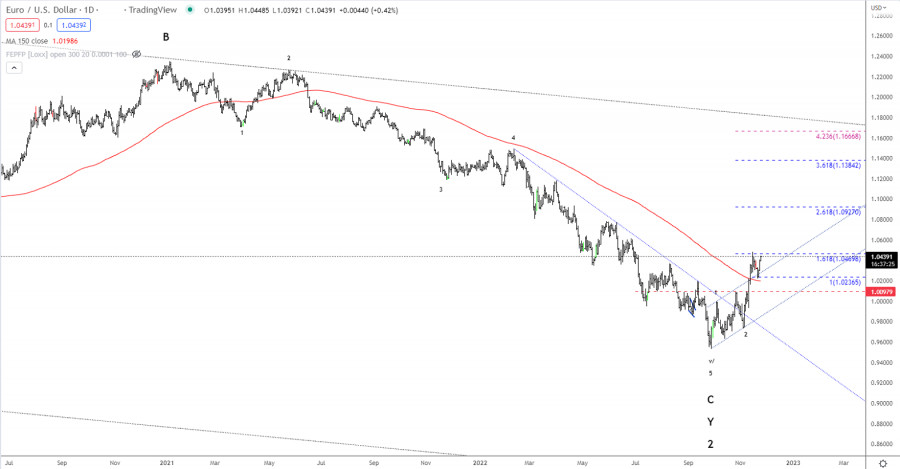
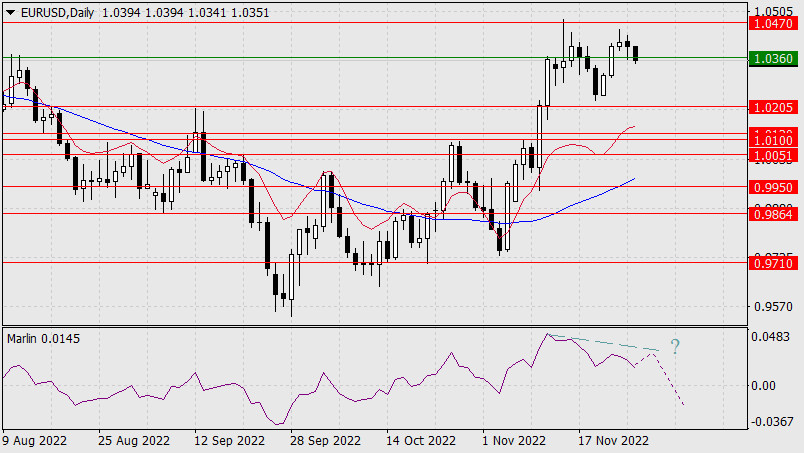
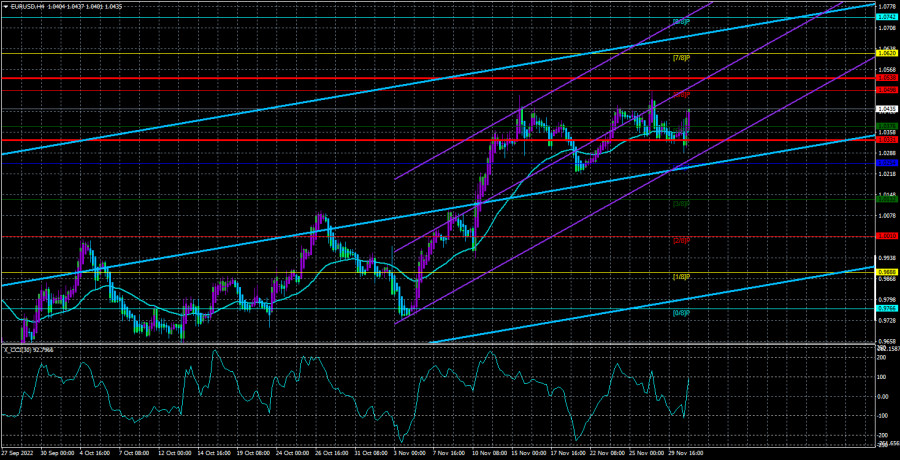
    Despite the euro's strong desire to go down yesterday, it was not possible to overcome the support of 1.0360, the day closed higher. This morning the price is at the level, waiting for external incentives for further action. Yesterday, such incentives were the fall of oil by 3.76% and the decline of gold by 0.79%.


    The daily Marlin Oscillator is declining smoothly, while there are no signs that the price may abandon attempts to break through 1.0360. If this happens, the 1.0205 target will become available.


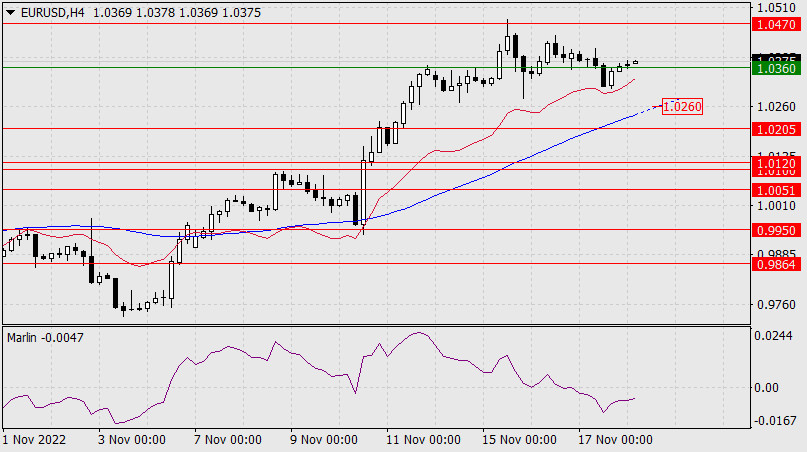
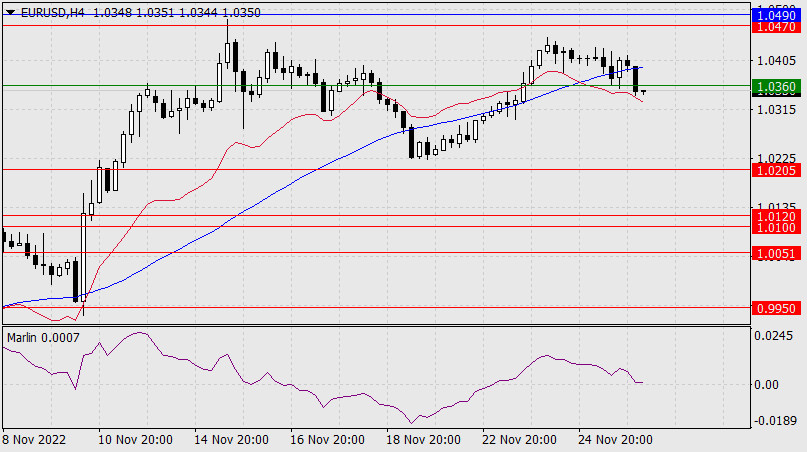
    On the four-hour chart, the price is supported by the indicator balance line (red moving line), but, nevertheless, the Marlin Oscillator has been in the negative area for a long time, so the price is unlikely to stop trying to overcome the supports. On the way to 1.0205, there is a MACD line (1.0260). It is also an important support to overcome. If the attempt is still unsuccessful, then the price may return to 1.0470 or even overcome the high on November 15 to form a divergence.

    *The market analysis posted here is meant to increase your awareness, but not to give instructions to make a trade.

    Analysis are provided by InstaForex.

    Read More
    Best regards, PR Manager
    Learn more about InstaForex Company at http://instaforex.com

  2. #1312
    Senior Member InstaForex Gertrude's Avatar
    Join Date
    Sep 2015
    Posts
    1,885
    Forex Analysis & Reviews: Technical Analysis of Intraday Price Movements of the EUR/GBP Cross Currency Pair November 21, 2022


    On the 4 hour chart EUR/GBP cross Currency pair seems to appear.

    1. Deviations between price movements with the CCI indicator.
    2. Ascending Broadening Wedge.
    3. Bearish Wolve Waves

    Based on the three information above it can be confirmed that in the near future EUR/GBP will try to get down below the level 0,8689 where if this level successfully penetrated will potentially bring EUR/GBP down to ETA Line from Wolve Waves and/or to the level 0,8589 as a target that will aim for with a note that if on his way to these levels there is no upward correction movement that penetrates above the 0.8775 level because if this level is successfully broken above, it is very likely that the scenario described previously will potentially become invalid.

    *The market analysis posted here is meant to increase your awareness, but not to give instructions to make a trade.

    Analysis are provided by InstaForex.

    Read More
    Best regards, PR Manager
    Learn more about InstaForex Company at http://instaforex.com

  3. #1313
    Senior Member InstaForex Gertrude's Avatar
    Join Date
    Sep 2015
    Posts
    1,885
    Forex Analysis & Reviews: Technical Analysis of Intraday Price Movements of the EUR/GBP Cross Currency Pair November 21, 2022

    Yesterday, China reported a sharp rise in Covid cases in Beijing, and the return of social restrictions and isolation in several areas in the country. Oil rebounds and stock indices started to decline on risks regarding the collapse of new (after FTX) cryptocurrency platforms (Genesis). Against this backdrop, the euro fell in price by 0.80%.


    This morning, the euro is approaching support at 1.0205. The price may correct just a bit, as the Marlin oscillator has a margin to the zero line on the daily chart - up to the limit of the declining territory, and may try to turn up without leaving this area. The bears' success, however, would open the 1.0100/20 target range. The price has settled under the MACD indicator line on the four-hour chart. The Marlin oscillator is in negative territory, in the area where the direction is downward.

    These circumstances increase the probability of the attempt to overcome 1.0205. The immediate objective is to settle under 1.0205. Support is technically strong, preliminary price consolidation is likely.


    *The market analysis posted here is meant to increase your awareness, but not to give instructions to make a trade.

    Analysis are provided by InstaForex.

    Read More
    Best regards, PR Manager
    Learn more about InstaForex Company at http://instaforex.com

  4. #1314
    Senior Member InstaForex Gertrude's Avatar
    Join Date
    Sep 2015
    Posts
    1,885
    Forex Analysis & Reviews: Technical Analysis of Intraday Price Movements of Commodity Currency Pairs, NZD/USD Wednesday, November 23, 2022


    On the 4 hour chart kiwi shows that hidden deviations appear between price movements and the CCI indicator which confirms if in the near future NZD/USD will have the potential to rally upwards to the nearest liquidity gathering place, namely in the Equal High area, namely at the level of 0.6201 but if the CCI level drops below the level 0 and/or level 0.6962 is exceeded, it is very likely for the scenario described earlier cancel by itself.

    *The market analysis posted here is meant to increase your awareness, but not to give instructions to make a trade.

    Analysis are provided by InstaForex.

    Read More
    Best regards, PR Manager
    Learn more about InstaForex Company at http://instaforex.com

  5. #1315
    Senior Member InstaForex Gertrude's Avatar
    Join Date
    Sep 2015
    Posts
    1,885
    Forex Analysis & Reviews: Elliott wave analysis of EUR/USD for November 24, 2022


    The minor correction from 1.0482 has reached its corrective target at 1.0222 and the pair is ready to resume the underlying impulsive rally higher through resistance at 1.0482 for a rally towards 1.0784 and 1.0927 as the next upside targets.

    In the longer term, we are looking for much higher levels here as we see the major corrective decline from 1.6038 as completed at 0.9536. A new major impulsive rally that ultimately will take us back above 1.6038 is unfolding. This of course will not be in a straight line, but in the next years, the trend will be up.

    *The market analysis posted here is meant to increase your awareness, but not to give instructions to make a trade.

    Analysis are provided by InstaForex.

    Read More
    Best regards, PR Manager
    Learn more about InstaForex Company at http://instaforex.com

  6. #1316
    Senior Member InstaForex Gertrude's Avatar
    Join Date
    Sep 2015
    Posts
    1,885
    Forex Analysis & Reviews: Future interest rate reductions by the Bank of England are also possible.


    Currently, the Bank of England is a "dark horse." It is difficult to predict how much longer the British regulator will raise its rate, even though it is doing so slower than the Fed and the ECB. It decided to increase the rate by 75 basis points at the most recent meeting, a record increase over the previous 12 to 13 years and the first increase during the current tightening monetary policy cycle. Although the Bank of England rate has already increased to 3%, inflation in the UK is still rising, and there are currently no signs that it will slow down. One could anticipate at least a slight slowdown in the consumer price index with such a rate value, but keep in mind that there is a "time lag" that could take up to 3–4 months for the economy to fully adjust to the most recent (and subsequent) PEPP tightenings.

    Inflation in the UK may therefore start to slow down soon, but I believe it will only be able to disappear at a 3% rate, even below the 10% threshold. It increased to 11.1% in October, and Andrew Bailey recently predicted that the peak value might reach 13% or 15%. The fact that British inflation has yet to display any discernible slowdown that would be considered the start of a fall is a major disadvantage. Based on this, it can be assumed that the Bank of England's relatively high rate is already impacting the economy and inflation. However, no one can say with certainty how significant this impact is. There may be an impact, but it is probably insignificant in light of the factors that drive monthly price increases. A 3% rate may only stop prices from increasing even more quickly. Since I cannot respond, it is too early to discuss the Bank of England's final interest rate.

    In light of the current situation, the regulator should increase the rate by 75 basis points at least twice more, bringing it to 4.5%. After that, he can follow the Fed's lead and raise the rate gradually while he waits for inflation to respond to three or four rounds of extremely strict PEPP tightening. However, given the current state of the British economy, analysts now have serious doubts about the Bank of England's ability to take such actions. According to Andrew Bailey, the recession "has already begun" and at the same time "has just begun" due to the most recent GDP report for the third quarter showing a contraction. It can last for up to two years (assuming no further economic shocks), and it is difficult to predict how much the British GDP will decline due to high rates.

    According to Dave Ramsden, the deputy governor of the Bank of England, it is imperative to respond to the state of the British economy. If things continue to go poorly, it will be prudent to lower the rate to prevent making the already challenging financial situation for households even worse. The objective of bringing inflation back to 2% remains the same, but the Bank of England will need to monitor economic expansion.

    The construction of a new downward trend segment is predicated on the wave pattern of the pound/dollar instrument. I cannot suggest purchasing the instrument immediately because the wave marking already permits the development of a downward trend section. Sales are more accurate now that the targets are close to the 200.0% Fibonacci level.

    Analysis are provided by InstaForex.

    Read More
    Best regards, PR Manager
    Learn more about InstaForex Company at http://instaforex.com

  7. #1317
    Senior Member InstaForex Gertrude's Avatar
    Join Date
    Sep 2015
    Posts
    1,885
    Forex Analysis & Reviews: Forecast for EUR/USD on November 28, 2022

    Last Friday, the euro touched the lower shadow of the support at 1.0360, this morning it did the same thing. The price needs to settle under this level so it can reach 1.0205, and it will form a double top on the daily chart. But the price is not in a hurry to do so. Therefore, if today closes with a white candle, then there is a high probability of a breakout of 1.0470 and a divergence may form with the Marlin oscillator.


    The situation on the weekly chart contributes to the divergence option - here we see that the MACD indicator line still hasn't been reached. But whether it will be reached or not, remains an intrigue.


    On the four-hour chart, the price crossed the MACD line on the descending Marlin oscillator. There was a similar transition on Friday, it was not reliable. Now, when the Marlin oscillator is involved, the price has a chance of settling under 1.0360. Watch the situation, for a signal for a short-term growth or a medium-term fall.

    Analysis are provided by InstaForex.

    Read More
    Best regards, PR Manager
    Learn more about InstaForex Company at http://instaforex.com

  8. #1318
    Senior Member InstaForex Gertrude's Avatar
    Join Date
    Sep 2015
    Posts
    1,885
    Forex Analysis & Reviews: ETHUSD Potential For Bearish Continuation | 29th November 2022


    Looking at the H4 chart, my overall bias for ETHUSD is bearish due to the current price being below the Ichimoku cloud, indicating a bearish market .If this bearish momentum continues, expect price to possibly head towards the 1st support at 1071.11, where the -previous swing low is located. In an alternate scenario, price could possibly head back up towards the 1st resistance level at 1291.84, where the 38.2% Fibonacci line is located. Trading Recommendation Entry: 1302.56 Reason for Entry: 1st resistance line Take Profit:1071.11 Reason for Take Profit: 1st support line Stop Loss: 1677.00 Reason for Stop Loss: Slightly above where the 2nd resistance line is located.

    *The market analysis posted here is meant to increase your awareness, but not to give instructions to make a trade.

    Analysis are provided by InstaForex.

    Read More
    Best regards, PR Manager
    Learn more about InstaForex Company at http://instaforex.com

  9. #1319
    Senior Member InstaForex Gertrude's Avatar
    Join Date
    Sep 2015
    Posts
    1,885
    Forex Analysis & Reviews: USD/MXN Currency Pair Intraday Price Movement Technical Analysis Wednesday November 30, 2022.


    With price movements moving below the Moving Average of the 100 period and the CCI indicator still moving in the range of 0 to -100 levels on the 4-hour chart, the condition of the USD/MXN currency pair is confirmed to be still moving in a bearish bias while currently an upward correction is occurring. stuck at the Resistance level 19,268-19,240 if this level area is strong to hold the upward correction rate and does not exceed the 19,390 level then USD/MXN will have the potential to fall again down to the 19,036 level.

    Analysis are provided by InstaForex.

    Read More
    Best regards, PR Manager
    Learn more about InstaForex Company at http://instaforex.com

  10. #1320
    Senior Member InstaForex Gertrude's Avatar
    Join Date
    Sep 2015
    Posts
    1,885
    Forex Analysis & Reviews: EUR/USD. Overview for December 1, 2022


    On Wednesday, there was no movement in the EUR/USD currency pair. We wouldn't have been shocked if this situation had occurred on Monday or Tuesday because there hasn't been a single significant event or report published lately. On Wednesday, there were a ton of macroeconomic statistics. Still, traders paid no attention to the report on European inflation, although it was just as alarming as the last one on American inflation, which sparked this rally. Yet again, we are convinced that the impact of European statistical data on trader sentiment is minimal. But the main point is that quite significant reports from abroad were disregarded yesterday. The ADP report could cause a market reaction if everything in the GDP report is clearer because such reports always come out with three estimates. After the first estimate, it is clear what to expect from the value for a particular quarter.

    And it's puzzling why the market didn't find anything interesting in them when we consider all the information and data received. As a result, the pair is still relatively close to the moving average line, and it is still determining the direction of its future movement. For the past week and a half, we have been anticipating a significant downward correction, but this calls for a fix that is at least below the moving average. Formally, the consolidation was visible on Tuesday, but 20 points hardly qualify as a confident result. We focus on the second rebound from Murray level "6/8"-1.0498. Two rebounds from this level could signal the start of a corrective movement. As you can see, traders were unmoved by yesterday's data, so we now have to wait for Friday's nonfarm payrolls and unemployment figures.

    In the third quarter, US GDP increased.

    Since the GDP report typically includes three estimates, as we mentioned above, traders know what to expect before the second or third estimate is released. However, yesterday's report caught some people off guard because, contrary to expectations of +2.6–2.7% q/q, the actual value was 2.9%. This strong deviation should have benefited the value of the US dollar. Not only was the EU inflation report disregarded, but so was a rather significant GDP with an unexpected value. Even the ADP report received no response. Therefore, even though we think traders still have access to the factors supporting the US currency, they are not yet eager to repurchase the dollar.

    As a result, the third quarter of the American economy displays very positive dynamics and can easily compensate for the "disadvantages" of the first two quarters. If this occurs, the Fed will have many more opportunities to raise interest rates as much as it wants. It is again good for the dollar because if inflation stops falling, the Fed will still have opportunities to tighten monetary policy more than expected. It will then become very difficult to talk about a recession in the US economy. Additionally, the fact that there isn't a recession is excellent news for the American economy. Similar to how it is for every other economy in the world. For instance, it is unlikely that the European economy will be spared from such "happiness." Additionally, a slower inflation rate in the Eurozone might encourage the ECB to raise the key rate gradually over the next few months. The euro currency may experience the same fate as the dollar, which has been declining for several months due to the Fed's potential decision to raise interest rates more gradually than previously. Although there are more and more signs pointing to a new rise in the dollar's value, more precise technical signals are still needed to test this theory. We will only analyze Jerome Powell's speech today because it is crucial to know how the market will respond.

    As of December 1, the euro/dollar currency pair's average volatility over the previous five trading days was 103 points, considered "high." So, on Thursday, we anticipate the pair to fluctuate between 1.0331 and 1.0538 levels. The Heiken Ashi indicator's turning downward indicates a new phase of the corrective movement.

    Nearest levels of support
    S1 – 1.0376
    S2 – 1.0254
    S3 – 1.0132

    Nearest levels of resistance
    R1 – 1.0498
    R2 – 1.0620
    R3 – 1.0742

    Trading Suggestions:

    The EUR/USD pair is still positioned close to the moving average. To avoid the Heiken Ashi indicator turning down, new long positions with targets of 1.0498 and 1.0538 should now be considered. Only after fixing the price below the moving average line with targets of 1.0254 and 1.0132 will sales become significant.

    Explanations of the illustrations:

    Linear regression channels help determine the current trend. The trend is strong if both are directed in the same direction.

    The moving average line (settings 20.0, smoothed) determines the short-term trend and the direction to trade now.

    Murray levels are target levels for movements and corrections.

    Volatility levels (red lines) are the likely price channel in which the pair will spend the next day, based on current volatility indicators.

    The CCI indicator – its entry into the oversold area (below -250) or into the overbought area (above +250) means that a trend reversal in the opposite direction is approaching.

    Analysis are provided by InstaForex.

    Read More
    Best regards, PR Manager
    Learn more about InstaForex Company at http://instaforex.com

Page 132 of 164 FirstFirst ... 32 82 122 130 131 132 133 134 142 ... LastLast

Tags for this Thread

Bookmarks

Posting Permissions

  • You may not post new threads
  • You may not post replies
  • You may not post attachments
  • You may not edit your posts
  •