Page 16 of 22 FirstFirst ... 6 14 15 16 17 18 ... LastLast
Results 151 to 160 of 219
Like Tree1Likes

Stocks, ETFs, Options, Commodities & Currencies

This is a discussion on Stocks, ETFs, Options, Commodities & Currencies within the Analytics and News forums, part of the Trading Forum category; This has been the best week in a long time for intraday trades. The last 4 days the SP500 gave ...


  1. #151
    Senior Member Technician's Avatar
    Join Date
    Feb 2013
    Posts
    220

    How To Consistently Make Money

    This has been the best week in a long time for intraday trades. The last 4 days the SP500 gave us 8 trades and all 8 turned into winners. Each days turning generating between $300 a $1250 per ES mini contract, although these can be traded using the SPY or 3X index ETFs.

    Subscribers who day trade are taking this pre-market analysis and setups and making a weeks wage within 1 – 3 hears in the morning before lunch.

    What makes these trade triggers is that they are the BROAD market SP500 so if you day trade other stocks knowing the short term market direction each morning add so much power to your other day trades for timing entries and exits.

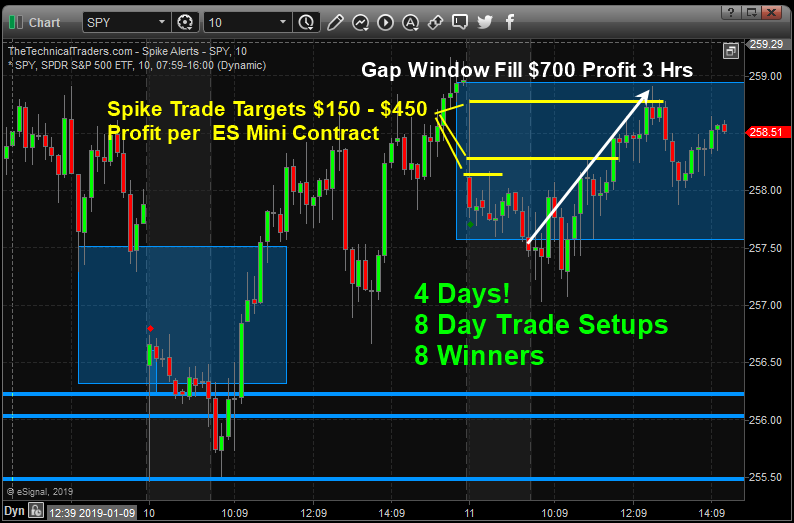
    SPY ETF 10-Minute Chart

    This chart focuses on today’s spike higher and gap lower. both these played out once again and are based strictly on technical analysis and statistical analysis.


    more...

  2. #152
    Senior Member Technician's Avatar
    Join Date
    Feb 2013
    Posts
    220

    Crude Oil breakout to bearish reversal

    You can see from this Daily Crude oil chart that price has formed a consolidated price channel between $50 and $53 ppb. This price channel aligns with a November 2018 price consolidation zone. It is our belief that any advance above $55~56 ppb, will result in a new upward price move to $64-65 ppb.

    Stocks, ETFs, Options, Commodities & Currencies-brentcrud-d1-fx-choice-limited.png


    Crude oil chart highlights the Fibonacci projected price zones that represent the incredibly strong resistance level currently setup in Crude. The Weekly chart shows a zone between $50~56 as a critical resistance zone. One key element of Fibonacci price theory is that price must always attempt to seek out new highs or new lows as it rotates. Thus, if this current upside move fails to establish new highs above this resistance zone, then it must move lower to attempt to establish new lows. This means the $40 price target is a very viable immediate objective.

    Stocks, ETFs, Options, Commodities & Currencies-brentcrud-w1-fx-choice-limited.png


    Global demand for oil, as well as global economic data, could be key to understand the future demand and price for oil. At this point, a new upper fractal top formation will generate new Fibonacci price targets to the downside.

    more...

  3. #153
    Senior Member Technician's Avatar
    Join Date
    Feb 2013
    Posts
    220

    Will China Surprise The Us Stock Market?

    Stocks, ETFs, Options, Commodities & Currencies-indhsidaily.png

    Recently, we openly discussed the potential for global turmoil related to Europe, Asia, China, and South America. The issues before the globe are that the global economy may not be firing in sync and that there are credit and debt, as well as geopolitical, issues that persist. The interesting component of all of this is that the US stock market has staged a very impressive recovery over the past two weeks that have shocked even the best Wall Street analysts and researchers. While the US recovered from elections, the Fed, FANG price collapse and a Government Shutdown, the US stock markets appeared to be falling off a cliff. Then, almost exactly on Christmas Eve, the markets turned around – even in the midst of all of this uncertainty.

    Stocks, ETFs, Options, Commodities & Currencies-indnasdaqdaily.png

    Now, nearly 3 weeks after Christmas, the US stock market appears to be shaking off the negativity and headed for higher price levels. China announced a plan to eliminate the trade barriers between the US by providing a 10-year plan to gradually eliminate any US trade deficit. Even though China has discussed this plan before, the US stock market ate it up like a starving man on a deserted island. The ES rallied over 3.35% this week. The NQ rallied over 3.0% and the YM rallied over 3.25% week.

    more...

  4. #154
    Senior Member Technician's Avatar
    Join Date
    Feb 2013
    Posts
    220

    Oil Bullish Reversal Above $70?

    Recent global news regarding Venezuela, China, and global oil supply/production have resulted in the price of Oil pausing over the past few weeks near $53 to $55 ppb. We believe the continued supply glut and uncertainty will result in oil prices falling, briefly, back below $50 ppb before any new price rally begins.

    Stocks, ETFs, Options, Commodities & Currencies-brentcrud-d1-fx-choice-limited.png


    Eventually, yes, oil will rally above $55 and attempt to target the $65+ price level. Yet we don’t believe that move is going to happen right now. We believe the global uncertainty; the slowing Chinese economy and the global supply glut will result in a fundamental price decrease before any momentum for an upside price move begins. Our analysis suggests a price move back below $50 ppb, likely targeting the $46~47 level, where basing may occur.

    more...

  5. #155
    Senior Member Technician's Avatar
    Join Date
    Feb 2013
    Posts
    220

    NASDAQ and DOW - Bullish Ranging

    Stocks, ETFs, Options, Commodities & Currencies-us30index-w1-fx-choice-limited.png


    Our researchers believe the NQ and YM chart illustrates a very different dynamic which is currently at play in the US Stock Markets. The NQ, the Technology heavy NASDAQ futures, appears to have stalled near the 75% Fibonacci price retracement level whereas the YM, the Blue Chip heavy DOW futures, has already rallied past this level and is setting up a “double top” formation near 26268. It is our belief that the US Stock Markets are already nearing an intermediate top rotation price area and that traders need to actively protect their long trades/profits right away. We believe a downside price rotation may take place very quickly over the next 5~10+ days and that the markets may rotate downward by a minimum of 4~6% in what we are calling a “momentum rotation setup”.

    more...

  6. #156
    Senior Member Technician's Avatar
    Join Date
    Feb 2013
    Posts
    220

    Crude Oil: Weekly Bullish Reversal

    Our researchers believe Oil will come under pricing pressure over the next few weeks as consumers react to the higher gasoline prices. The recent price stall near $65 aligns with a key Fibonacci retracement level near $63.98 and we believe any further upside in Oil may be limited. Our researchers believe a downside price retracement will begin to unfold where Oil prices will fall to below $55 ppb initially and potentially target sub $50 levels eventually.

    Stocks, ETFs, Options, Commodities & Currencies-brentcrud-w1-fx-choice-limited.png


    The recent rally in oil prices from last 2018 was in-line with expectations that the US and global markets would recover after the deep price correction in Q4 2018. As the US stock market continues to rally towards new highs, we suggest watching Crude Oil, Transports and overall consumer activity to determine is a mild consumer recession sets up over the next few weeks. Our research suggests that Q2 is typically fairly strong for Transports and Oil. Q3, or the Summer season, is typically relatively weak. This fall into the old trader saying “Sell in May and go away”. We believe the rotation lower in Oil and consumer activity related to the higher oil prices may hit the markets a bit earlier this year and set up some incredible trading opportunities.

    more...

  7. #157
    Senior Member Technician's Avatar
    Join Date
    Feb 2013
    Posts
    220

    Fed Leaves Rates Unchanged

    The Federal Reserve announced they were leaving rates unchanged on Wednesday, June 19. The markets were expecting this or a quarter percent price decrease. Initially, the markets reacted to the news by moving to the downside recently. The markets immediately reversed the upside rather dramatically showing that investors believed that that may move into an easy stance within a few months.

    Stocks, ETFs, Options, Commodities & Currencies-golddaily.png


    The big movers after the bad news which we expected were in gold, silver, miners and the US dollar. Subscribers locked in another 17.4% winning trade on this fed news while the US dollar rotated lower on Tuesday, June 18 prompting a further downside move after the bad news. It is very likely that the US dollar will move lower an attempt to retest support near 96.50. A weakening US dollar will help to support the US stock market and precious metals prices. Additionally, a weaker US dollar will help support trade, economic growth, employment, and GDP output.

    Stocks, ETFs, Options, Commodities & Currencies-silverweekly.png


    We believe the US stock market is nearing upper resistance. We still believe the US stock market will eventually attempt to move about the psychological levels of 3000 for the S&P, 30,000 for the Dow and 340 SPY. This move to new all-time highs will likely result in a ”scouting party” type of price pattern where price attempts to identify new resistance, slightly above the psychological levels, then reverses back below these levels to retest support.

    Stocks, ETFs, Options, Commodities & Currencies-us.500daily.png


    Our continued belief that a large pennant/flag formation is unfolding has not changed. As technical analysts, we need to wait for the new price peak form before we can identify where the upper channel of the pennant/flag formation is trending. We would urge traders to be conscious that any outside move in the stock markets as a very limited upside potential from current levels. The SPY is trading at 293 and we believe upper resistance will be found slightly above 300. Thus, we really have about a $7 or $8 move to the upside from current levels – only about 3% to 4% more room to the upside.

    more...

  8. #158
    Senior Member Technician's Avatar
    Join Date
    Feb 2013
    Posts
    220

    G20 News Drive Big Moves In The Markets

    The other big news originated from the Bank of International Settlements (BIS). This Swiss-based central banking committee for “central banks” released an annual report on the progress of global central banks and the global economy last weekend. They urged central banks not to chase easy money policies any longer and to focus on core policy changes, practical economic practices, and real leadership to help drive future growth. They urged nations that easy money policies may help to show some types of immediate economic improvements – but that the risks of continuing such policies and lack of true economic reforms do nothing but pack risk into the back end of these efforts.

    Stocks, ETFs, Options, Commodities & Currencies-xagusd-d1-alpari-international.png


    Our opinion is the US stock market is poised for a big move based on this news and continued economic activity. If the US is able to settle trade issues in a manner that supports a strong future economic output and restore some balance to foreign trade, as well as continue to produce strong economic activity and output levels throughout the last 6+ months of this year, we could see a very strong price rally setting up into the end of 2019. This could prompt a big move to the upside IF all things line up properly as we have suggested.

    Stocks, ETFs, Options, Commodities & Currencies-spx500-d1-alpari-international.png


    If things take an ugly turn over the next 2 to 4+ months, then we believe current support levels will likely act as a floor in the US stock market as the global economies struggle to find their “launch button” to jump-start their economies. As the news stated, the economic factors of the globe are in a transitional state at the moment. The US is the leading global economic engine and many other foreign economies must transition away from easy money policies and make hard choices to drive future growth. Volatility will be KING over the next few months/years and the US Dollar will likely continue to strengthen as this transition plays out.

    more...

  9. #159
    Senior Member Technician's Avatar
    Join Date
    Feb 2013
    Posts
    220

    Crude Oil - Ranging for Direction

    Our researchers believe the technical reason why Crude Oil will continue lower is that price rotation has continued to support a downside price trend (Bearish) and that recent price resistance near the upper price channel has been rejected. This is a near perfect example of how the Fibonacci price theory works in real markets. The price must always attempt to establish “new price highs” or “new price lows” AT ALL TIMES.

    Stocks, ETFs, Options, Commodities & Currencies-brentcrud-w1-fx-choice-limited.png


    After the deep price bottom in December 2018 near $42.50, oil price began an upside price move reaching just above our $66 target in late April 2019. Since then, another downside price move, which we called in our May 21 article, has driven oil prices to the $50.60 level. The current upside price move has recently retested the $60 resistance level and has pulled back to where we are today around $56 per barrel.

    more...

  10. #160
    Senior Member Technician's Avatar
    Join Date
    Feb 2013
    Posts
    220

    Gold Forecast: Gold Is Going Parabolic

    As a technical analyst since 1997 for Technical Traders Ltd., I believe gold is entering the final leg of an advanced upside price wave formation that will ultimately target $1650 to $1750 in the coming months.

    Stocks, ETFs, Options, Commodities & Currencies-xauusd-w1-fx-choice-limited.png


    New research suggest Gold prices are about to enter an upside parabolic price phase. This happens when a price anomaly sets up and when price is dramatically undervalued compared to market dynamics, global concerns, and fundamentals. We believe this unique price anomaly has setup in Gold and that price will quickly advance to levels above $1550, then briefly stall, then rally further to levels near $1650 or $1750 before reaching our ADL predictive modeling objectives.

    Stocks, ETFs, Options, Commodities & Currencies-xauusd-mn1-fx-choice-limited.png


    This parabolic move may stall or end near $1650 to $1750, but this is just the beginning of an even bigger upside price move setting up as an advanced wave formation. Our research team are hard at work attempting to identify the future price legs, rotations and key support/resistance levels of these future price advances. Ultimately, we believe price levels in excess of $3750 are very likely if the global issue continue to build and start to unfold. Yet we don't have any time/date specific targets for these levels yet, as that is an extreme level I’m sure you agree with.

    more...

Page 16 of 22 FirstFirst ... 6 14 15 16 17 18 ... LastLast

LinkBacks (?)


Tags for this Thread

Bookmarks

Posting Permissions

  • You may not post new threads
  • You may not post replies
  • You may not post attachments
  • You may not edit your posts
  •