
 1Likes
 LinkBack URL
 About LinkBacks


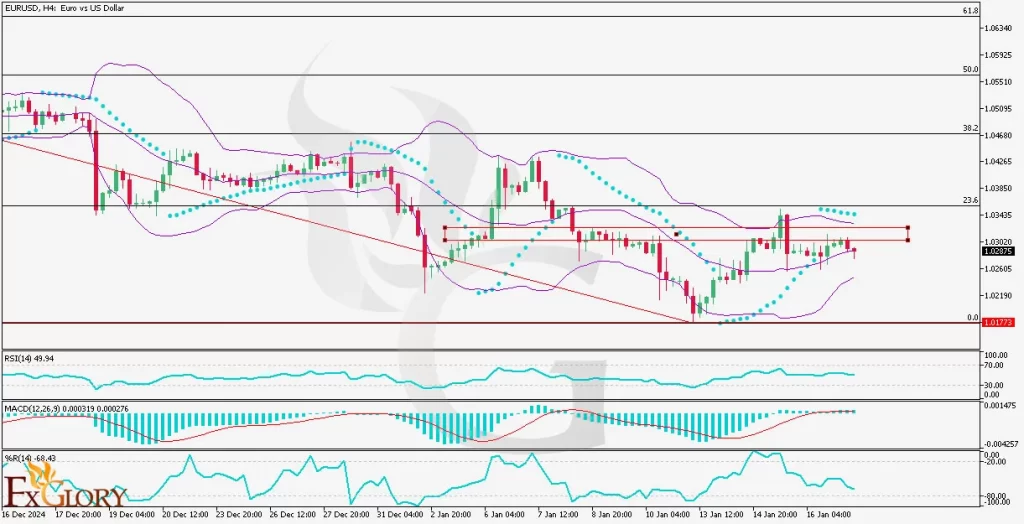
EURUSD Daily Technical and Fundamental Analysis for 01.17.2025
Time Zone: GMT +2
Time Frame: 4 Hours (H4)
Fundamental Analysis:
The EUR/USD pair is heavily influenced by economic reports and central bank policies from both the European Central Bank (ECB) and the US Federal Reserve. The Eurozone's current economic focus is on inflation metrics and trade balances. With the ECB's monetary policy still leaning towards cautious tightening, any further increase in interest rates could support the euro. Meanwhile, the USD faces upcoming releases related to residential building permits and factory output, which will offer insights into the strength of the US economy. Given the global economic outlook, the USD is expected to hold steady or show signs of further weakness if the data disappoints.
Price Action:
The EURUSD chart for the H4 timeframe shows a clear bearish trend over the past few weeks. The EUR USD price has struggled to maintain above the mid-Bollinger Band, with an overall downward pressure indicated by the tightness of the Bollinger Bands. Despite a brief return to the middle band, the bearish candles indicate that sellers are still in control. A trendline running through the chart highlights a possible continuation of the downward pressure. The market has tested key support areas without much follow-through in price action, indicating a potential break or consolidation soon.
Key Technical Indicators:
Bollinger Bands: The Bollinger Bands have tightened, indicating that volatility in EUR/USD is decreasing. The price has been fluctuating between the middle and lower bands. After moving from the lower band, the price has struggled to hold above the middle band, indicating that the market may not have sufficient momentum to push higher, and could be preparing for another dip.
Parabolic SAR (Stop and Reverse): The Parabolic SAR is showing spots above the candles, signaling a bearish trend. This is consistent with the ongoing price action, which suggests that the market is likely to continue in its bearish direction unless a reversal occurs with stronger momentum.
RSI (Relative Strength Index): The RSI currently sits at 49.94, suggesting that the EURUSD is in a neutral zone, neither overbought nor oversold. This indicates that there is still room for further downward movement or an eventual reversal, depending on market conditions.
MACD (Moving Average Convergence Divergence): The MACD is showing a very slight negative divergence with the histogram below the zero line, indicating a weakening bearish momentum. However, the EUR-USD price is still below the signal line, suggesting that the bearish trend could persist unless a stronger bullish crossover occurs.
%R (Williams Percent Range): The Williams Percent Range (%R) sits at -68.43, indicating that the price is approaching oversold conditions but has not yet reached the extreme levels. This suggests potential for a reversal if buying pressure intensifies, but for now, the market remains largely bearish.
Support and Resistance:
Support: The immediate support is at 1.01773, which has acted as a significant level for EURUSD price consolidation in recent weeks. A breakdown below this level could open the door for further downside toward 1.0100.
Resistance: The nearest resistance is around 1.03200, with further resistance seen at 1.03435, which coincides with recent highs and the middle Bollinger Band. A clear break above this level could signal a potential shift to a more neutral or bullish bias.
Conclusion and Consideration:
EUR/USD continues to face a challenging market environment, as the EUR USD pair remains within a clear bearish trend. The technical indicators point towards potential further downside, but the tightening Bollinger Bands, coupled with a neutral RSI, suggest that the market is in a consolidation phase. Traders should watch the key support levels at 1.01773 and 1.0100, as a break below could signal a deeper bearish move. The upcoming data from both the Eurozone and the US will be crucial in determining the next market direction, so caution is advised.
Disclaimer: The analysis provided for EUR/USD is for informational purposes only and does not constitute investment advice. Traders are encouraged to perform their own analysis and research before making any trading decisions on EURUSD. Market conditions can change quickly, so staying informed with the latest data is essential.
FXGlory
01.17.2025


 Reply With Quote


Bookmarks