 20Likes
 LinkBack URL
 About LinkBacks


By the way, it may be good EA ... at least - for the first version of it.
Just an idea.

This is a discussion on BBands_Stop within the Trading tools forums, part of the Trading Forum category; By the way, it may be good EA ... at least - for the first version of it. Just an ...
By the way, it may be good EA ... at least - for the first version of it.
Just an idea.

Bollinger Bands Forex Trading Indicator
Developed by John Bollinger.
The Bollinger Bands indicator acts as a measure of volatility. This indicator is a price overlay indicator. The indicator consists of three lines; the middle line (moving average), an upper line and a lower line. These three bands will enclose the price and the price will move within these three bands.
This indicator forms upper and lower bands around a moving average. The default moving average is the 20-SMA. This indicator use the concept of standard deviations to form their upper and lower Bands.
The example is shown below.
Bollinger Bands Indicator
Because standard deviation is a measure of volatility and volatility of the market is dynamic, the bands keep adjust their width. higher volatility means higher standard deviation and the bands widen. Low volatility means the standard deviation is lower and the bands contract.
Bollinger Bands use price action to give a large amount of information. The information given by the this indicator includes:
- Periods of low volatility- consolidation phase of the forex market.
- Periods of high volatility- extended trends, trending forex markets.
- Support and resistance levels.
- Buy and Sell points.
How Bollinger Bands Indicator Works
Bollinger Bands calculations uses standard deviation to plot the bands, the default value used is 2.
Calculation
- The middle line is a simple moving average
- The upper line is: Middle line + Standard Deviation
- The lower line is: Middle line - Standard Deviation
Bollinger considered the best default for his indicator to be 20 periods moving average and the the bands are then overlaid on the price action.
Standard Deviation is a statistics concept. It originates from the notion of normal distribution. One standard deviation away from the mean either plus or minus, will enclose 67.5 % of all price action movement. Two standard deviations away from the mean either plus or minus, will enclose 95 % of all price action movement.
This is why the Bollinger Bands indicator uses the standard deviation of 2 which will enclose 95 % of all price action. Only 5 % of price action will be outside the bands, this is why traders open or close trades when price hits one of the outer Bands.
The Bollinger Bands indicator main function is to measure volatility. What the Bollinger Bands upper and lower limits try to do is to confine price action of up to 95 percent of the possible closing prices
This indicator compares the current closing price with the moving average of the closing price. The difference between them is the volatility of the current price compared to the moving average. The volatility will increase or decrease the standard deviation.

Bollinger Bands and Volatility
When volatility is high; prices close far away from the moving average, the Bands width increases to accommodate more possible price action movement that can fall within 95% of the mean.
Bollinger bands will widen as volatility widens. This will show as bulges around the price. When bollinger bands widen like this it is a continuation pattern and price will continue moving in this direction. This is normally a continuation signal.
The example below illustrates the Bollinger bulge.
High Volatility and Low Volatility
When volatility is low; prices close closer towards the moving average, the width decreases to reduce the possible price action movement that can fall within 95% of the mean.
When volatility is low price will start to consolidate waiting for price to breakout. When the bollinger bands is moving sideways it is best to stay on the sidelines and not to place any trades.
The example is shown below when the bands narrowed.

Bollinger Bands Indicator Bulge and Squeeze Technical Analysis
The Bollinger Bands are self adjusting which means the bands widen and narrow depending on volatility.
Standard Deviation is the statistical measure of the volatility used to calculate the widening or narrowing of the bands. Standard deviation will be higher when prices are changing significantly and lower when markets are calmer.
- When volatility is high the Bands widen.
- When volatility is low the Bands narrows.
The Bollinger Squeeze
Narrowing of Bands is a sign of consolidation and is known as the Bollinger band squeeze.
When the Bollinger Bands display narrow standard deviation it is usually a time of consolidation, and it is a signal that there will be a price breakout and it shows people are adjusting their positions for a new move. Also, the longer the prices stay within the narrow bands the greater the chance of a breakou
The Bollinger Bulge
The widening of Bands is a sign of a breakout and is known as the Bulge.
Bollinger Bands that are far apart can serve as a signal that a trend reversal is approaching. In the example below, the bands get very wide as a result of high volatility on the down swing. The trend reverses as prices reach an extreme level according to statistics and the theory of normal distribution. The "bulge" predicts the change to downtrend.

Bollinger Bands Price Action in Trending Forex Markets
Bollinger Bands indicator is used to identify and analyze trending markets. In a trending market this indicator clearly shows up or down direction.
This indicator can be used to determine the direction of the forex trend. In an uptrend this indicator will clearly show the direction of the trend, it will be heading upwards and price will be above middle bollinger.
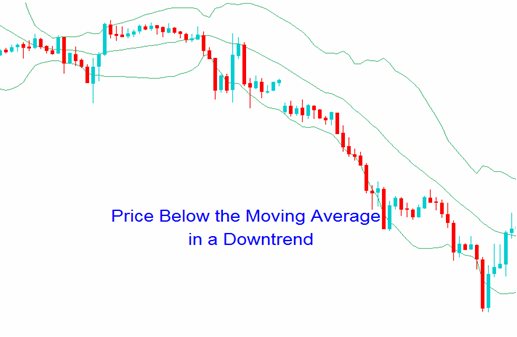
In a downtrend the price will be below the middle band and the bands will be heading downwards.
By observing the patterns formed by bollinger bands a trader can determine the direction in which the price is likely to move.
Patterns and Continuation Signals
Forex Uptrend
- Uptrend In general, during an upswing, the price will stay within the upper band and the central moving average.
- Prices that close above the upper band are a sign of price continuation.
- prices can hug/ride the upper band during an uptrend
Price hugs the upper band in a forex upward.
Forex Downtrend
- During a downswing, the price will stay within the moving average and the lower band.
- Prices that close below the lower band are a sign of price continuation.
- prices can hug/ride the lower band during an downtrend

Bollinger Bands Price Action in Ranging Forex Markets
Bollinger Bands Indicator is also used to identify periods when a currency price is overextended. The guidelines below are considered when applying this indicator to a sideways trend.
It is very important because it is used to give indications that a break out may be upcoming. During a trending market these techniques do not hold, this only holds as long as Bollinger Bands are pointing sideways.
- If price touches the upper band it can be considered overextended on the upside- overbought.
- If price touches the lower band the currency can be considered overextended on the bottom side- oversold.
One of the uses of Bollinger Bands is to use the above overbought and oversold guidelines to establish price targets during a ranging market.
- If price has bounced off the lower band and crossed the center-line moving average then the upper band can be used a sell price level.
- If price bounces down off the upper band and crosses below the center moving average the lower band can be used as a buy price level.
In the above ranging market the instances when the price level hits the upper or lower bands can be used as profit targets for long/short positions.
Trades can be opened when price hits the upper resistance level or lower support level. A stop loss should be placed a few pips above or below depending on the trade opened, just in case price action breaks out of the range.

Bollinger Bands Trend Reversals- Double Tops and Double Bottoms
A Forex trader should wait for the price to turn in the opposite direction after touching one of the bands before considering that a reversal is happening.
Even better one should see the price cross over the moving average.
Double Bottoms Trend Reversals
A double bottom is a buy setup/signal. It occurs when price action penetrates the lower bollinger band then rebounds forming the first low. then after a while another low is formed, and this time it is above the lower band.
The second low must not be lower than the first one and it important is that the second low does not touch or penetrate the lower band. This bullish Forex trading setup is confirmed when the price action moves and closes above the middle band (simple moving average).
Double Tops Trend Reversals
A double top is a sell setup/signal. It occurs when price action penetrates the upper bollinger band then rebounds down forming the first high. then after a while another high is formed, and this time it is below the upper band.
The second high must not be higher than the first one and it important is that the second high does not touch or penetrate the upper band. This bearish Forex trading setup is confirmed when the price action moves and closes below the middle band (simple moving average).
Bollinger Bands Forex Trading Strategy Summary
Bollinger Bands is a popular indicator that can be used in various ways. However, like most indicators it should not be used alone. This indicator work best combined with overbought and oversold indicators and oscillators.
Since Bollinger Bands uses volatility to determine the trend, traders should not use indicators that duplicate this information. Instead these bands should combined with indicators that measure volume or momentum. The table below summarizes trading strategies used with this indicator.


Originally Posted by igorad

Igor
Is It possible to convert this indicator using 'AllAverages_v3.1' calculations ?
Thanks


 Reply With Quote


Bookmarks