 14Likes
 LinkBack URL
 About LinkBacks


The only pair which is interesting concerning patterns for this week is XAUUSD - all developing/forming patterns (see red arrows on separate windows on the chart) are showing uptrend :

This is a discussion on Patterns by HWAFM within the Trading Systems forums, part of the Trading Forum category; The only pair which is interesting concerning patterns for this week is XAUUSD - all developing/forming patterns (see red arrows ...

The only pair which is interesting concerning patterns for this week is XAUUSD - all developing/forming patterns (see red arrows on separate windows on the chart) are showing uptrend :

Just some investigating for this coming week before market is open ...
USDCAD
Gartley formed pattern for uptrend, H12. Pattern is already formed :
USDCAD, H4: USDCAD H4 - Gartley forming pattern for uptrend (patytern is just forming ... uptrend too)
Premium Trading Forum: subscription, public discussion and latest news
Trading Forum wiki || MQL5 channel for the forum
Trading blogs || My blog

And this is interesting situation for EUDUSD : all the developing/forming patterns (started from H4 timeframe) are showing downtrend.
Just an example :
Premium Trading Forum: subscription, public discussion and latest news
Trading Forum wiki || MQL5 channel for the forum
Trading blogs || My blog


I like the dashboard indicating the possible formations in other timeframes of the instrument. Is there an MT4 version of this indicator?
If no, any possibility of programming for an MT4 version?
With much appreciation
There is no MT4 version of this HWAFM tool sorry. Besides, I am not sure that it is possible to programe same tool using mql4 programming language - because mql5 is more advanced (MT5 is programming language using for Metatrader 5).
In case of Metatrader 4 - we are having ZUP only here Harmonic Trading
Premium Trading Forum: subscription, public discussion and latest news
Trading Forum wiki || MQL5 channel for the forum
Trading blogs || My blog
It is unfortunate that the author doesn't want to further develop this tool.
Thanks for the reply,Originally Posted by newdigital

I am using the ZUP 135 easy version with great success. Scanning different currencies and Timeframes takes time. The only scanner for these harmonic patterns costs a handsome fee from Fxgroundworks.com
Which other indicator are traders using to confirm these harmonic patterns? I am using Stochastics/RSi in conjunction with ZUP. Psar and 123 pattern are also great entry confirmation tools and divergence too!

Talking Points
- AB=CD Pattern is easy to identify on the charts
- AB=CD Pattern has a structure made up of equal price legs
- The AB=CD Pattern must happen at specific Fibonacci points
Would you pay $1500.00 to learn this pattern? If you answered “No!” then would not have purchased the book with the first appearance of this pattern in 1935 written by none other than H.M Gartley, the father of harmonic patterns.
The Forex AB=CD Pattern or equal wave pattern is an impulsive move in the market. It is part of Elliott Wave theory, but you don’t have to know Elliott Wave in order to make use of this easy pattern.
The BC leg usually retraces to the 0.618 Level of AB but it should not retrace beyond the 0.786 retracement. If leg BC moves lower than the 0.786 Fibonacci retracement level then the pattern is invalid.
In addition, a shallow retracement to the 0.236 or 0.382 level shows traders are eager to end the correction and resume the uptrend as they are unwilling to wait for the 0.618 level
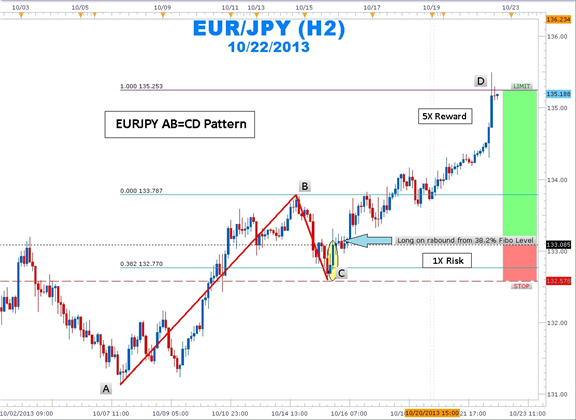
Learn Forex: EURJPY AB=CD Pattern
Notice in the above example of EUR/JPY on the 2-hour chart how the “A” leg was formed with the impulsive move from 131.14 and ending at 133.78 for point “B”. After a stellar run of 264 pips, traders will wait for a profit taking decline to end at a Fibonacci level. While the average retracement is to the 0.618 level or 163 pips for this move; the decline was only 100 pips from point B (133.78) to point C near 132.77. In the above trade the risk to reward was 1 to 5!
A sharp rebound from point C could have been entered on October 16th at 133.08 with five range bound candles before EUR/JPY really started moving. After entering long at 133.08, a protective stop could have been placed at 132.57 just below point C at 132.60.From there, a 264 pip limit could have been set at 135.25 which was handily hit on October 22nd.
In the above example the distance from point A and B was fairly equal to the distance from points C and D. However, an expansion of volume can lead to the D target point to move higher to other Fibonacci expansion ratios of 1.272, 1.382, 1.618 and even 2.618. Taking part of a trade off at the 1.00 expansion target and using a trailing stop for the rest of the position will allow a trader to participate in more of the move.
As you can see, the AB=CD is a useful pattern to add to your tool kit as it can provide trades with small amounts of risk in relation to the possible reward. Now you know your ABCD’s to finding good trades!
--- Written by Gregory McLeod, Trading Instructor
More...
Something to read :
The Gartley Trading Method: New Techniques To Profit from the Markets Most Powerful Formation (Wiley Trading): Ross L. Beck
Premium Trading Forum: subscription, public discussion and latest news
Trading Forum wiki || MQL5 channel for the forum
Trading blogs || My blog
my chart gets closed whenever i load the ea or indicator on my chart. pls what do i do
 Posting Permissions


 Reply With Quote


Bookmarks