Page 2 of 5 FirstFirst 1 2 3 4 ... LastLast
Results 11 to 20 of 46
Like Tree3Likes

The Definitive Guide to Scalping

This is a discussion on The Definitive Guide to Scalping within the Trading Systems forums, part of the Trading Forum category; Talking Points Risk management should be considered prior to entering into a trade Never risk more that 1% of your ...


  1. #11
    member ForeCastle's Avatar
    Join Date
    Apr 2013
    Posts
    1,077
    Blog Entries
    236

    The Definitive Guide to Scalping, Part8: Risk Management

    Talking Points

    • Risk management should be considered prior to entering into a trade
    • Never risk more that 1% of your balance on any single trade idea
    • Stop trading if losses amount to more than 5% in one trading day


    The final lesson scalpers must learn is probably the most important, risk management. The decision on how to manage risk can have a great impact on the bottom line of your account than deciding where your entry orders should go or even what time frame to trade on.
    Today we will conclude the Definitive Guide to Scalping as we focus on managing risk when scalping.

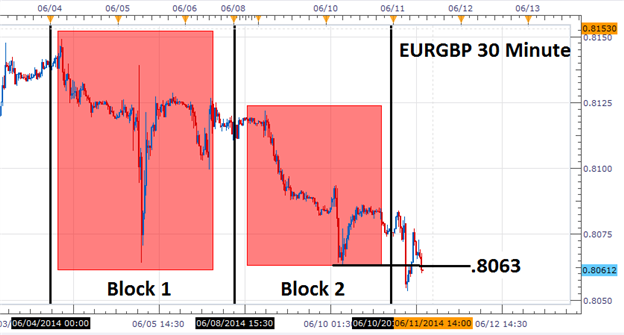
    Learn Forex – GBPCAD Early Morning Breakout


    Stop Placement

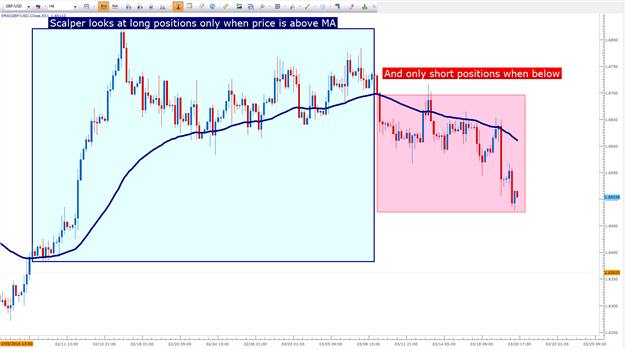
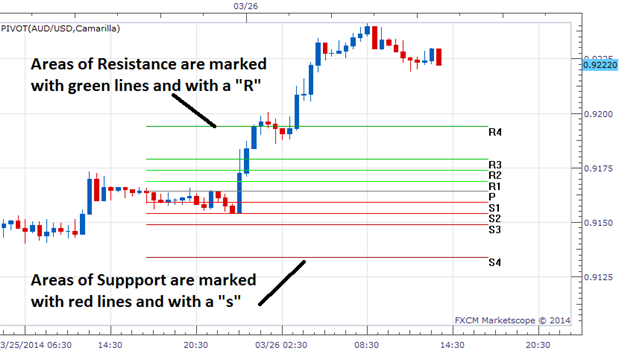
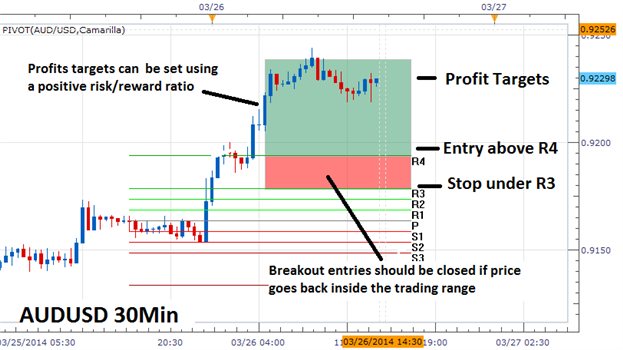
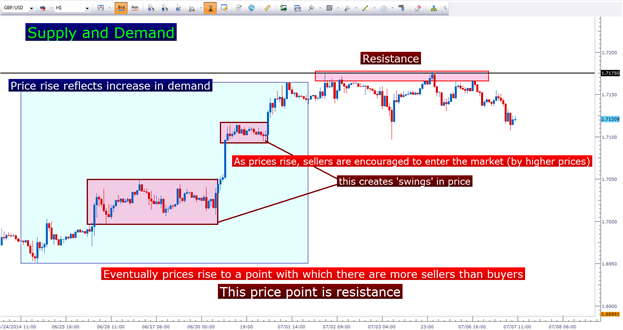
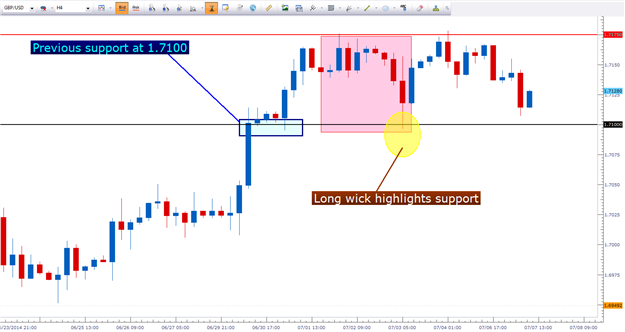
    The first key to risk management is to identify a key level of support and resistance. This can be done through a variety of methods mentioned in the 4th installment of the Definitive Guide to Forex Scalping. Once found, regardless if you are trading retracements, breakouts, or ranges will have a definitive area to place your stop. In the event you are looking to buy a currency pair, risk should be managed underneath a line of support. Conversely, if a trader is selling a currency pair, risk should be managed above a level of resistance.

    Traders should also consider how close to these lines of support and resistance to place their stop. Aggressive traders can set their stop very close to these values to close losing positions as quickly as possible. This is opposed to a more conservative approach where stops would be placed further away to allow positions more space to breath.

    When it comes to placing stops it is important to remember that each traders strategy and risk tolerances will be different! But regardless of your choices, always scalp with a stop. Now let’s look at a few other rules scalpers should remember.


    The 1% Rule

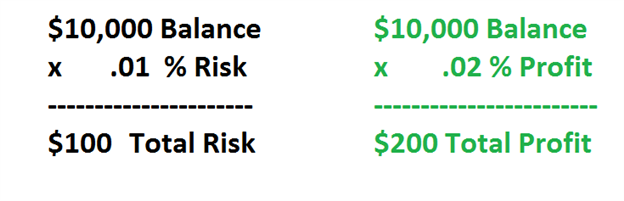
    While no one wants to experience a loss on their account, it is an inevitable part of scalping. Because of this, it is always important to have a plan of action to manage risk before entering into a trade. While placing a stop is important, traders should also consider the 1% rule. This means that traders should never risk more than 1% of their account balance on any one trading idea. That means using the math above, if you are trading a $10,000 account you should never risk more than $100 on any one positions.

    The 1% rule can also be coupled with a favorable risk reward ratio. Using a 1:2 setting, this means if we risk 1% in the event of a loss, at minimum we should look to close our trades out for a 2% profit. This would translate into a $200 profit on a $10,000 account balance. Now that you are familiar with the 1% rule, let’s look at our next risk management tip.
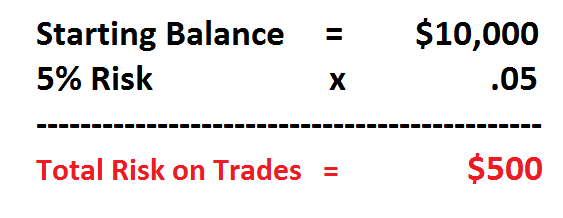


    The 5% Rule

    While no one wants to lose 1% of their account balance on any one trade idea, it is also beneficial to review the maximum exposure you have for your TOTAL account balance. The 5% rule reminds scalpers to never have more than 5% of their total account balance at risk across all trades. I also recommend this as a final cutoff point for trading. Meaning if you lose more than 5% in one day, it is probably best to call it quits and look to pick up trading again when the market is more favorable.

    To put this into perspective a scalper with a starting balance of $10,000 on 5 consecutive open positions, at 1% risk per trade , your balance would still have $9500 remaining at the end of the day. This is critical because even on your worst day, you can still come back tomorrow and pick up your trading strategy! Also this rule can prevent revenge trading and accruing even more losses.


    Risk Management

    To help traders control and manage their risk, programmers at FXCM have created a simple indicator to help decipher how much risk is being assumed on any one particular trade. Once added to Marketscope 2.0, the FXCM Risk Calculator, as depicted above, has the ability to help a trader calculate risk based off of trade size and stop levels.

    We walk through the application, as well as how to manage risk in several videos embedded into the brainshark medium. After clicking on the link below, you’ll be asked to input information into the ‘Guestbook,’ after which you’ll be met with a series of risk management videos along with download instructions for the application.

    This cncludes the 8th and final installment of The Definitive Guide to Scalping.I hope you have enjoyed this series, and if youhavemissed any of the previous editions of this scalping guide you can catch up on all the action with the previous articles linked below.

    The Definitive Guide to Scalping, Part 1: Market Conditions

    The Definitive Guide to Scalping, Part2: Currency Pairs
    The Definitive Guide to Scalping, Part 3: Time Frames
    The Definitive Guide to Scalping, Part4: Support & Resistance
    The Definitive Guide to Scalping, Part5: Scalping Ranges
    The Definitive Guide to Scalping, Part6: Scalping Retracements
    The Definitive Guide to Scalping, Part 7: Scalping Breakouts

    ---Written by Walker England, Trading Instructor

    More...

  2. #12
    member ForeCastle's Avatar
    Join Date
    Apr 2013
    Posts
    1,077
    Blog Entries
    236

    Who Can Trade a Scalping Strategy?

    Talking Points:

    • Scalpers look to trade session momentum
    • Scalpers do not have to be high frequency traders
    • Anyone can scalp with an appropriate trading plan


    The term scalping elicits different preconceived connotations to different traders. Despite what you may already think, scalping can be a viable short term trading methodology for anyone. So today we will look at what exactly is scalping, and who can be successful with a scalping based strategy.

    What is a Scalper?

    So you’re interested in scalping? A Forex scalper is considered anyone that takes one or more positions throughout a trading day. Normally these positions are based around short term market fluctuations as price gathers momentum during a particular trading session. Scalpers look to enter the market, and preferably exit positions prior to the market close.
    Normally scalpers employ technical trading strategies utilizing short term support and resistance levels for entries. While normally fundamentals don’t factor into a scalpers trading plan, it is important to keep an eye on the economic calendar to see when news may increase the market’s volatility.


    High Frequency Trading

    There is a strong misconception that all scalpers are high frequency traders. So how many trades a day does it take to be considered a scalper? Even though high frequency traders ARE scalpers, in order for you to qualify as a scalper you only need to take 1 position a day! That is one of the benefits of scalping. You can trade as much or as little as you like within a giving trading period.

    This also falls in line with one of the benefits of the Forex market. Due to the 24Hr trading structure of Forex, you can scalp the market at your convenience. Take advantage of the quiet Asia trading session, or the volatile New York – London overlap. Trade as much or as little as you like. As a scalper the choice is ultimately yours to make!


    Risks

    There are always risks associated with trading. Whether you are a short term, long term, or any kind of trader in between any time you open a position you should work on managing your risk. This is especially true for scalpers. If the market moves against you suddenly due to news or another factor, you need to have a plan of action for limiting your losses.

    There are other misconceptions that scalpers are very aggressive traders prone to large losses. One way to help combat this is to make scalping a mechanical process. This means that all of your decisions regarding entries, exits, trade size, leverage and other factors should be written down and finalized before approaching the charts. Most scalpers look to risk 1% or even less of their account balance on any one position taken!

    Who can Scalp?

    So this brings us to the final question. Who can be a scalper? The answer is anyone with the dedication to develop a trading strategy and the time to implement that strategy on any given trading day.

    ---Written by Walker England, Trading Instructor

    More...

  3. #13
    member ForeCastle's Avatar
    Join Date
    Apr 2013
    Posts
    1,077
    Blog Entries
    236

    Scalping with MACD

    Talking Points:

    • Scalpers should look to systematize their approaches and strategies.
    • Multiple Time Frame Analysis can help day-traders see ‘the bigger picture.’
    • Traders can use MACD to initiate positions in a day-trading approach.


    When a scalper begins their day, there are usually quite a few questions that need to be answered before ever placing a trade.

    What’s moving the market this morning?
    Which markets are most active?
    What drivers (or news) might come out to push the market further?
    Is my coffee ready yet?

    These are just a few examples… but suffice it to say that those who are day-trading in markets have quite a bit on their mind every single trading day.

    In this article, we’re going to look at how day-traders and scalpers can look to integrate MACD into their trading strategy.

    The Setup

    Before a scalper ever triggers a position they need to first find the appropriate market environment.

    For fundamental-based traders, Multiple Time Frame Analysis can be helpful; but more important is their outlook or opinion and the fact that that outlook or opinion should mesh with the ‘bigger picture’ view of what’s going on at the moment.

    For scalpers, the hourly and 4-hour charts carry special importance, as those are the ideal timeframes for seeing the bigger picture.

    After that, traders should look to diagnose the trend (or lack thereof).

    A great indicator for investigating trend strength is the Average Directional Index (ADX). Also popular for investigating trends is the Moving Average Indicator.

    In the below graphic using a 4-hour chart on GBPUSD, a 55 period Exponential Moving Average is being used as the ‘trend tool.’ If prices are above the moving average, the trader looks to only scalp to the long side (in the direction of the price relationship with the Moving Average). If prices are below the 55-period moving average on the 4-hour chart, then only short positions are investigated.

    Using a 55-period EMA as a ‘Trend Tool’ on the 4-hour Chart before looking for scalp-positions


    The Entry

    After the day-trader has found a promising setup, they then need to decide how to trigger into positions, and MACD can be a very relevant option for such situations.

    Because the trader already knows the direction they want to trade in, they merely need to wait for a corresponding signal via MACD to initiate the position.

    When MACD crosses up and over the signal line, the trader can look to go long.

    After a long position is triggered, the trader can look to close the position when MACD moves down and under the signal line (which is usually looked at as a sell signal, but because you did the ‘bigger picture analysis’ with the longer-term chart, this is merely a ‘close the long signal.’)

    Scalpers can trigger positions when MACD Signal takes place in direction of their bias


    On the other side of this equation: If the trader had determined the trend to be down on the longer-term chart or if their fundamental bias is pointing lower, they can look for MACD to cross down and under the signal line to trigger their short position.

    And once MACD crosses up and over the signal line, the trader can look to cover their short position.

    Scalpers can close positions when opposing MACD Signal takes place


    The Context

    The aforementioned approach can work phenomenally in a day-trading/scalping approach. But the fact-of-the-matter is that scalping profitably entails a lot more than just a trading plan, and an entry strategy.

    Risk management is the undoing of most new traders; and day-traders and scalpers fall victim to this susceptibility even more so than most.

    --- Written by James Stanley

    More...

  4. #14
    member ForeCastle's Avatar
    Join Date
    Apr 2013
    Posts
    1,077
    Blog Entries
    236

    Scalp Forex Breakouts with Pivot Points

    Talking Points:

    • Pivots can help easily identify support & resistance levels
    • Traders should monitor R4 and S4 values for breakouts
    • As with any strategy, identify areas to exit your position


    Trading breakouts is one of the most popular strategies available for scalpers. When a major level of support or resistance breaks, this momentum can provide scalpers opportunities to capitalize on new orders. Today we will look at scalping breakouts using camarilla pivot points. Lets begin!

    Scalping with Pivots

    Pivot points can be great ways to identify key levels of support and resistance for the day trader. There are many types of pivots we can use and in today’s example, we will use camarilla pivots added to today’s AUDUSD graph seen below. Key levels of resistance are denoted with a green line (R1-4) while key levels of support (S1-4) are denoted by a red line.

    In an uptrend, such as the AUDUSD chart below, traders will want to watch for a breakout above resistance. As R4 is the last line of resistance this line is an opportune place to look for potential market entries. Let’s look at a sample setup.

    Learn Forex: Support & Resistance with Pivots


    Breakout Entries

    Once you have identified support and resistance, it is time to plan your entry. The most common methodology of trading breakouts is to set entries to buy a currency pair, in an uptrend, when resistance is broken. As well, traders can look to sell levels of support in a downtrend as price breaks to lower lows. This can be done using entry orders to enter the market as soon as price moves beyond one of these values.

    Market orders can also be used to trade breakouts. This method is normally preferred by traders who have time to remain in front of their trading console and monitor their positions. Traders using market orders may often wait for one candle close to confirm a breakout prior to entering into their trade. Regardless of the entry method preferred, the objective is still the same.

    Learn Forex: AUDUSD Breakout


    Managing Risk

    The last portion of any active trading strategy is to manage risk. When using pivot points, these pricing levels become fairly intuitive. When buying a breakout over R4, trades can be managed by placing stops under the R3 value. In the event that prices begin mobbing back through earlier levels of resistance, traders will want to exit the market at the first available convenience.

    Once a stop has been placed, traders can then extrapolate their profit target. A simple methodology is to extrapolate a positive risk reward ratio of a traders choosing. This ensures in the event that the trade moves favorably profits are maximized, while cutting losing positions as quickly as possible.

    ---Written by Walker England, Trading Instructor

    More...

  5. #15
    member ForeCastle's Avatar
    Join Date
    Apr 2013
    Posts
    1,077
    Blog Entries
    236

    Time Scalping Entries With CCI

    Talking Points:

    • CCI is a momentum oscillator used for Overbought / Oversold values
    • CCI can be used in conjunction with a MVA to determine trading signals
    • Scalpers can time entries when momentum returns with the trend


    Timing entries is one of the most difficult parts of trading retracements in the trend. This is especially true for scalpers looking to take advantage of quick changes in price and momentum in the market. Normally an oscillator can be used to simplify this process and give traders a clear execution signal. Today we will review using the CCI (Commodity Channel Index) oscillator for scalping trends. Let’s get started!

    CCI and Overbought / Oversold Levels

    If you are already familiar with RSI, Rate of Change, or other oscillators you are one step closer to trading with CCI. Like many oscillators, CCI uses a mathematical equation to depict overbought and oversold levels for traders. Pictured below is CCI, which uses a +100 reading to indicator overbought conditions, while a reading below -100 represents an oversold level.

    Normally 70-80% of the values tend to fall between these points, which can be interpreted as buy or sell signals. As with other overbought/oversold indicators, this means that there is a large probability that the price will correct to more representative levels. Knowing this, trend traders will wait for the indicator to move outside of one of these points before reverting back in the direction of the primary trend. Let’s look at an example using the strong trend on the GBPCAD.

    Learn Forex –CCI Overbought / Oversold


    Timing a CCI Entry

    Below we can see an example using a 5minute GBPCAD chart. The currency pair is in an established uptrend with price remaining above a 200 period moving average. Knowing this, trend traders should look to initiate new buy positions. The primary way of timing entries with CCI in an uptrend is to wait for the indicator to move below -100 (oversold), and enter into the trade when CCI moves back above -100. This creates an opportunity to buy the currency as momentum is returning back in the direction of the trend. In the event you are trading a downtrend, the process can be reversed. Trades to sell can be timed as momentum pulls the indicator back beneath an overbought value.


    More...

  6. #16
    member ForeCastle's Avatar
    Join Date
    Apr 2013
    Posts
    1,077
    Blog Entries
    236

    The Scalpers Checklist

    • Always identify market conditions prior to trading
    • Your strategy and entries should reflect the market
    • Plan your risk and write your trades down to stay accountable


    Traders should have a checklist to consult prior to making any major trading decisions. These steps are critical for Forex scalpers as they often have to make these choices on a moment’s notice. To help with the process it can be helpful to keep a checklist and determine your options prior to approaching the market. Today we will review the scalper’s checklist. Let’s get started!

    Identify Market Conditions

    The first task assigned to day traders and scalpers is to identify market conditions. Is the market trending or ranging? Is the volatility of an asset low or high? These are both important questions that should be answered prior to entering into a new trade idea. Not only will this help Forex traders which currency pair to trade, but also help determine their strategy. Every scalper and day trader should check this off their list, prior to considering any market entries!


    Choose a Strategy

    Once market conditions are found, traders need to identify a strategy that is congruent with the market. If you are trading a trend, you will need to not only find market direction but also decide if you are going to trade a retracement, momentum or breakout strategy. In lack of a trend, traders again need to decide how to approach pricing patterns, support & resistance values, as well as potential breakouts. With so many strategies to choose from, it is worth taking your time and doing your due diligence prior to checking this off your scalping list.

    Plan Your Entry

    Next traders need to select how they are going to enter into the market. Typically traders need to first determine if they will trade with market orders or entry orders. Market orders allow you to trade immediately if conditions are met and you are immediately in front of your trading terminal. Entry orders can be used and will execute at a designated price even if you aren’t watching the market.

    Once this is decided, traders need to evaluate which indicators if any will be used for trading. In the event an indicator is added to the graph, prior to execution, plan on its use and know its strengths as well as limitations. When you are 100% certain on your entry triggers then you can proceed to the next portion of the checklist.

    Manage Risk

    This point of our check list goes beyond the simple placement of stop and limit orders. Scalpers must carefully consider how much they should risk on each trade. At this point specific questions should arise. How many pips are you risking per trade? What is your average profit target per trade? How does a stop order being executed equate to a loss on my account?

    While no trader wants to take a loss it is paramount to determine these values prior to scalping. Once these values are set, you can mark this point off your checklist. Now all you have left is to hold yourself accountable to your trading decisions.


    Log the Results

    Traders, especially short term scalpers, have a tendency to always be looking for the next trade. While looking for trading opportunities isn’t a bad thing, we should also remember to go back and review past events. Keeping a trading log can help us establish market patterns and reflect if your strategy is working in current conditions.

    To help with this process, traders should note, why, when and how they entered into a trade. If your strategy is working, stick with it and keep your original strategy rules. If you’re trading is not working out as planned, with a log you can identify what must be changed and make appropriate adjustments.

    While this checklist may seem daunting at first, these are all important steps to consider before scalping. To help you along the way, read through The Definitive Guide to Scalping. This is a great resource to review prior to tackling some of trading’s tougher challenges!

    The Definitive Guide to Scalping, Part 1: Market Conditions

    The Definitive Guide to Scalping, Part2: Currency Pairs
    The Definitive Guide to Scalping, Part 3: Time Frames
    The Definitive Guide to Scalping, Part4: Support & Resistance
    The Definitive Guide to Scalping, Part5: Scalping Ranges
    The Definitive Guide to Scalping, Part6: Scalping Retracements
    The Definitive Guide to Scalping, Part7: Scalping Breakouts
    The Definitive Guide to Scalping, Part8: Risk Management

    ---Written by Walker England, Trading Instructor

    More...

  7. #17
    member ForeCastle's Avatar
    Join Date
    Apr 2013
    Posts
    1,077
    Blog Entries
    236

    EURGBP Downtrend Momentum Increases

    Talking Points:

    • Scalpers should identify the trend
    • Short term momentum pinpoints direction
    • Based off of strength or weakness, traders can the plan entries


    For scalpers and day traders it is imperative to master identifying the market trend and momentum. The idea is that traders will sell in a downtrend, and buy in an uptrend when the market has the strongest likelihood of continuing in a singular direction. Today we will examine how you can identify these two components on your charts, while identifying one of the markets strongest trends. Let’s get started!

    Currently the EURGBP continues to be one of the markets strongest trending currency pairs. Taking a look at the 4Hour graph below, we can see the pair declining as much as 346 pips from its March high. Knowing this, scalpers should have a specific bias to sell the EURGBP. However, before traders consider new positions they should also review short term momentum to identify if price is retracing or moving with the trend.

    Learn Forex –EURGBP 4Hour Trend


    Market Momentum

    Rarely does the market head in one singular direction all of the time. That is why it is imperative to check and see if short term momentum is moving with the longer term trend. For this we can move into our 30 minute chart and identify the current direction of price. If price is heading in the same direction, traders may then consider taking new scalping positions. To help with this analysis we can turn to a series of pricing blocks. Let’s look at an example.

    Below we can see the current EURGBP 30 minute chart divided into two pricing blocks. Block 1 starts with last Wednesday and runs through Sunday June 8th. It should be noted that during this time frame, price indeed moved to a lower low, while declining as much as 59 pips. Knowing this, Block 2 can now be used to confirm the strength of the current downtrend. Block 2 does indeed form a lower low signaling the continuation of downward momentum. With both blocks pinpointing lower lows in the direction of the trend, traders can continue looking for fresh selling opportunities using the strategy of their choice.

    Learn Forex –EURGBP Trading Blocks


    Further Analysis

    To continue our analysis, traders should notice price is currently trading under the Block 2 low at .8063. This means that price has already moved to a lower low, and the next pricing block on the graph will also be painted red pending the absence of a higher high.

    ---Written by Walker England, Trading Instructor

    More...

  8. #18
    member ForeCastle's Avatar
    Join Date
    Apr 2013
    Posts
    1,077
    Blog Entries
    236

    Price Action in the Forex Market

    Talking Points:

    • Price action is the study of price movements in a market.
    • Many traders look at and use price action because it’s the cleanest view of technical analysis in a market.
    • In this article, we discuss the most basic relationship at the center of price action: Supply and Demand.

    One of the most difficult aspects of learning to trade is finding which systems, strategies, or indicators might work best given your personal goals in the market. Surely, there are quite a few choices out there and there are numerous different ways of going about speculation in a market; making this ‘journey’ to find a personalized approach even more difficult.

    Further exacerbating this issue is the topic of ‘lag,’ or the fact that any technical indicator that is used (or any strategy based around technical indicators) will be delayed in its responses. The reason for this is simple: To create an indicator, a series of past prices are used to compute its values which create a type of ‘averaging’ effect. This can be good in the fact that it can help to smooth out volatile events (after all, this is why people use moving averages in the first place), but it can be bad because this averaging effect (whether it’s with a moving average or RSI) introduces delays and lag to the trader.

    This is where price action can help. Price action is the study of price and price alone in a market, with no indicators required. With price action, traders can look to grade trends and market conditions, enter and trigger positions, and manage the risk of their trading operations.

    In this article, we’re going to examine the most basic premise that allows price action to work: Supply and Demand.

    The Most Basic Relationship in Markets: Supply and Demand

    One of the best aspects of price action is that it offers traders a clean depiction of supply and demand at any one point in a market. As mentioned above, the lag introduced by indicators can create dissonance in a number of ways, least of which is allowing this ‘averaging’ effect to obscure the relevancy of near-term price movements.

    Here’s an example: Imagine that we go into a Non-Farm Payrolls report and the USDJPY has been stuck in a tight trading range for the past 5 months. So moving averages on the daily, and the weekly chart are both moving flat to reflect this lack of vertical movement on the chart. But when NFP is released, we receive a ‘blow out’ figure that far eclipses even the most bullish analyst expectations.

    Once NFP is released and prices spike, do we still take into account the relevancy of the moving average values? Because surely the periods used in the calculation of that moving average before the NFP print are quite a bit less relevant than the periods since, given that there is now new information that can create additional supply or demand (and thereby create additional price movements).

    Supply and demand is at the core of price action.

    If there is more demand than supply – prices will go up. This isn’t just FX or financial markets or commodities: This is all-around us in the world we live in.

    Those Rolling Stone Tickets? Ya, they’re sold out at the box office so you have to pay exorbitant prices on Stubhub. (Demand has outstripped supply so prices go up as sellers can command a premium)

    And Rolling Stones ticket prices can be charted just like this hourly chart on USDJPY:


    Relating Supply and Demand to Trend Identification

    But it takes a lot more than just one instance of higher prices to denote a trend, right? Otherwise, we’re seeing an anomaly that may be irrelevant to our goals of analyzing a market. So we have to look at each of these price movements with relative scope.

    For a trend to take place, we need progressively higher (or lower) prices to continue for a prolonged period of time. Once we zoom out on the chart to see what this price spike means relative to previous price movements, we can get a significantly better view of what’s taking place in that market:

    Higher-highs and higher-lows highlight up-trend in the US Dollar 15-minute chart


    In the chart above, we take a look at an up-trend and as you can see, the market made progressively higher-highs and lower-lows over a prolonged period of time. We can reverse this relationship to investigate down-trends:

    Lower-lows and lower-highs accent down-trend in AUDUSD


    As you can see from the above charts, trend identification with price action is relatively simple, and maybe more importantly than that, it makes sense. Indicators can have a tendency to obscure the trend given the lag or disconnect involved, making them somewhat esoteric for many trader’s purposes.

    But a bigger question must be asked; and this is applicable to not just price action but Technical Analysis in general: Which time frame is best for grading the trend?

    As an example – if you look back to the second chart in this article, the US Dollar 15-minute chart, you’ll notice that the up-trend seems fairly robust. Higher-highs and higher-lows show prices tearing away on the 15-minute chart, but if you backed out to the weekly chart, you’ll notice a significantly different picture:


    This is the conundrum of time frames, and brings up the old saying ‘if you want to find a trend, just change the time frame.

    But which of these is the correct trend? And more importantly, which ones should traders follow? Think about these questions in scope of your personal approach, because there isn’t one ‘right’ answer here.

    There’s somewhat of a sweet-spot here: If your time frames are too far apart, then price action may feel disconnected between the trend and entry charts; if they’re too close together than you’ll lose some of the benefit of the analysis.

    In the article we proposed that traders should look for a ratio between 1:4 and 1:6 between time frames, as shown in the table below.


    This would mean that if you’re looking to enter trades on the hourly chart, you can use the 4-hour chart to see the bigger picture trend. If you’re using the daily chart to enter positions, you can look to the weekly for trend analysis.

    --- Written by James Stanley

    More...

  9. #19
    member ForeCastle's Avatar
    Join Date
    Apr 2013
    Posts
    1,077
    Blog Entries
    236

    The Power of Wicks in the FX Market

    Talking Points:

    • This article is an extension in our series on the topic of Price Action.
    • In our last article, we saw how supply and demand can be seen via the study of price.
    • In this article, we take this a step further in looking at intra-candle dynamics.

    Price action can give traders a clear and concise view of supply and demand at any one point-in-time. This can be extremely important for finding new trends, locating potential reversals, and those beautiful situations in which traders can confidently look to ‘buy low’ in an up-trend or to ‘sell high’ in a down-trend.

    But this is just scratching the surface of what traders can do with price action analysis…

    In this article, we’re going to delve deeper into the topic of supply and demand via price action. We’re going to look at how traders can identify swings and potential points of entry using price action analysis.

    The Secret Messages of Price Action

    Increasing demand in a market will generally be met with higher prices. It doesn’t really matter how or why that demand increased, the very act of more buyers entering the market means that sellers can command a higher price.

    As prices rise, sellers are more incentivized to sell. This creates price swings in the market (notice the two red boxes inside of the larger blue box in the below chart).


    Eventually, prices rise to a level at which sellers take control of the market… but not only are more sellers entering the market to initiate new short positions, but buyers are more hesitant to chase these new higher prices. This is what creates resistance in a market (noted on the above chart with the black line at 1.7175 on GBPUSD).

    This is the beauty of price action: It gives the trader an accurate depiction of supply and demand at any one point-in-time to offer the cleanest view of that particular market. But how can this proactively be used in a trading approach?

    The Power of the Wick

    We can take these ‘messages’ via price action to the next logical step: locating points of emphasis within a single candlestick or a series of candlesticks to find areas of interest for potential trade entries.

    Since price action can show us supply and demand, the act of a market showing an elongated wick can highlight reversal potential. Let’s look at an example below.

    After an extended run from 1.6700, GBPUSD continued to rally to new six-year highs. That is, until the market traded into 1.7175; at which point sellers came in to move prices lower (indicated by the red box). Sellers controlled the market all the way down to 1.7100, at which point buyers came in to offer support (highlighted by the yellow circle).

    This wick highlights reversal potential. It shows traders that during this candle’s formation; prices ran all the way down to previous support of 1.7100; and then buyers came into the market to bring prices higher (which creates the wick on the bottom-side of price action).


    This is evidence of buyers entering to take advantage of a ‘perceived value’ in the market, as a previously hot-running trend is now cheap with prices at support.

    This shows traders that prices may continue running higher after this inflection with support, and that a long entry may be possible.

    Why are Wicks so Important?

    Wicks are a pivotal part of price action analysis (pun intended) because they show us potential price reversals at the very earliest stage, while also validating support and resistance levels in the market.

    Imagine this on a granular scale using the GBPUSD setup we had looked at previously.
    After setting six-year highs, prices began retracing as long position-holders closed positions to take profits off-the-table while sellers came into attempt to trade a reversal off of 1.7175. This is what created the retracement in the red box.

    But once we get to the previously-established support level of 1.7100, something changes… more buyers enter the market to push prices even higher above 1.7100.

    Once this hourly candle had closed, a long wick is showing on the bottom side of price action – indicating that the retracement in GBPUSD may be over and that price may begin moving higher.

    The trader can use this to identify a defined-risk play… meaning that should prices continue moving higher; this low should hold as up-trends show higher-highs, and higher-lows. If prices don’t continue trending higher, this allows the trader to close the position quickly; before they find themselves on the wrong side of a trend.


    Long wicks validate support and resistance, and allow the trader to define their risk in any entries that may be taken in the market.

    --- Written by James Stanley

    More...

  10. #20
    Administrator newdigital's Avatar
    Join Date
    Feb 2013
    Posts
    10,473
    Blog Entries
    2909
    Follow newdigital On Twitter Add newdigital on Facebook Add newdigital on Google+ Add newdigital on MySpace
    Add newdigital on Linkedin

    The Definitive Guide to Scalping, Part 6: Scalping Retracements

    • When markets pullback from the trend consider trading retracements
    • Traders can time entries at support and resistance using oscillators
    • Manage risk over previously market swing highs or lows

    Scalpers have a variety of choices when it comes to an execution strategy. This decision should be decided after carefully evaluating current market conditions for the currency pair of their choosing.

    Today to continue the Definitive Guide to Scalping, we will focus on trading retracements and pullbacks in price from the primary trend.

    Learn Forex – USDCHF retraces in a downtrend

    The Definitive Guide to Scalping-s1.png


    Trading a Retracement

    As a retracement trader our first task is to identify the trend. This can be done through a variety of methods mentioned in the 2nd installment of the Definitive Guide to Forex Scalping. In the event that price is trending downwards, retracement traders will look to sell the market after price retraces, which means the market has moved temporarily against the primary trend. Likewise in the event that price is trending upwards, traders would wait for prices decline before buying towards a higher high. Above we can see a series of retracements on the USDCHF currency pair offering selling opportunities.

    Once a retracement is found, it’s time to begin planning where to enter the market. The easiest way to do this is to place entry orders near a converging level or either support (to buy in an uptrend) or resistance (sell in a downtrend). Below we have an example of this technique in practice. Displayed you can see resistance in the form of a trendline as well as a 78.6% Fibonacci retracement line. Traders can look to sell the market at this point near .9035. Risk should be monitored above resistance to close positions in the event of a price breakout, and finally profit targets should be set towards lower lows.

    Learn Forex – USDCHF Support & Resistance

    The Definitive Guide to Scalping-s2.png


    Retracements with Oscillators

    Traders can also choose to enter retracements through the use of an oscillator. Similar to trading a range should wait for price to reach a key level of support or resistance prior to considering an entry. Once this occurs, traders can turn to an indicator such as MACD, CCI, or RSI to time their entry. In a downtrend, such as the $USDCHF example depicted above, traders will wait for momentum to return to the downside prior to entering in the market.

    Trading with an oscillator can potentially help trader’s better find market momentum returning back in the direction of the primary trend. Below we can again see the USDCHF 30 minute chart, but this time the RSI indicator has been added to the graph. Price has moved off of resistance, but oscillator traders will wait for RSI to close below an overbought value prior to entering into the market. Once a trade is placed we should again evaluate our positions exits. Even when trading with a confirming oscillator a stop should be used!

    Learn Forex – USDCHF & RSI Oscillator

    The Definitive Guide to Scalping-s3.png


    Overall, trading retracements is an exciting way to approach scalping. It should be noted however that retracement trading is all about timing and may not be for everyone! The key to retracement strategies starts with becoming comfortable at pinpointing pullbacks in the market and managing risk appropriately.
    Premium Trading Forum: subscription, public discussion and latest news
    Trading Forum wiki || MQL5 channel for the forum
    Trading blogs || My blog

Page 2 of 5 FirstFirst 1 2 3 4 ... LastLast

Tags for this Thread

Bookmarks

Posting Permissions

  • You may not post new threads
  • You may not post replies
  • You may not post attachments
  • You may not edit your posts
  •