Page 8 of 9 FirstFirst ... 6 7 8 9 LastLast
Results 71 to 80 of 90
Like Tree1Likes

How to Build and Trade Strategies

This is a discussion on How to Build and Trade Strategies within the Trading Systems forums, part of the Trading Forum category; Crude Oil prices have declined to test a daily value of support near today’s low of $46.26. This price decline ...


  1. #71
    member ForeCastle's Avatar
    Join Date
    Apr 2013
    Posts
    1,077
    Blog Entries
    236

    Crude Oil Price Forecast: Bounce or Breakout?

    Crude Oil prices have declined to test a daily value of support near today’s low of $46.26. This price decline has been predicated on some OPEC members hinting that they may be unwilling to cut production going into a meeting in Vienna later this month. This news has left many Oil traders sidelined, as prices may be prepared to bounce higher or breakout lower at current levels.

    How to Build and Trade Strategies-brn-h4-alpari-limited.png


    Alternatively, GSI has indicated that prices have risen by $0.48 or more in 56% percent of the 37 identified historical events. A bounce in price to $46.93 could be seen as the beginning of a retracement or a reversal of this morning’s decline. Traders looking for further confirmation of a bullish reversal, may elect to wait for Crude Oil prices to move through the final historical bullish distribution found at a price of $47.53.

    more...
    Premium Trading Forum: subscription || The Forex Guide to Fundamentals Fundamentals
    Trading blogs || My blog

  2. #72
    member ForeCastle's Avatar
    Join Date
    Apr 2013
    Posts
    1,077
    Blog Entries
    236

    Copper Prices Get a Boost From Lows

    Copper prices are beginning to rebound, after dropping off from 2016 highs of $2.7333 per pound. Currently the metal is experiencing a 2 day rally which has pushed Copper as high as $2.5709, and back over daily resistance of $2.4930. While this week’s trading is expected to be quite, traders should continue to monitor points of support and resistance to determine if Coppers trend is again picking up momentum.

    In the event that Copper prices continue to rally, traders should next look for the metal to test $2.5929. This area is considered a point of technical resistance, and is represented in the graph as the November 14th high. A rally through this point, would then open Copper up to testing psychological points of resistance such as $2.6000 and $2.6500 before challenging standing yearly highs.

    How to Build and Trade Strategies-copper-h4-halifax-investment-services-2.png

    (created using Metatrader 5)

    In the event that the current rally fades, traders should watch for Copper to turn below today’s standing high. The first value of support that traders should watch for is $2.4432, followed by $2.4210. This last point represents the November 15ht low, and a move beyond this point would suggest that Copper prices are prepared to fall further.
    In the event of a bearish reversal, traders should consider that Copper may yet fall back below $2.3007. This area remains a critical swing in the commodities ongoing multiyear downtrend. If Copper trades back below $2.3007, it would suggest that a longer term bearish trading pattern is in development.

    more...
    Premium Trading Forum: subscription || The Forex Guide to Fundamentals Fundamentals
    Trading blogs || My blog

  3. #73
    member ForeCastle's Avatar
    Join Date
    Apr 2013
    Posts
    1,077
    Blog Entries
    236

    AUD/USD Opens Trading to New Highs

    The AUD/USD has started Tuesday’s trading breaking out to a new 2017 high at .7384. However, the pair was quickly rejected by resistance found at a 61.8% retracement value at .7385. As seen in the image below, this retracement has been measured using the distance between the December 2016 high and low, found at.7524 and .7159 respectfully. If prices continue to trade beneath this value, it may suggest a daily turn back in the direction of the pairs primary trend. Alternatively if the AUD/USD rebounds intraday, it may suggest that the pair may make an attempt to reach the next point of resistance found at .7446.

    AUD/USD Daily Chart & Fibonacci Retracement Values

    How to Build and Trade Strategies-audusd-d1-alpari-international-limited.png


    How to Build and Trade Strategies-audusd-w1-alpari-international-limited.png


    Intraday, the AUD/USD first turned overnight at resistance found at the R3 Camarilla pivot at .7375. Now after an early morning decline, the pair is finding support against the S3 pivot at .7325. This movement suggests that the AUD/USD is trading in a range bound environment going into the opening of US Session trading. If prices continue to bounce between these points, traders may continue to look for range trading opportunities between these values.

    In the event that range bound conditions end, bullish breakouts may be sighted above the R4 pivot at .7399. A bullish breakout here would suggest a continuation of last week’s trend, and traders may begin to target higher highs. Initial targets may be found at .7449 by extrapolating a 1X extension of today’s 50 pip range. Alternatively in the event that the AUD/USD trades lower, bearish breakouts may begin under .7300. Again using a 1X extension of the range, initial bearish targets may be found near .7250.

    more...
    Premium Trading Forum: subscription || The Forex Guide to Fundamentals Fundamentals
    Trading blogs || My blog

  4. #74
    member ForeCastle's Avatar
    Join Date
    Apr 2013
    Posts
    1,077
    Blog Entries
    236

    Crude Oil Prices Poised For A Breakout

    Crude oil prices continue to trade off of yearly highs, but have failed to breakout significantly for the 2017 trading year. As such, traders continue to wait for a market catalyst to cause the commodity to breach key values of either support or resistance. Key news for this week includes the release of US employment data this Friday. Expectations for US NFP (Feb) is set at +190k, while the US Unemployment Rate is set to be released at 4.7%.

    How to Build and Trade Strategies-brentcrud-d1-fx-choice-limited.png


    Technically the price of crude oil remains in an ongoing daily trading range, which is depicted below. Current daily resistance remains located at the January 3rd 2017 peak at $55.67. Alternatively, crude oil prices remain supported above the January 10th low at $51.34. As prices continue to ping between these values, traders may continue to reference these points for a potential market breakout.


    more...
    Premium Trading Forum: subscription || The Forex Guide to Fundamentals Fundamentals
    Trading blogs || My blog

  5. #75
    member ForeCastle's Avatar
    Join Date
    Apr 2013
    Posts
    1,077
    Blog Entries
    236

    Momentum and Moving Averages

    Finding the direction of current market momentum is an important step for trend traders. Moving averages are a unique tool that help traders to just that on a variety of charts and time frames. A 200 period MVA (simple moving average) is often employed for this task, with traders looking to see if prices are currently above or below the average. If prices are trading above the 200 period MVA, the trend and market momentum may be interpreted as rising. As well if prices are below the average, this may be interpreted as a declining market.

    How to Build and Trade Strategies-eurusd-m15-alpari-international-limited.png


    Often times, one line of reference may not be beneficial to a trader. To get a more complete look at momentum, traders may employ a series of MVA’s. Typical averages include the 20,50, and 200 period MVA’s. While the settings of the averages can be changed, traders should consider having a short, mid, and long term MVA for reference. In an uptrend, the shortest moving average should reside above the mid and long term lines. Alternatively in a downtrend, the short term average should be below both the mid and long term lines.

    Lastly, once traders are familiar with traditional averages, traders may expand their knowledge base to include other interpretations of moving averages. EMA’s (Exponential moving average) are similar to traditional MVA’s, however these lines are weighted. This means EMA’s are more sensitive to change in present market price than traditional MVA’s. Their sensitivity makes them a great tool for finding short term shifts in momentum on longer term charts.

    more...
    Premium Trading Forum: subscription || The Forex Guide to Fundamentals Fundamentals
    Trading blogs || My blog

  6. #76
    member ForeCastle's Avatar
    Join Date
    Apr 2013
    Posts
    1,077
    Blog Entries
    236

    Becoming a Better Trader – Principles of Risk Management (Video)

    Risk management is paramount to success


    Risk management is one of the most important aspects to successful trading, but far too often it’s overlooked. Job #1 for a trader is to always keep yourself in the game. A sound strategy and the discipline to follow it will go long way towards ensuring you stick around.

    If you are in the learning stage, your objective is to keep losses very small until you figure out what you are doing from an analytical and strategy standpoint. Adhering to sound risk parameters early-on will go a long way towards building a foundation for later on.

    For the more seasoned trader, your goal is to avoid digging unnecessary holes and of course avoiding the risk of ruin. Maybe you have a workable strategy, but perhaps are inconsistently applying rules related to risk management which are impacting your ability to grow.

    Individual trade management

    How much capital you risk on a trade is dependent on your own risk tolerance. This varies from trader to trader, and is vital that you trade with a size which doesn't impede your ability to make good decisions. Trading with too much size is often times the culprit for poor didscipline in seeing a trade through as planned.

    Trading size based on percentage at risk

    First off, it's a good idea to think in relative terms rather than absolute. Think of what percentage of capital you want to risk, not how many pips or points. Your trading size will be dynamic when taking this approach. Let’s say you risk 1% per trade, the trade size will be twice as large on a trade with a 50 pip stop versus a trade where the stop is 100 pips away. If you keep your trading size dynamic in this case your risk will stay the same. If, however, you think in terms of fixed lot sizes, then over time the risk will vary and so will your results.

    For example, let’s assume you have an average win/loss ratio of 1:2. If you risk 50 pips on trade #1 and make 100 pips (2x risk), then you will be ahead by 100 pips. But on trade #2 you risk 100 pips and it hits your stop, you will lose 100 pips. This will result in a net of 0 between the two trades if you trade in absolute lots sizes.

    Your 'risk-per-trade' should be in a relatively tight range

    You want to be consistent with the risk-per-trade. You don’t want to risk 0.5% on one idea, then 3% on the next, then 1% after that, and so on. Like with using fixed lot sizes, your results will be all over the map. Perhaps you are extremely confident on an idea and want to risk a little more than usual, that is fine as long it doesn’t vary too greatly from your normal trading size. Typically, good set-ups don’t have as much of a variance in probability of success from one to the next as one might think.

    A high win percentage shouldn’t be the primary goal


    Your primary goal should be to find trades which give you an edge and offer an asymmetrical risk profile. Risk/reward should be around 1:2 or better. Too many traders get hung up on having a high win percentage, which is understandable to a degree – people don’t like to lose, but that is part of the game. It is better to have a 30% win rate with a 1:5 R/R ratio, than a 60% win rate with a R/R ratio of 1:1.

    Factors pertinent to determining trade size


    When determining how much to risk on a trade, you have to consider the fact that you will inevitably have a string of losers, and how long that string will be is often dependent on your trading style. For example, breakout/momentum strategies typically have lower win rates, but high risk/reward ratios. On the other hand, a range or mean reversion strategy will have a higher win rate, but lower risk/reward profiles.

    Hard stops are prudent


    A ‘hard stop’ is simply a stop-loss which is entered in to the trading system, versus a ‘soft stop’ where you have a pre-determined level in mind that you will exit should it get triggered. Three reasons to use a 'hard' stop. One, you don’t need to be sitting in front of your screen all the time, or when away wondering what is going on with your position. Two, there is an element of discipline instilled by having that ‘line-in-the-sand’ drawn ahead of time. Three, you never know when an unforeseen event will happen and you are caught holding the bag.

    Account risk management


    Risk-per-trade is just one element to a good risk management plan. You also need to protect the overall account by considering a couple of factors. These obviously circle back around to per-trade-risk, but from the perspective of looking at the whole.

    Take into consideration correlated positions


    This is an overlooked factor which can sneak up on a trader quickly if not careful. If you are trading several currency pairs or markets which are highly correlated, trading size per position needs to be adjusted to reflect such.
    For example, if you have on 3 JPY pairs which are in the same direction, then it is prudent to treat that as one position and assume all three positions could hit their respective stops. The same goes for negatively correlated markets, such as the dollar and gold. If the two are trading in opposing directions (which often times they are) and you are, say, long the dollar and short gold, then the risk of the two moving favorably or unfavorably together is high. Again, you want to consider the total risk attached to that theme.

    Have a maximum drawdown number in mind

    When trading isn’t going well, at what point over a period of time do you temporarily pull the plug? You need to set a limit as to how much is too much. Drawdowns are an inevitable part of trading and understanding how to handle them is crucial to maintaining your account equity. This, like trade size, varies from trader to trader. Is it 10, 15, 20%? That point where you say, “You know what, I need to take a step back.”

    Trading around high impact fundamental events

    For existing positions, if based on technical analysis, then holding around a major announcement is pretty standard. Just make sure to have your protective stop in place and adhere to it. If the event is very near and a trade triggers, you may want to consider holding off until after the event, or at least reduce your trade size.

    more...
    Premium Trading Forum: subscription || The Forex Guide to Fundamentals Fundamentals
    Trading blogs || My blog

  7. #77
    member ForeCastle's Avatar
    Join Date
    Apr 2013
    Posts
    1,077
    Blog Entries
    236

    Day Trading the Dow Jones: the strategies

    The Dow Jones Industrial Average is the second-oldest stock index in existence, started in May of 1896 by Charles Dow and Edward Jones. Dow was an editor at the Wall Street Journal at the time, and his associate Edward Jones was a statistician looking for a simpler method of tracking market performance. The duo had created the Dow Jones Transportation Index in 1886 largely based around railroads, but as the US economy was becoming more industrialized they sought out a better way to gauge overall market performance and designed the Dow Jones Industrial Average around 30 industrial stocks. In the years since, the composition of the index has changed and that industrial connotation no longer applies as the index contains tech companies like Apple, IBM and Intel along with pharmaceutical companies like Merck and Pfizer.

    How to Build and Trade Strategies-us30index-d1-fx-choice-limited.png


    As a result of the Dow Jones Industrial Average tracking 30 of the largest, most established companies in the US economy, the index remains attractive for those looking to focus on larger blue chip stocks. This can be attractive when trends display themselves across an asset class, such as we've seen over the past nine years in stocks out of the United States since the Global Financial Collapse. This can help traders glean a bias in a market, so that shorter-term day trading strategies can be focused in the direction of the prevailing trend.

    One common way that traders measure or grade trends is with the 200 Day Moving Average. This is simply a 200-period moving average applied to the Daily chart, and when prices are above this level, traders can look at bullish strategies on shorter-term trading setups. Conversely, when prices cross-below this level, traders can then begin to look at bearish strategies under the expectation that prices may continue-lower.

    As a general rule, traders should look to cut their losses short while letting their winners run, and this remains the case whether it's a longer-term strategy, or a shorter-term day trading approach.

    more...
    Premium Trading Forum: subscription || The Forex Guide to Fundamentals Fundamentals
    Trading blogs || My blog

  8. #78
    member ForeCastle's Avatar
    Join Date
    Apr 2013
    Posts
    1,077
    Blog Entries
    236

    The History of Forex

    The barter system is the oldest method of exchange and began in 6000BC, introduced by Mesopotamia tribes. Under the barter system goods were exchanged for other goods. The system then evolved and goods like salt and spices became popular mediums of exchange. Ships would sale to barter for these goods in the first ever form of foreign exchange. Eventually, as early as 6th century BC, the first gold coins were produced, and they acted as a currency because they had the critical characteristics like portability, durability, divisibility, uniformity, limited supply and acceptability.

    Gold coins became widely accepted as a medium of exchange, but they were impractical because they were heavy. In the 1800s countries adopted the gold standard. The gold standard guaranteed that the government would redeem any amount of paper money for its value in gold. This worked fine until World War I where European countries had to suspend the gold standard to print more money to pay for the war.

    The forex market was backed by the gold standard at this point and during the early 1900s. Countries traded with each other because they could convert the currencies they received into gold. The gold standard, however, could not hold up during the world wars.

    more...
    Premium Trading Forum: subscription || The Forex Guide to Fundamentals Fundamentals
    Trading blogs || My blog

  9. #79
    member ForeCastle's Avatar
    Join Date
    Apr 2013
    Posts
    1,077
    Blog Entries
    236

    What is Margin Call in Forex

    Margin and leverage

    In order to understand a forex margin call, it is essential to know about the interrelated concepts of margin and leverage. Margin and leverage are two sides of the same coin.Margin is the minimum amount of money required to place a leveraged trade, whileleverage provides traders with greater exposure to markets without having to fund the full amount of the trade. It’s important to remember trading with leverage involves risk and has the potential to produce large profits as well as large losses.

    What causes a margin call in forex trading?

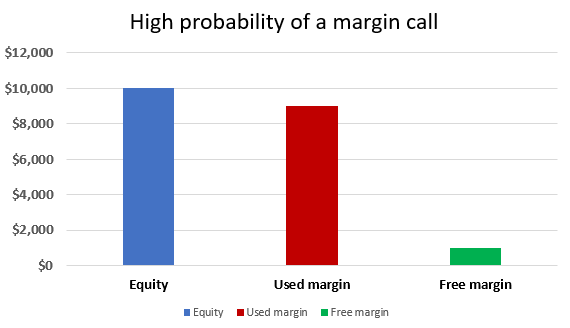
    A margin call is what happens when a trader no longer has any usable/free margin. In other words, the account needs more funding. This tends to happen when trading losses reduce the usable margin below an acceptable level determined by the broker.
    Below are the top causes for margin calls, presented in no specific order:

    • Holding on to a losing trade too long which depletes usable margin
    • Over-leveraging your account combined with the first reason
    • An underfunded account which will force you to over trade with too little usable margin
    • Trading without stops when price moves aggressively in the opposite direction.

    What happens when a margin call takes place?

    When a margin call takes place, a trader is liquidated or closed out of their trades. The purpose is two-fold: the trader no longer has the money in their account to hold the losing positions and the broker is now on the line for their losses, which is equally bad for the broker. It is important to know that leverage trading brings with it, in certain scenarios, the possibility that a trader may owe the broker more than what has been deposited.


    How to avoid margin call?

    Leverage is often and fittingly referred to as a double-edged sword. The purpose of that statement is that the larger leverage a trader uses – relative to the amount deposited - the less usable margin a traderwill have to absorb any losses. The sword only cuts deeper if an over-leveraged trade goes against a trader as the losses can quickly deplete their account.
    When usable margin percentage hits zero, a trader will receive a margin call. This only gives further credence to the reason of using protective stopsto cut potential losses as short as possible.


    more...
    Premium Trading Forum: subscription || The Forex Guide to Fundamentals Fundamentals
    Trading blogs || My blog

  10. #80
    member ForeCastle's Avatar
    Join Date
    Apr 2013
    Posts
    1,077
    Blog Entries
    236

    Hammer Candlestick Patterns: A Trader’s Guide

    The hammer candlestick pattern is frequently observed in the forex market and provides important insight into trend reversals. It’s crucial that traders understand that there is more to the hammer candle than simply spotting it on a chart. Price action and the location of the hammer candle, when viewed within the existing trend, are both crucial validating factors for this candle.

    What is a Hammer Candlestick?

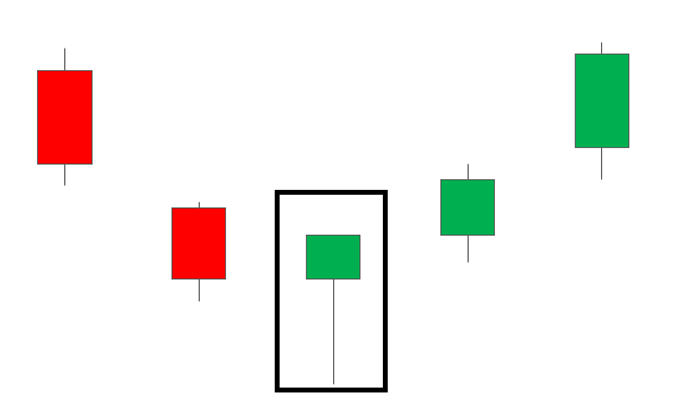
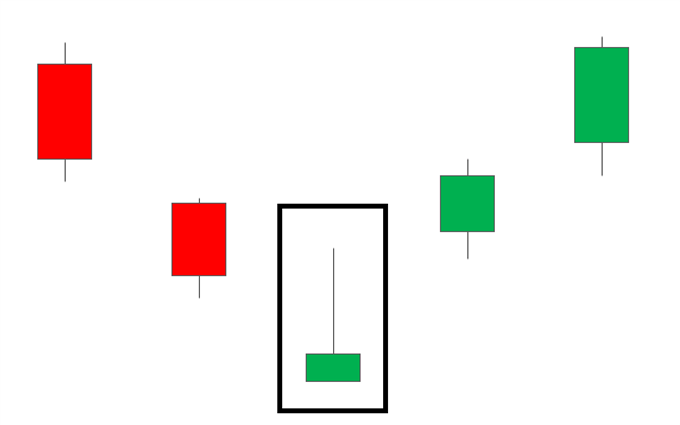
    The hammer candlestick is found at the bottom of a downtrend and signals a potential (bullish) reversal in the market.The most common hammer candle is the bullish hammer which has a small candle body and an extended lower wick – showing rejection of lower prices.The other pattern traders look out for is the inverted hammer, which is an upside-down bullish hammer.

    Bullish Hammer Candlestick

    The hammer candlestick appears at the bottom of a down trend and signals a bullish reversal. The hammer candle has a small body, little to no upper wick, and a long lower wick - resembling a ‘hammer’.
    The pattern indicates that the price dropped to new lows, but subsequent buying pressure forced the price to close higher, hinting at a potential reversal. The extended lower wick is indicative of the rejection of lower prices.
    Inverted Hammer Candlestick

    The inverted hammer candlestick, like the bullish hammer, also provides a signal for a bullish reversal. The candle is, as the name suggests, an inverted hammer. The candle has a long extended upper wick, a small real body with little or no lower wick.
    The candle opens at the bottom of a downtrend before the bulls push price upwards – reflected in the extended upper wick. Price does eventually return down towards the opening level but closes above the open, to provide the bullish signal. Should the buying momentum continue, this will be seen in the subsequent price action moving higher.
    Advantages and Limitations of the Hammer Candlestick

    Hammer candles have their advantages and their limitations; therefore, traders should never rush into placing a trade as soon as the hammer candle has been identified.
    Advantages

    • Reversal signal: The pattern indicates the rejection of lower prices. When found in a downtrend it could signal the end of selling pressure and begin to trade sideways or reverse to the upside.
    • Exit signal: Traders that have an existing short position, can viw the hammer candle as an indication that selling pressure is subsiding - presenting the ideal time to close out of the short position.

    Limitations

    • No indication of trend: The hammer candle does not take the trend into consideration and therefore, when considered in isolation, can provide a false signal.
    • Supporting evidence: In order to enter into high probability trades, it is important for traders to look for additional information on the chart that supports the case for a reversal. Such confluence can be found by assessing whether the hammer appears near a major level of support, pivot point, significant Fibonacci level; or whether an overbought signal is produced on the CCI, RSI or stachastic indicator.

    more...
    Premium Trading Forum: subscription || The Forex Guide to Fundamentals Fundamentals
    Trading blogs || My blog

Page 8 of 9 FirstFirst ... 6 7 8 9 LastLast

Tags for this Thread

Bookmarks

Posting Permissions

  • You may not post new threads
  • You may not post replies
  • You may not post attachments
  • You may not edit your posts
  •