Page 1 of 9 1 2 3 ... LastLast
Results 1 to 10 of 90
Like Tree1Likes

How to Build and Trade Strategies

This is a discussion on How to Build and Trade Strategies within the Trading Systems forums, part of the Trading Forum category; How to Build and Trade a Trend-Following Strategy Talking Points: Traders should look to match their strategy with the appropriate ...


  1. #1
    member ForeCastle's Avatar
    Join Date
    Apr 2013
    Posts
    1,077
    Blog Entries
    236

    How to Build and Trade Strategies

    How to Build and Trade a Trend-Following Strategy

    Talking Points:

    • Traders should look to match their strategy with the appropriate market condition.
    • Trends can be attractive since a bias has been witnessed in that particular market.
    • In this article, we show how traders can begin to develop their own trend-trading strategy.

    To anyone trading in markets, it’s often advisable to have a strategy of some type to go about doing it.

    After all, just ‘guessing’ isn’t likely going to work out too well for anyone speculating in markets over the long run. Having some idea for the type of situation one is looking for can be extremely helpful. With a strategy, traders can look to focus on situations in which the market may be giving them the best probabilities of success.

    After discovering the necessity of a strategy, traders will often go on to seek the ‘best’ strategy that they can find. This can be an elongated process for some folks, as many traders are often looking for something that doesn’t exist: They’re looking for the strategy that rarely (or never) loses.
    This just doesn’t exist.

    Regardless of how strong a strategy ever might be, it will never be 100% predictive of market movements. The future is opaque with or without a strong strategy. A good strategy can simply allow the trader to focus on higher-probability setups and situations in an effort to win more money than they lose; so that they may be able to net a profit.

    Markets will often exhibit one of three different conditions, and traders are often best served by matching their strategy with the appropriate market condition.

    In this article, we’re going to focus on the most popular condition: Trends.

    Trend Trading

    Of the three possible market conditions, trends are probably the most popular amongst traders; and the reason for that is what we had alluded to a little earlier.

    The future is opaque, and price movements are unpredictable. By simply recognizing a trend, the trader has noticed a bias that has shown itself in the marketplace. Maybe there is improving fundamental data for that economy; or perhaps it’s a central-bank driven move on the back of ‘Yen-tervention’ or another round of QE.

    Trend Trading


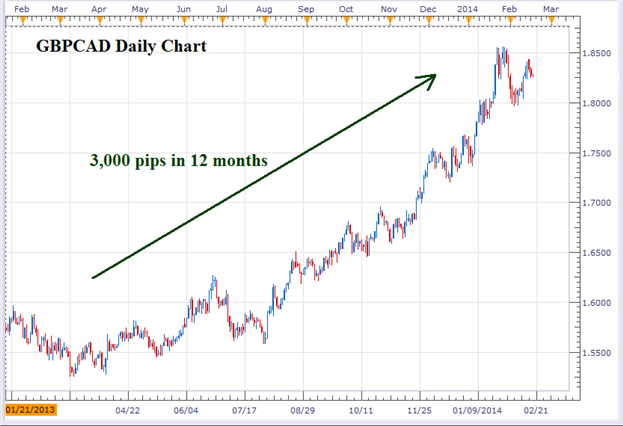
    Whatever the reason, a bias exists in the market and that’s visible from the trajectory on the chart. The alluring part of this is that if that bias continues, the trader might be able to jump on the trend, and let the market do the heavy lifting of moving the position into profitable territory.
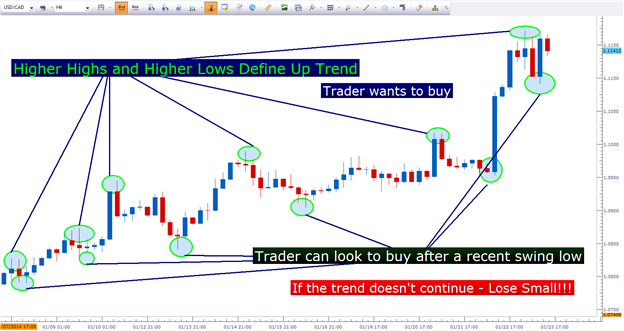
    Another attractive aspect of trading with trends is that the speculator can look to employ the age-old logic of ‘buy-low, sell-high.’ It’s not enough to simply buy an up-trend, or to sell a down-trend. Traders are often best served by waiting for the up-trend to pull back before buying (or waiting for a down-trend to rip higher before selling), in an effort to enter the position as cheaply as possible.

    This way, if the trend doesn’t continue, the trader can exit the position quickly before the loss becomes too unbearable. But if the trend does continue, the trader might be able to profit by three, four, or five times the amount they had to initially risk to enter the trade.

    How to Build a Trend Strategy

    Many of the most popular indicators can be helpful when designing a trend strategy. And to take technical analysis a step further when designing a trend-trading approach, many traders will look to utilize multiple time frame analysis in order to get multiple looks at a trending market.

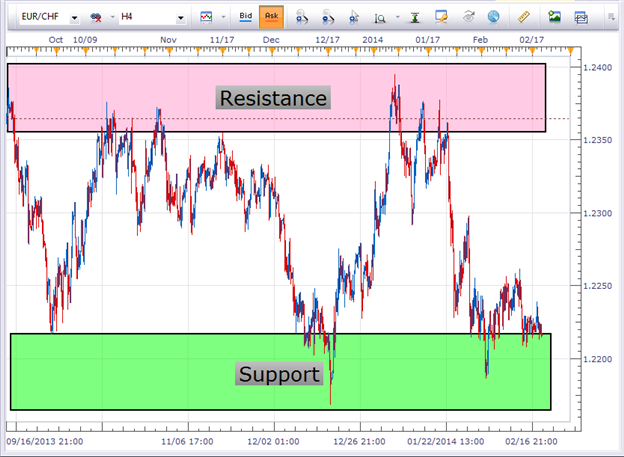
    When utilizing multiple time frame analysis with a trend-trading strategy, traders are often going to look to the longer time frame to find and diagnose the strength of the trend. This can be done in a multitude of ways. Some traders will prefer to do this without any indicators at all, using price and price alone.

    Other traders will look to one of the more common indicators, the moving average. There are a lot of different flavors and types of moving averages, but the goal is all the same – to show us a ‘line-in-the-sand’ as to whether price movements are ‘above-average’ or ‘below-average’ for a given period of time.

    Moving Averages can help traders diagnose and trade trends


    After the trend has been diagnosed, the trader can then plot the entry into the position; and for that, there are a multitude of options available.

    Entering into the Trend

    There is an old saying that goes: ‘The Trend is your friend… until it ends.’

    This one line pretty much sums up the quandary that traders are faced with when trading trends. While a bias has been exhibited in the marketplace, and may continue; there is no such thing as a ‘sure-fire trend continuation setup.’

    So, when the trend doesn’t continue, the trader is often advised to look to mitigate the loss so that a reversal doesn’t damage their trading account too badly.

    In an effort to be as precise as possible, many traders will move down to a lower time frame in an effort to get a more detailed look at the move inside of the larger-term trend.

    Price Action can help traders diagnose and trade trends


    Traders can also look to use indicators to plot an entry, under the premise that the longer-term trend may be at the early stages of its continuation; and can be entered upon with the shorter-term chart.

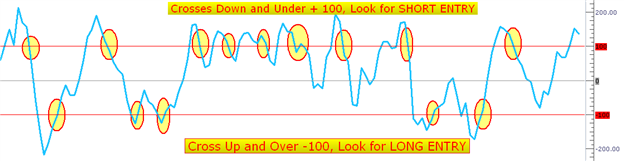
    There are numerous indicator options for this premise. Many traders will look to oscillators such as RSI or MACD to trigger the position. Other popular options are MACD, Stochastics, CCI, and the moving average crossover.

    Traders looking to speculate with the trend want to focus ONLY on signals that move in that direction.

    So, for instance, if an up-trend has been found on the longer-term chart, then the trader is only looking to buy. If they are looking to sell, then it’s not a trend-trading strategy any longer as the trader is looking for a reversal (or a swing) that doesn’t agree with the longer-term trend direction.

    Types of Trend-Trading Strategies

    The future is unknown; and nobody has a crystal ball that will magically foretell tomorrow’s price movements. But the fact of the matter is that biases do exist, trends do take place (for a reason), and in many cases those trends may continue.

    If traders want a more objective way of trading with trends, they can look to implement an indicator like RSI to trigger the position after the trend has been graded on the longer-term chart with Price Action.

    Traders looking to use indicator-based strategies can take this a step further with the logic utilized in my ‘fingertrap’ scalping strategy. In such the strategy, moving averages are used to grade the trend on a longer time frame, and a moving average/price action crossover on the shorter time frame is used to trigger in the direction of the trend. While this is designed as a scalping strategy, traders can certainly swap out the time frames to make the logic of the strategy operable on a longer-term basis.

    -- Written by James Stanley

    More...

  2. #2
    member ForeCastle's Avatar
    Join Date
    Apr 2013
    Posts
    1,077
    Blog Entries
    236

    Trading the Break

    Talking Points:

    • Breakouts emanate from range-bound markets as new information pushes prices higher or lower.
    • These breaks can often be accompanied with increased volatility that can prove devastating
    • Risk-Reward ratios are of the upmost importance, so traders can mitigate the damage of false breakouts while maximizing the reward of successful entries.


    Since future price movements are, in essence, unpredictable; identifying with and trading in the direction of the trend gives the trader the chance to jump on the side of any bias that may have been seen in the market. And if those biases (trends) are to continue, the trader can potentially make three, four, or five times the amount they put up to risk.

    Unfortunately, trends don’t always exist. More common is the condition with which prices aren’t displaying some element of a bias; when prices move in a range-bound fashion for an extended period of time. And because there is a lack of a bias, knowing how to trade in these situations can be quite a bit more difficult. But traders have two choices: They can trade as if the range is going to continue, or they can trade the range in the expectation of a breakout of those range-bound prices.

    In this article, we’re going to delve deeper into trading the breakout.

    Breakouts come from ranges


    Breakouts

    When prices do break-out from a range, the movement can be fast, violent, and extremely large. Imagine a rubber band being pulled all the way back, until eventually it pops; that’s somewhat similar to what can happen when a breakout takes place.
    Trading a breakout is not for the faint of heart. Often the breakout will come from a news event, or a data announcement, or some other reason that causes traders to push prices being the previously defined support and resistance levels.
    It often takes more than one attempt to catch a breakout


    It’s this extreme pickup in volatility that makes trading breakouts so difficult; as the accompanying price movements can swing dangerously in both directions, and there will be many instances in which support and/or resistance get broken, only to see prices reverse and move in the opposite direction. This is the dreaded ‘false breakout.’

    Because of the heightened volatility around such events, and given the risk of false breakouts; traders often need to focus more heavily on risk and reward while being more aggressive: cutting losers even quicker while also looking for larger profit targets when they find themselves on the right side of the trade.

    Probabilities

    As we discussed in our trend-trading article, whenever a bias has been seen in the market, the trader may be able to jump into the trade with the expectation of that bias continuing. Or to put it more simply, the trader may be able to get the probabilities in their favor simply by trading in the direction of the bias (or trend).

    With a range-bound market, there is often no bias to be seen. Prices are caught between support and resistance. If prices get too high, traders sell: If they get too low, traders buy. To break out of these support or resistance zones, the market often needs a motivator of some type; like a news announcement.

    And when we do get that eventual motivator, volatility picks up and prices begin moving much more wildly. This means that there are many occasions in which support or resistance will be broken during this onslaught of volatility only to see prices reverse and move in the other direction. These false breakouts can make trading this condition utterly frustrating; and this why new traders may be best served by focusing on the more formulaic trend-based market conditions.

    Traders will often assign a lower probability of success to breakout strategies because of the aforementioned reasons. If a trader thinks they can usually win 1 out of every two trend trades, they will often look to win 1 of every 4 breakout trades.

    And because breakouts have a lower probability of success, traders need to adjust risk-reward ratios accordingly: Looking at even tighter stops, and even larger profit targets.

    In The Number One Mistake that Forex Traders Make, we advised looking for a minimum risk-reward of 1-to-1 (1 dollar sought for every 1 dollar risked). Because breakouts often have a lower probability of success, traders should look to be even more aggressive by seeking at least 2 dollars for every 1 dollar put up as risk.

    To many, the juice is worth the squeeze

    So, we’ve warned you against the risks of trading breakouts; a logical question that follows is often ‘why would anyone trade breakouts when there might be a trend somewhere that can be traded?’

    Well, the beauty of the breakout is in the potential. When a breakout does work, the upside can potentially be huge (just like the downside is huge, but can be addressed or offset with tighter stops).

    New trends often form from an initial breakout; and this is a very natural life-cycle in financial markets. Let’s look at an example to illustrate.

    Most new trends start with a breakout


    It’s this outsized profit potential that make breakouts so enticing, and the fact that large movements can be seen in a very short period of time is what makes the condition so attractive.

    How to Trade Breakouts

    The key ingredient to trading a breakout is Support and/or Resistance. These levels that may see changes in order flow are the same prices that traders can look to enter upon breaks.

    Pivot Points are an extremely common option for breakout traders. Traders can look to these price levels for potential breakout moves, while placing entry orders just outside of these prices so that once a pivot point yields to a price surge, the entry is initiated and the trader is in the position.

    Another common option for trading breakouts is including the Price Channels indicator (often called ‘Donchian Channels,’ after famed breakout-trader Richard Donchian). Price Channels will show the highest high, and the lowest low over the past x periods (x being the number of candles input by the trader). When prices approach these levels, they may go on to make higher highs, or lower lows; and this is the essence of a breakout entry.

    The same type of logic can be utilized around psychological whole numbers, or round levels like 1.3500 on EURUSD or .9000 on AUDUSD. These round-number price levels will often see a large number of stops or limits, and this can stop a trend dead in its tracks, at least temporarily. But when a subsequent approach towards that level takes place, the number of stops or limits may not be able to hold back the surge of selling (or buying in the case of an up-trend).

    This leads to one of the more common ways of trading breakouts; incorporating price action and previous market movements into the analysis.

    By noticing price levels at which the market has respected in the past, traders can look to place entries outside of those prices so that if a subsequent move towards those levels is strong enough – the position is opened.

    This can be taken a step further to combine price action with other mechanisms of support and resistance, like psychological levels, or Fibonacci, or Pivot Points to seek out the ‘strongest’ levels of support and/or resistance. The fact that the market had honored those levels in the past via price action can serve as a form of confirmation that the price has had relevancy in the past; and if price approaches it again, it may not be as relevant in the future.

    -- Written by James Stanley

    More...

  3. #3
    member ForeCastle's Avatar
    Join Date
    Apr 2013
    Posts
    1,077
    Blog Entries
    236

    What You Need To Know About Your Trade Position Size Strategy

    Talking Points:
    -Why Traders Need to Focus on Position Sizing
    -Martingale vs. Anti-Martingale Technique of Position Sizing
    -Can You Maximize Profits By Adding To Losses?

    Do you think if you’ve unfortunately placed five losing trades in a row that the next one is due to be a winner? If so, you’re likely prone to overleveraging that 6th trade, thinking it will be profitable. If it becomes a loss again, you will soon find your promising Forex career coming closer to an unnecessary end. Instead, it’s best to focus on calming potential frustrations as a trader and not place too much emphasis on one trade unless it’s winning big, in which you can look to take advantage of adding to that trade at opportune times.

    Why Traders Need to Focus on Position Sizing

    With a relatively fixed account balance to start trading any market, you must focus on the position size you will have on each trade. You’ve likely heard the phrase, ‘cut your losses short and let your winners ride,’ but many traders make a key mistake. That mistake is that they often add to losing trades trying to buy the bottom in a downtrend and do so with more leverage which is effectively known as the Martingale approach.

    Many successful traders have a few key components of their trading strategy in common. For example in the book, Market Wizards, by Jack Schwager, most successful traders feel that any person can place a winning trade, but unless you can control risk, you have little chance at overall success. Here are some of my favorite quotes:

    "You have to minimize your losses and try to preserve capital for those very few instances where you can make a lot in a very short period of time. What you can’t afford to do is throw away your capital on suboptimal trades."-- Richard Dennis

    "Risk management is the most important thing to be well understood. Undertrade, undertrade, undertrade is my second piece of advice. Whatever you think your position ought to be, cut it at least in half."-- Bruce Kovner

    Also interviewed in the book of Market Wizards, Dr. Van K. Tharp discusses the mental aspect around making decisions in controlling risk and reducing trading risk. Those are simply a few examples of many other traders who have come to realization that in due time, managing your position size to control market risk becomes more important than what triggers your entry into a trade. When we analyzed over 12,000,000 live traders in our Traits of Successful Traders report, we also found that position size / leverage were a key component of overall success.

    Learn Forex: Position Size & Leverage Are a Key Determinate of Your Success


    Martingale vs. Anti-Martingale Technique of Position Sizing

    There are two common position sizing systems that you should know about so that you can avoid one and consider the other. The most popular system is known as the Martingale, whereby you add to a losing trade in the hope of lowering your average entry price which requires a smaller move in your favor to break even. The Martingale entries are usually staged at fixed increments of 50 or 100 pips but as you’ll soon see, one small trade can soon wipe out your account.

    The other system is known as the Anti-Martingale. An impressive number of fund managers and successful traders utilize the Anti-Martingale whereby you add only to winning trades. The Anti-Martingale takes on the assumption that adding to a losing trade will drain your account and you should only look to capitalize on a winning streak or trend and thereby, ‘let your profits run and cut your losses short.’

    When you’re in the heat of the moment, the Martingale system feels like such an approach would work. However, from a mathematic model perspective, the Martingale leads to sure ruin eventually and all it takes is one strong trend that you’re on the wrong side of. Here’s a breakdown of the volatile equity swings that can take place when an account employs the Martingale system.

    Learn Forex: Sample Account Which Increases Trade Size Only To Losing Trades


    This example shows a profitable example but it’s helpful to think on this question. What would happen if you had a string of 10 losing trades in a row? It could happen and if you were adding to each loss of 100 pips hoping that it would eventually turn around, then you could be facing a Margin Call due to the inherent fallacy of this strategy.

    Learn Forex: Sample Account Where Martingale Meets String of Losing Trades


    You can easily get into trouble with the Martingale approach when you think that a trend can’t continue. Of course, it wouldn’t take long to find multiple examples of times when an imbalance in monetary policy caused a huge shift in the market and a new trend is born. Here is a recent example of USDCAD which pushed 650 pips in a few months without retracing more than a hundred pips on its push higher until recently.

    Learn Forex: The Recent USDCAD Trend Shows How Quickly the Martingale Can Blow-Up


    This argument against the martingale approach whereby you add to losing trades begs a simple question. If this system is so popular, is there any situation where it does work? In my experience, there are two scenarios where Martingale can work. In a strict range bound market, it can work well but one breakout out of the range against your positions will wipe you out in due time. The second scenario is if the trader has unlimited capital.

    Can You Maximize Profits By Adding To Losses?

    Adding to your losses is a harmful strategy that can work in the short-term but has a very poor long-term track record. If your trade is losing, the most likely scenario is that your analysis was off or your timing was off but either way, it’s costing you money to stay in the trade and the best move is to exit the trade until the waters calm and you can make sense of the overall landscape. To grow your account, you should be advised to focus only on trading in a way that has a mathematical probability of growing your account and not trading to prove that you’re smart. If you take your trading beyond the p/l and make a winning or losing trade as emotional validation, then you could quickly become a martyr of your own faulty analysis.
    Happy Trading!
    ---Written by Tyler Yell, Trading Instructor

    More...

  4. #4
    member ForeCastle's Avatar
    Join Date
    Apr 2013
    Posts
    1,077
    Blog Entries
    236

    How to Trade Ranges

    Talking Points:

    • Traders are often best served by using the strategy most applicable to the prevailing market condition
    • Ranges occur when prices are caught between support and resistance
    • In this article, we teach traders how to approach and trade range-bound market conditions


    In our last article, we looked at Trading Breakouts, and in the article before that we showed you How to Build and Trade a Trend-Following Strategy. In this article, we’re going to address the market condition that comes up the most often: The Range.
    There is a reason we saved this condition for last. Ranges can be difficult to trade, and many traders will eschew ranges to trade in trending or breakout conditions. As we explained previously, trends display a bias that the trader might be able to latch on to; and breakouts offer massive upside potential when they work… but ranges don’t offer either of these features.

    Ranges take place when prices find themselves caught between support and resistance. And when this happens, traders can address the range on one of two ways. They can trade for the range to continue, which means that up-side is limited (by the other side of the range); or they can look for the eventual breakout from the range that may turn into a new trends. The picture below will illustrate further:

    Do you want to trade the range to continue, or to look for the breakout?


    If you want to look to trade the breakout from these range-bound periods in the market, please take a look at the article, Trading the Break in which we teach traders to do just that. In this article, we’re going to further investigate the art of trading the range.
    Trading Ranges

    Many traders will ignore ranges because the perceived profit potential may be limited. After all, if we’re trading a range by buying support, then we’re reasonably looking to close the position at resistance. This would be a limited-upside type of proposition, and that may not seem nearly as attractive as a trend or a breakout where the trader can potentially look for 3 or 4 times their risk amount if they’re able to get on the right side of the trade.

    But, the range is the market condition that we, as traders, will likely encounter the majority of the time.
    Ranges can develop in numerous ways. We may see a short-term range towards the top of an up-trend, as buyers and sellers fight to control the next trend. Or perhaps a long-term bout of indecision creates congested price movements that stay bounded between support and resistance levels. Whatever the context might be, if prices are bound between support and resistance then the trader is seeing a range-bound period in the market.

    And if the trader is going to trade for the range, then they need to make absolutely sure that they manage their risk properly; because a breakout moving in the opposite direction of the trader’s position can amount to a monstrous loss as that breakout may turn into a new trend that continues to drive against the traders equity line.

    Trading Ranges requires stops in the event that a breakout takes place against the trader’s position


    How to Find and Trade Ranges

    The goal when trading ranges is similar to the goal when trading trends: To buy low, and sell high.
    The only other real requirement for a range is that price action needs to be bound between support and resistance, giving the trader the idea that if previously established support and resistance remain respected, the trader may be able to see a profitable position.
    One of the difficult aspects of doing this is that prices will rarely adhere to an exact identical price as support or resistance; and often ‘zones’ around supportive or resistant prices are much more applicable. This is where price action analysis can bring considerable benefit to the trader.

    We discussed how traders can look for and trade ranges with price action alone in the article, How to Analyze and Trade Ranges with Price Action.

    In the article, we teach how you can use recent price action to produce a strategy with a technical setup such as we’ve outlined below:

    Zones of Support and Resistance can make trading range-bound conditions more feasible


    Traders can also look to incorporate additional elements of support and/or resistance in the range including pivot points, Fibonacci, or psychological whole numbers; but it’s important that traders have seen a price action swing around that particular price, thereby validating that level as a price with which the market has respected, and may respect again in the future.

    Taking Range-Trading a Step Further

    No range lasts forever. Breakouts come from ranges, and breakouts can lead to new trends. So traders can use this information to their advantage when trading in a range.

    Let’s say, for instance, that a trader buys support with anticipation of a range continuing. But when prices move to resistance, the trader takes a second look at their profitable position, and decides that they may want to stay in the trade in case a breakout takes place to the up-side.

    Well, if the breakout doesn’t come in, and if the range fills in as the trader had originally anticipated; they can watch all of their profit drain away and maybe even more if the trade runs to their stop.
    This would be a bad way of trading a range.

    What can be done, however, is some position management in the event that a breakout may occur. Rather than closing the entire lot when the price moves up to resistance, the trader can look to close a portion of the position so that, if prices do reverse – at least they’ve taken some profit out of the trade. But if the breakout takes place, they have a remaining part of the position that can reap those rewards.

    This would be similar to scaling out of the trade, and if the breakout happens to turn into new trend, the trader can go into the new trends with a hearty profit floating in the trade, which can be used to initiate a new position in the event should the trend continue.
    Traders can also look to adjust their stops to break-even, so that if the breakout doesn’t turn into a new trend, and prices reverse – the trader can be taken out of the remainder of the position at their original entry price.

    -- Written by James Stanley

    More...

  5. #5
    member ForeCastle's Avatar
    Join Date
    Apr 2013
    Posts
    1,077
    Blog Entries
    236

    How to Find the ’Best’ Currency Pair to Trade

    Talking Points:

    • Whether traders are speculating in trends, ranges, or breakouts – currency pair selection can bring significant value.
    • While the major pairings can offer considerable volatility, they may not be the best markets for traders to voice their opinions
    • We walk through two ways that traders can perform Strong-Weak Analysis: Manual, and Automated through the StrongWeak App


    Options are abundant in the currency market…

    While a few major pairings dominate the volume from many traders in the currency market, the value of finding the best possible pairing to execute your strategy cannot be understated. While the major currency pairs can offer significant volatility and fast movements, they may not be the best pairs to voice a trader’s opinion with. If you’re not familiar with the ‘major’ currency pairs, they are outlined below:

    The Major Currency Pairs:


    These are the most popular currency pairs that are traded by forex traders, and if you’d like to learn more on the topic, Walker England penned this article entitled ‘Understanding the Forex Majors.’
    But are these the best pairings to focus on? Let’s walk through an example together.

    Let’s say that a trader was expecting strength in the British Pound, so they decided to buy GBPUSD. And let’s say that good news comes out for The United Kingdom, which should equate to British Pound strength; only the US Dollar saw even more strength than the Sterling, and instead of moving higher as you had expected, the pair moves lower.

    So –in essence: You were right – but you still LOST in the trade because the Dollar got stronger than the British Pound.
    When traders force themselves to only trade the major currency pairs, it’s similar to ‘trying to fit a square peg into a round hole.’

    Let’s take the above scenario from another perspective:
    Same as above, you expect the British Pound to increase in value, so you want to buy Sterling. But instead of just blindly buying GBPUSD – you search for the most optimal pair to do it with. So, after some perusal, you find that the Canadian Dollar has been extremely weak (more so than the US Dollar); and you decide that you want to marry up what you think is a strong GBP with a weak CAD.
    And let’s consider that this time, you were wrong… and the British Pound didn’t see strength. Well, as long as the CAD remained even weaker than British Pounds – you can still win.

    So, by focusing on the most optimal pairing, the trader stands the chance of being wrong and still winning in the trade.
    Because every currency pair includes two economies being traded against each other, traders are best served best by analyzing botheconomies in an effort to match a strong currency with a weak one. Traders want to look to eliminate the instances of being right, but still losing; while increasing the chance of being wrong and still winning.

    How to Separate the Strong from the Weak

    As you can imagine, pair selection is a key tool of the FX trader; and as such we’ve tried to provide a litany of resources to assist traders with the analysis.

    Strong-Weak analysis is a process with which traders can look at, and accordingly grade a single currency’s strength and/or weakness against each of the other individual currencies. This is the process that the trader in the above scenario that would lead the trader to look at buying GBP against CAD as opposed to the US Dollar, and this is how traders can begin to focus on the optimal pairings for their goals.

    There are two ways to do this analysis. The manual, long-form method for doing this analysis was outlined in the article entitled How to Separate the Strong from the Weak. With a charting package and just a little bit of math the trader can build a table such as below:

    Strong-Weak Analysis can be performed manually with a spreadsheet and charting package


    We walk through the application, as well as popular usages of the application, in this video embedded into the brainshark medium. After clicking on the link, you’ll be asked to input information into the ‘Guestbook,’ after which you’ll be met with a 12-minute video that further explains the app.


    More...

  6. #6
    member ForeCastle's Avatar
    Join Date
    Apr 2013
    Posts
    1,077
    Blog Entries
    236

    3 Types of Forex Analysis

    Talking Points:

    • Three general forms of analysis that traders use
    • Find one or a combination of styles that fits your personality


    There are several different ways to analyze the FX market in anticipation of trading. Though categories of analysis may be plentiful, keep the end goal in sight which is to use the analysis to identify good trading opportunities.

    We will look at the three main areas of analysis and how to learn more about them. Then, try out each of these areas to determine which of the three methods or combination of the methods works well for your personality. The three areas are:


    • Fundamental
    • Technical
    • Sentiment


    Fundamental

    Forex fundamental centers mostly around the currency’s interest rate. Other fundamental factors are included such as Gross Domestic Product, inflation, manufacturing, economic growth activity. However, whether those other fundamental releases are good or bad is of less importance than how those releases affect that country’s interest rate.

    As you review the fundamental releases, keep in mind how it might affect the future movement of the interest rates. When investors are in a risk seeking mode, money follows yield and higher rates could mean more investment. When investors are in a risk adverse mentality, then money leaves yield for safe haven currencies.

    Technical

    Forex technical analysis involves looking at patterns in price history to determine the higher probability time and place to enter and exit a trade. As a result, forex technical analysis is one of the most widely used types of analysis.
    Since FX is one of the largest and most liquid markets, the movements on a chart from the price action generally gives clues about hidden levels of supply and demand. Other patterned behavior such as which currencies are trending the strongest can be obtained by reviewing the price chart.

    Other technical studies can be conducted through the use of indicators. Many traders prefer using indicators because the signals are easy to read and it makes forex trading simple.

    Sentiment

    Forex sentiment is another widely popular form of analysis. When you see sentiment overwhelmingly positioned to one direction that means the vast majority of traders are already committed to that position.

    Since we know there is a large pool of traders who have already BOUGHT, then these buyers become a future supply of sellers. We know that because eventually, they are going to want to close out the trade. That makes the EUR to USD vulnerable to a sharp pull back if these buyers turn around and sell to close out there trades.

    ---Written by Jeremy Wagner, Head Trading Instructor, DailyFX Education

    More...

  7. #7
    member ForeCastle's Avatar
    Join Date
    Apr 2013
    Posts
    1,077
    Blog Entries
    236

    Trader Styles and Flavors

    Are you a medium-term technical trader that uses automation software to place your Forex trades, or are you more of a long-term fundamental trader that places discretionary trades?
    Neither?
    With so many different ways to trade, it’s difficult to keep track of them all.
    Traders come in all styles in flavors which is the topic of today’s discussion.

    Technical vs. Fundamental

    Technical analysis is the art of studying past price behavior and attempting to anticipate price moves in the future. These are traders that focus solely on price charts and often times incorporate indicators and tools to assist them. They look at price action, support and resistance levels, and chart patterns to create trading strategies that hopefully will turn a profit.

    Fundamental analysis looks at the underlying economic conditions of each currency. Traders will turn to the Economic Calendar and Central Bank Announcements. They attempt to predict where price might be headed based on interest rates, jobless claims, treasury yields and more. This can be done by looking at patterns in past economic news releases or by understanding a country’s economic situation.

    Short-Term vs. Medium-Term vs. Long-Term

    Deciding what time frame we should use is mostly decided by how much time you have to devote to the market on a day-to-day basis. The more time you have each day to trade, the smaller the time frame you could trade, but the choice is ultimately yours.

    Short-Term trading generally means placing trades with the intention of closing out the position within the same day, also referred to as
    “Day Trading” or “Scalping” if trades are opened and closed very rapidly. Due to the speed at which trades are opened and closed, short-term traders use small time-frame charts (Hourly, 30min, 15min, 5min, 1min).

    Medium-Term trades or “Swing Trades” typically are left open for a few hours up to a few days. Common time frames used for this type of trading are Daily, 4-hour and hourly charts.

    Long-Term trading involves keeping trades open for days, weeks, months and possibly years. Weekly and Daily charts are popular choices for long term traders. If you are a part-time trader, it might be suitable to begin by trading long term trades that require less of your time.

    Discretionary vs. Automated

    Discretionary trading means a trader is opening and closing trades by using their own discretion. They can use any of the trading styles listed above to create a strategy and then implement that strategy by placing each individual trade.
    The first challenge is creating a winning strategy to follow, but the second (and possibly more difficult) challenge is diligently following the strategy through thick and thin. The psychology of trading can wreak havoc on an otherwise profitable strategy if you break your own rules during crunch time.

    Automated trading or algorithmic trading requires the same time and dedication to create a trading strategy as a discretionary trader, but then the trader automates the actual trading process. In other words, computer software opens and closes the trades on its own without needing the trader’s assistance. This has three main benefits. First, it saves the trader quite a bit of time since they no longer have to monitor the market as closely to input trades. Second, it takes the emotions out of trading by letting a computer open and close trades on your behalf. This means you are following your strategy to the letter and are not able to deviate. And third, automated strategies can trade 24 hours a day, 5 days a week giving your account the ability to take advantage of any opportunity that comes its way no matter the time of day.

    ---Written by Rob Pasche

    More...

  8. #8
    member ForeCastle's Avatar
    Join Date
    Apr 2013
    Posts
    1,077
    Blog Entries
    236

    3 Points of Validation for Any Price Breakout

    Talking Points:
    -The 3 Components to Validate a Breakout
    -The 3 Components Applied to GBPUSD & Prior Breakouts
    -1 Question to Help You Avoid a Bear / Bull Trap

    “An important rule in trading is that time is much more important than price.”
    -Mark Fisher, The Logical Trader

    Few things are more exciting to a trader than a price breakout. Many questions rush to mind as you wonder if you’re on the cusp of the world’s next hottest trend or if this will be the move that makes your week, month, or year. However, it’s best to calm down when you first recognize the price break and look for a 3 developments of a break to confirm that the breakout is worth a risk of your capital.

    Learn Forex: If GBPUSD Breaks, Here Are Key Levels


    The 3 Components to Validate a Breakout

    It’s very easy to fall into the trap of focusing only on the initial break of a key support or resistance level. After all, many traders are told to think of support as a price floor and if that floor gives, then price will fall and similarly price will likely rise when a high price, or resistance is broken. Unfortunately, markets do not work in that manner where a price going one pip past a key level means the markets are forever changed. In fact, you can often see price sometime peak past an old key level only to reverse and trap many hungry and impatient traders into a move.

    The 3 key components that can help you validate a break out is simple. First, you look for price to break the level that was known as support or resistance. A price break is usually the only definition of breakout trading.

    Learn Forex: The Inability of a Breakout to Hold the Close Should Cast Doubts


    Second, you want to see if the close can honor and hold the breakout. The logic behind this thinking is that if price pushes higher but the close is significantly lower than the breakout than the conviction was low. If conviction is low then the bullish momentum is ripe for a reversal as many large traders may have already taken their profits on the prior rally.

    Third, if price breaks the key level and if the close can hold the breakout, then you want to give a specified period of time to show that the market honors this new level. If you’re trading on a daily chart, you can look for 3 days after the close honors the new breakout. If you’re on an intra-day chart, you can use a fraction of your preferred time-frame to validate the intra-day breakout. If the market honors the new level by not trying to push it down, then you can take that at as a signal to be looking for entries in the direction of the breakout.

    To sum it up, you want to see 3 things to validate a breakout:

    • Price-break
    • Closing in favor of the breakout
    • Pre-determined time in new price zone


    The 3 Components Applied to GBPUSD

    We’ve just covered that for a breakout to be a higher-probability and less frustrating trade, you should look for 3 components. The 3 components, break-close-hold, will help you see a likely follow through of the breakout. Of course, as a trader, if the breakout doesn’t follow through, you can lose money in a bull trap if you bought on the break alone without a close and hold.

    Learn Forex: GBPUSD Only Has 1/3rd of Breakout Validations Thus Far


    What you’ll see above on the GBPUSDchart, where we’re looking to validate the breakout, is based on the 2011 high. This is applied to a daily chart but can be used across multiple-time-frames. We have seen a few price breaks in mid-February, but we’re yet to see the close above 1.6747.

    In addition to awaiting the close above the 2011 high, a validation would be better confirmed if price could stay in the new-zone for a pre-set amount of time. You’ve seen the first chart with two major levels above 1.6745 that would come into focus if the 3 rules hold therefore, it’s OK to be patient with those targets in view. The first big target, the 2009 high is 300 pips away followed by roughly an 800 pip target with a corrective high of 2008.

    1 Question to Help You Avoid a Bear / Bull Trap

    To improve your performance as a trader, you need to be able to honestly ask and honestly answer some key questions. If you’re targeting breakouts, like I do, then there is one question I’d like to leave you with. The question:

    “Has this breakout proven itself with a time element and not just a price element?”

    As a trend trader, I focus on time as much as price. The time of the trend is what makes trend trading indicators like Ichimoku to be such a helpful system. Whichever system you choose, looking for further validation of a breakout can be a prudent and helpful way to trade breakouts.
    Happy Trading!
    ---Written by Tyler Yell, Trading Instructor

    More...

  9. #9
    member ForeCastle's Avatar
    Join Date
    Apr 2013
    Posts
    1,077
    Blog Entries
    236

    How to Direct Your Strategy based on Market Condition

    Talking Points:

    • Traders should look to focus their strategies in appropriate market conditions.
    • Multiple time frame analysis can offer a ‘bigger-picture’ view of a market.
    • Traders can choose to trade trends, ranges, or breakouts based on their analysis.


    In our last article, we looked at The Life Cycle of Markets. As we discussed, markets will often display one of three major market ‘conditions,’ which can greatly denominate the manner in which that trader should look to speculate.

    Trends show a bias that has been displayed in the market place; and when a strong trend is available, the trader’s job is simple: To trade in the direction of that trend. If the trend is up, the trader should look to buy; and if the trend is down, the trader should look to sell.

    Unfortunately trends don’t always exist; and when that often entails congested, range-bound price movements as bulls and bears both fight to take over control of the market in search of the next trend. These range-bound environs can be more dangerous, and given the limited upside that might be available, many traders will often eschew trading the range; instead waiting for the inevitable breakout that may end the range and lead into a new trend.

    The Varying Tonalities that a Market May Show


    In this article, we’re going to discuss how traders might look to focus their strategies on the appropriate market condition.

    The Benefit of Multiple Time Frames

    The value of being able to get a ‘bigger picture’ view on a market cannot be understated. To think of the value of multiple time frame analysis, think of trading in a currency pair like buying a home.

    If you’re going to buy a home, you’re likely going to want more of an overview than simply driving by and getting a quick glance. This is like trading a currency pair when only seeing one time frame.

    When buying a home, you’ll likely want to get out of the car and walk around to ensure that the back yard isn’t in complete disarray. You want to check the foundation to make sure that you’re not going to have exorbitant repair expenses in your future. You want to get as much information as is feasibly possible to make the most intelligent purchasing decision that you can.

    Trading in a market isn’t all that different, the more information you have the more of an informed decision that you can make.

    In The Time Frames of Trading, we offer some common time frames based on desired holding time.

    Multiple Time Frame Intervals for Trend Diagnoses/Entry


    If a trader is looking to hold a position for a few hours to a few days (commonly called ‘Swing Trading’), the four-hour chart can be the optimal time frame for entering positions.

    And if the four-hour time frame is being used to enter positions, the daily chart can be used to gauge the trend (or lack thereof); so that the trader can ensure they are focusing the optimal approach on the prevailing market condition.

    Or perhaps a longer-term trader wants to use the daily chart to enter trades. Well, then the weekly chart can be used as the longer time frame to guide the trader’s decision-making processes.

    The benefit of using a longer time frame in the decision as to which strategy to utilize is that the trader can take more information into account, getting an idea of the ‘bigger picture’ before executing on their strategies.

    Gauging Trend Strength (or lack thereof)

    Once a trader has determined the time frame with which they want to look to grade the prevailing trend, focus can then be diverted to investigating the strength of that trend.

    Price Action is a popular mechanism for doing so. Traders can simply look as to whether a market is in the process of making ‘higher-highs’ and ‘higher-lows.’ If this is taking place, then the trader is witnessing an
    up-trend, and can look to move down to the shorter time frame in an effort to buy as efficiently as possible.

    The picture below shows how a trader using price action can look to buy on the shorter time frame:

    Price Action can be Beneficial in Grading Trends, and Plotting Entries


    Another popular way of grading trend strength on the longer-term chart incorporates the ADX indicator. ADX, or the Average Directional Index is an indicator created by J. Welles Wilder that was designed specifically to grade trend strength. The downside of this is that it doesn’t show which direction the trend might be moving, only whether the trend is ‘strong’ or ‘weak.’

    Traders can use the ADX indicator on the longer-term chart to determine whether or not a trend is being seen in the market. If values are reading over 30 on ADX, then traders will often look to execute trend-based strategies.

    The Average Directional Index (ADX)


    If readings are under 30, then traders will often look to employ range or breakout strategies.
    Now that the Trend is determined, what’s next?

    The shorter time frame is where the trader will often look to enter into the market based on the analysis on the longer time frame.

    If a trend was found on the longer time frame, the trader’s job is to find a way to enter in the direction of that trend. On the lower time-frame, the trader can look to buy up-trends cheaply, or to sell down-trends expensively. This can be done with price action; or traders can look to incorporate indicators to offer a ‘trigger’ in the direction of the longer-term trend on the shorter time frame. Some common indicators for triggering positions on the shorter time frame are MACD, Stochastics, and the Commodity Channel Index (CCI).

    The Commodity Channel Index Can Offer Numerous Entry Opportunities


    If a Range-bound market condition was seen on the longer time frame, the trader has another decision to make before deciding how to enter: Does the trader want to trade continuation of the range, or the eventual breakout?

    The logic of the range-bound entry and the breakout is directly opposite: Trading ranges entails selling highs, and buying lows (in anticipation of the range continuing), while trading breakouts involves buying new highs and selling new lows (with the expectation of the breakout bringing new highs or new lows into the market). We cover how traders can look to approach ranges in more depth in the article, How to Trade Ranges.

    If trading for the break, traders can look to place entry orders slightly outside of support or resistance levels so that once a new high or low is printed, the trade is entered and the trader can look for new highs or lows. We talked about how this can be done in the article, Trading the Break.

    If traders are looking to trade the range, an oscillator can be used similarly in the way that a trader would buy or sell in a trend (with the notable exception that up-side is limited). In both trends and ranges, traders want to look to ‘buy low’ and ‘sell high.’ The same types of tools can be used to determine when to buy and when to sell; MACD, Stochastics, and CCI are all popular mechanisms to trade in range-bound market conditions just as they are with trends.

    -- Written by James Stanley

    More...

  10. #10
    member ForeCastle's Avatar
    Join Date
    Apr 2013
    Posts
    1,077
    Blog Entries
    236

    2 Common Strategies for Trading FX

    Talking Points:

    • Range trading strategy is popular for buying low and selling high
    • Trend following strategy is one of the most widely used strategies
    • Explore these different styles in a free demo account


    There are many benefits to trading FX such as a tremendous amount of liquidity with low transaction costs and margin requirements. The 24 hour nature of FX trading opens the door to a variety of strategies from day trading to position trading to range trading to trend trading.

    There are so many different styles and flavors of FX traders, that they truly are too many to discuss each one. For now, we’ll start off with the two strategies that are the most common. The reason they are the most common is because they are opposite of one another…range trading and trend trading.

    Range Trading

    Range trading is a simple strategy where a trader will buy a currency on sale with the expectation that the valuation will come back towards a longer term average. This strategy may also be referred to as mean reversion and is similar to value investing.

    Forex Strategy: How to TradeRanges


    One key to this strategy is identifying those price points that are more favorable for you. That means identifying a price level to enter where sellers stop selling and buyers are more likely to start buying. These price points are generally obtained by identifying levels of supply (resistance) and demand (support). Support and resistance levels can be easily obtained by performing technical analysis on the chart. Indicators and oscillators can help you time entries as well.

    Trend Trading

    The second main strategy is trend following.
    One of the most common strategies used by new and experienced traders is a trend following strategy. Trend following simply means identifying the direction prices have generally been moving, then place trades in that same direction.

    Trend following is popular because strong trends tend to produce the largest results. Many times, those strong results came from moves in the direction of the preceding trend. Though there are several benefits, here are two benefits of trend trading.

    Forex Strategy: Trading Strong Trends


    Fortunately, trading trends is simple. The ease of identifying trades is in large part why new and experienced traders utilize some form of trend analysis in their trading plan.


    More...

Page 1 of 9 1 2 3 ... LastLast

Tags for this Thread

Bookmarks

Posting Permissions

  • You may not post new threads
  • You may not post replies
  • You may not post attachments
  • You may not edit your posts
  •