Page 7 of 10 FirstFirst ... 5 6 7 8 9 ... LastLast
Results 61 to 70 of 91
Like Tree1Likes

How to Build and Trade Strategies

This is a discussion on How to Build and Trade Strategies within the Trading Systems forums, part of the Trading Forum category; Talking Points: Position Traders can Trade Breakouts Use Channels for Support & Resistance Using a trail can allow a position ...


  1. #61
    member ForeCastle's Avatar
    Join Date
    Apr 2013
    Posts
    1,077
    Blog Entries
    236

    Strategy Series, Part 4: The HI-Low Breakout

    Talking Points:

    • Position Traders can Trade Breakouts
    • Use Channels for Support & Resistance
    • Using a trail can allow a position to lock in profit with the trend

    Find the Daily Trend

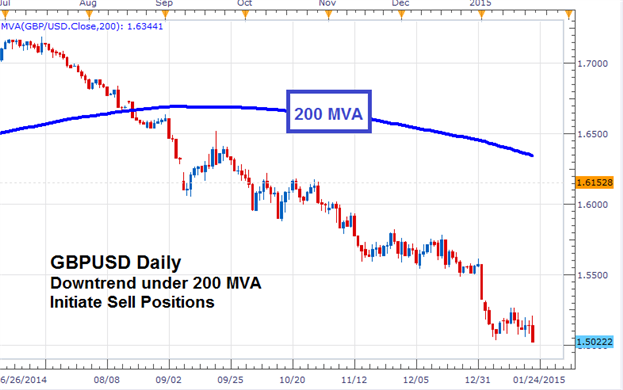
    The “HI-Low Breakout” approach is designed to find entries with the trend when price breaks from a key point of support or resistance. Since we will be selling in a downtrend and buying in an uptrend, the first task of this strategy is to find the trend. To begin traders will need to identify the primary trend on a Daily chart. A 200 MVA (Simple Moving Average) will be used for this, similar to the previously mentioned “CCI Swing” strategy. At this point, traders should note whether price is above or below the MVA.

    Below we can see an example of the 200 MVA at work on a GBPUSD Daily chart. The trend is considered to be down because price is below the 200 MVA. Keep this in mind, because if prices were instead above the 200 MVA the pair would be considered in an uptrend. Once the primary trend is found, keep this information in mind as we move forward and consider market entries.
    MVAs are an important component to this strategy! Before you get started with the “CCI Swing” strategy, sign up and take the FREE DailyFX Moving Averages training course linked below.


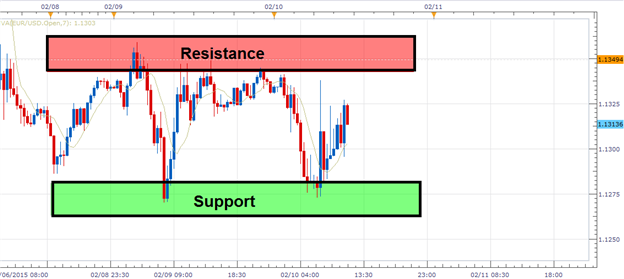
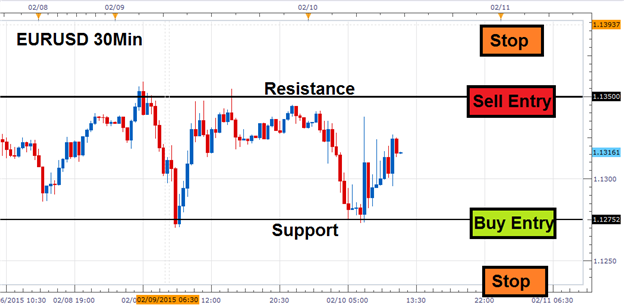
    Identify Support & Resistance

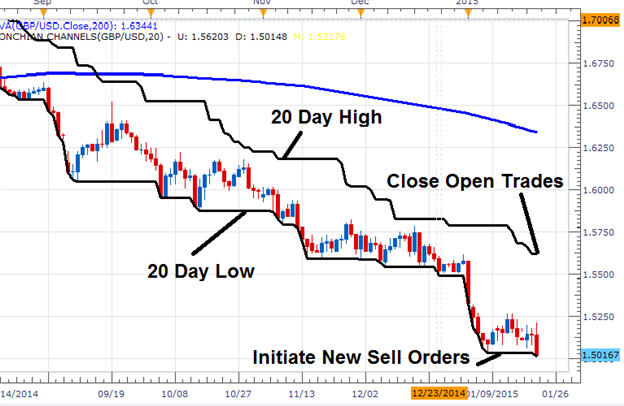
    Donchian Channels are a technical tool that can be applied to any chart. Their primary use is to pinpoint current levels of support and resistance by identifying the high and low price on a graph, over a selected number of periods. For today’s “Hi-Low Breakout” strategy we will be using 20 periods on a daily chart. This means that the channels will be used to identify the current 20 day high and low price. You can see these channels displayed in the graphic below, and this information will be carried over for our entry strategy.


    Execution

    Now that we have identified both the trend and support & resistance, it is time to plan an entry into the market. In a downtrend (price under the 200MVA), entry orders to sell the market should be placed one pip under the 20 day low. The idea is, when support is broken in an uptrend traders will look to sell. Conversely, in an uptrend traders will look to buy the market one pip above the 20 day high. While traders can opt to trade with market orders on a new high or low, entry orders are preferred here. This way orders can be set, and traders can trade breakouts occurring at any time of day without having to be in front of their computer.
    Above, we can see a sample sell signal for the GBPUSD. Before today’s price action, the GBPUSD had a new 20 day low established at 1.5032. This means a sample entry could be placed at 1.5031. As price passed through this value, the entry would be executed effectively selling the GBPUSD.


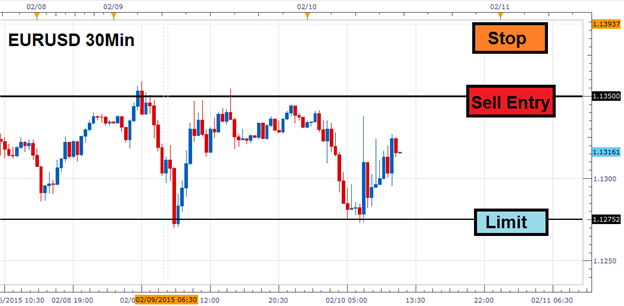
    Managing Risk & Trailing Stops

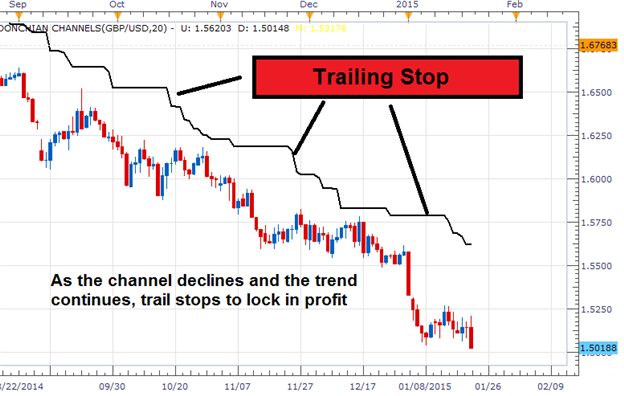
    Managing your positions is the last, but arguably the most important part of any strategy. When trading the “HI-Low Breakout”, this process can be simplified through the use of the Donchian Channels already identified on our graph. Remember how our pricing channels (representing the 20 Day high or low), act as an area of support or resistance? In an uptrend, price is expected to move to higher highs and stay above this value. If price moves through the bottom channel, representing a new 20 Day low, traders will want to exit any long positions. Conversely in a downtrend, traders will want to place stops orders at the current 20 period high. This way, traders will exit any short positions upon the creation of a new high.

    Finally traders will use the Donchian Channels as a mechanism to trail their stop forward. As the trend continues, traders will move their stop down the channel. Trailing a stop in this manner will allow you to update the stop with the position, and lock in profit as the trend continues. In the event that the trend turns, the positons will be closed at a new high (in a downtrend) or low (in an uptrend).


    More...

  2. #62
    member ForeCastle's Avatar
    Join Date
    Apr 2013
    Posts
    1,077
    Blog Entries
    236

    Strategy Series, Part 7: Trading Forex Ranges

    Talking Points:

    • Look for Ranges When Trends Stop
    • First Find Support & Resistance

    While trending market strategies are always a popular, traders should have a plan when markets fail to trade in a singular direction. This way instead of being deterred by sideways price action, traders will have a plan in place to adapt to present market conditions. To help with this process, today we will continue our conversation on strategies, by reviewing the “SRTS” range trading strategy. Let’s get started!

    EURUSD 30 Minute Range


    Find the Range

    The first step of any range trading strategy is to find the range. This can be done by identifying key values of support and resistance on your chart. To begin, add a 30 minute chart to your screen, which includes a minimum of 1 weeks’ worth of price data. Resistance is your price ceiling and can be found by connecting 2 or more price peaks on your graph. Next, identify values of support by connecting a series of swing lows. These areas may not line up to the pip, but remember to draw these lines as parallel as possible.

    Above we can see a sample range on the EURUSD currency pair. After looking at a weeks’ worth of data, support is found by connecting a series of lows near 1.1275. Resistance is found overhead by connecting a series of swing highs near 1.1350. These points create an active 75 pip range, which will become the basis for today’s strategy. It is important to clearly identify these points prior to moving forward to the next portion of this strategy.

    EURUSD Range with Entry and Stops


    Entries

    When trading an active range, it is always important to plan your entry as close to a support or resistance value as possible. The “SRTS”range strategy uses an OCO (one-cancels-the-other)) order to achieve this task. The idea behind this type of placement is to set one order to execute a sale at resistance, while another pending order, to buy the market, resides at the corresponding value of support. This way, if price is trading in the middle of the range you will be prepared to buy or sell regardless of the direction of the market.

    Above we can see a sample range setup developing on the EURUSD. An OCO order would be set looking to sell the EURUSD at 1.1350. Conversely a buy order would be set to enter the market at 1.1275. With price currently in the center of the range, a move to resistance would execute the pending sell order while canceling the buy order below at support. If instead price first moves to support, the pending buy order would be executed while the sell entry at resistance would be canceled.

    EURUSD with Sample Limit


    Stop and Limit Placement

    Just as trending markets can come abruptly to an end, so too can ranges. Eventually when price breaks from its range, any existing trades should be closed. When initiating a buy order, stop orders should be placed above resistance. Any easy way to determine the exact placement, is to take half the value of the range in pips, and add this to the top of the range. When buying support, stops can be managed in the same way; subtract half the range in pips from support, to find your final stop placement.

    When it comes to profit targets, basic range trading strategies will use a standard 1-2 Risk:Reward ratio. This means that you limit placement should look for twice the amount of pips relative to your stop. For example, if a sample range has a 100 pip range, a minimum 100 pip profit target is suggested along with a 50 pip stop.


    Learn More

    This “SRTS” range trading strategy is just one installment of an ongoing article series on market strategies. If you missed one of the previously mentioned strategies, don’t worry! You can catch up on all of the action with the previous articles linked below.
    Strategy 1: Trading Inside Bars with OCO Orders
    Strategy 2: The Easy MAC
    Strategy3: The CCI Swing
    Strategy 4: The HI-Low Breakout
    Strategy 5: Day Trading Market Reversals
    Strategy 6: Trend Trading with ADX

    ---Written by Walker England, Trading Instructor


    More...

  3. #63
    member ForeCastle's Avatar
    Join Date
    Apr 2013
    Posts
    1,077
    Blog Entries
    236

    FX Reversals The EURUSD Pressures Support

    Talking Points
    • The EURUSD has bounced off of today’s S4 pivot
    • Price is currently below range resistance at 1.1173
    • A breakout above R4 would signal a bullish breakout

    EURUSD 30 Minute Chart


    The EURUSD opened Tuesday's London trading session attempting to breakout towards new weekly lows. However, despite declining as much 85 pips from today’s open, EURUSD price action is now trading back inside of its Camarilla pivot range. Currently, price is trading under range resistance which is found at the R3 pivot point at 1.1173. In the absences of a breakout to a new higher high, traders will begin watching for price to move back through today's 57 pip trading range back towards range support at 1.1116.

    It should be noted that price has already failed once to break below the S4 pivot at 1.1088. Despite price quickly rebounding from support, a retest of this value could lead to further bearish momentum for the EURUSD. Alternatively a breakout above the R4 pivot at 1.1201 would suggest price returning back in the direction of its current daily trend. In either breakout scenario, traders can use a move through either the R4 or S4 pivot point to signal the end of current range bound conditions.


    ---Written by Walker England, Trading Instructor

    More...

  4. #64
    member ForeCastle's Avatar
    Join Date
    Apr 2013
    Posts
    1,077
    Blog Entries
    236

    Elliott Wave analysis: EUR/USD Wave Structure Points Towards Higher Levels

    Talking Points
    -Possible triangle is ending above 1.1150
    -Possible expanded flat the works higher, then eventually lower to 1.09-1.10
    -Both scenarios offer a trading opportunity using 1.1150 as risk

    Let’s walk through a couple of higher probability possibilities using Elliott Wave analysis. For those unfamiliar with Elliott Wave Theory, it is a form of technical analysis that assesses the characteristics of the waves without regard to the corresponding news. We will highlight two possible scenarios below. These are not the only two scenarios, but what we believe to be the higher probability scenarios.

    Bullish Triangle

    The first scenario to unpack is that the EURUSD is placing the finishing touches on a triangle masterpiece. This means the triangle is the ‘B’ wave of an A-B-C upward movement. If this is correct, then a ‘C’ wave would be a breakout to higher levels that begins from nearby levels.


    The trading plan for the triangle view is quite simple. 1.1150 must hold under the current drawing and if correct, prices may reach 1.17. If 1.1150 breaks, then we’ll need to reassess if we are only in the red ‘c’ leg of the triangle, or if option #2 below is elevated.


    Expanded Flat

    The second higher probability scenario we’re watching is a smaller degree expanded flat correction that eventually works down towards 1.09-1.10.

    Though this is a downward correction, wave relationships suggest prices could falsely break above 1.1375, but would likely hold below 1.1500. In essence, 1.1375-1.1500 becomes a false breakout zone. Under this scenario, an ensuing sell off drops to 1.09-1.10, but holds above 1.0815. Against the backdrop of a medium term up trend, 1.09-1.10 becomes a higher probability long entry.

    So under this scenario, we would see a false breakout higher, followed by a false breakout lower. The market, on many occasions, will confuse the most amount of people most of the time and this pattern helps that cause.


    Combining the Two Possibilities

    One of the biggest challenges of the wave picture on the EURUSD is that until 1.1050 or 1.1500 is broken, the top two interpretations discussed above are still alive. Meaning, Elliott Wave uses deductive reasoning and that anything possible, though of low probability, is still possible. Once a wave count can be eliminated, then the picture cleans up.

    However, with that being the case, we do have an interesting opportunity.

    For example, it is possible under both interpretations above that prices could move to 1.13-1.15 with interpretations remain valid. Therefore, with a fairly small risk on the trade, one could consider a long position and a stop loss just below 1.1150.
    Keep in mind risks associated with trading through news and the FOMC decision on Wednesday if you choose to do so. First, liquidity thins out so spreads will widen. It is imperative that you have enough margin in the account to weather the widening of spreads.

    Secondly, as a result of thin liquidity, prices may jump and gap. That opens the door to getting slipped on stop losses.
    As a result, any trading through news should be handled with very conservative or no leverage on the trades.

    More...
    Premium Trading Forum: subscription || The Forex Guide to Fundamentals Fundamentals
    Trading blogs || My blog

  5. #65
    member ForeCastle's Avatar
    Join Date
    Apr 2013
    Posts
    1,077
    Blog Entries
    236

    EURUSD - Elliott Wave 3 Coming After FOMC?

    Talking Points
    -Bearish 3rd wave in the Elliott Wave count is the preferred scenario
    -Bullish (X) wave is the alternate Elliott Wave count
    -Look for short opportunities near 1.15 or 1.1085
    The September FOMC meeting concludes with a lot of media debating if the Fed will hike rates or not. It is an interesting debate because economic data such as jobs are improving. However, other parts of the world are slowing in growth (think China) and US inflation is non-existent. Though the Fed would like to lift off of zero bound interest rates, the fear is that increasing rates in a dis-inflationary environment will create more economic problems. So the debate continues.

    We will look at the technical picture of the EUR-USD using Elliott Wave Theory. We will share a preferred bearish scenario and an alternate bullish scenario with levels to watch.

    Wave Count

    1. Preferred Bearish 3rd Wave
    The August 24 high was a meaningful high. The move to the downside since then has taken place in 5 waves which terminated on September 3. At that point, we look for a 3 wave counter trend upward bounce labeled a-b-c. It appears this corrective bounce is evolving into a more complex correction (labeled w-x-y). In that case, we could see another spike up to 1.14-1.15. A less likely scenario is that the move finished on September 14 at 1.1375 and wave (iii) down has already started.

    How to Build and Trade Strategies-bearish1.png


    Therefore, we have evidence building the trend is shifting to the downside and that the next meaningful move would be to the downside. At the same time, upside mobility should be limited to below 1.1500. This next move to the downside, if it transpires, would be labeled a wave (iii).

    Third wave moves tend to be the longest and strongest. This viewpoint also places the EUR/USD in a similar situation to the Sterling, which we wrote about last week.

    A break below 1.0975-1.1000 builds the case that a third wave is unfolding.

    2. Alternate X Wave Leading to a Bullish Move
    There is an alternative view we are tracking as well. Remember, when trading with Elliott Wave Theory we are never certain of the wave picture until the waves are finished. Therefore, we must bring a probabilistic approach and realize there are many wave counts in play and that we let the market exclude certain counts because they break one or more of Elliott’s rules.

    How to Build and Trade Strategies-bullish0.png


    Since the March 2015 low, prices have been overlapping higher in complex fashion as a correction. Though the preferred wave count is that a resumption of the trend continues lower to retest the March lows, there is an alternative count that needs to be considered.

    This wave picture is a bit trickier because so long as prices are above 1.08, this picture still is possible and ultimately suggests a retest of the 1.1700 high. In other words, wave (x) could sell off towards 1.08 and keep the door open for an eventual visit to 1.17.

    In these scenarios, it is important to look at the internal structure of the waves and seek out equal wave patterns or overlapping waves that suggest the corrective nature would continue higher. To date, this exists and we need to keep it in mind.

    Again, this alternate suggests we form a partial retracement lower before one final move higher to retest 1.17.

    Now that we have a preferred and alternate count in mind, what does sentiment and volume suggest that might sway our bias?

    Conclusion

    How to Build and Trade Strategies-bullish1.png


    The wave pictures are suggesting we could soon embark upon a wave 3 sell off. Therefore, a break below 1.1085 or a rise up to 1.15 would spark short trades. And we have a bullish alternative, a meaningful rise above 1.15 or a sell off towards 1.11 that is not impulsive would shift the scales towards entering long the market.

    ---Written by Jeremy Wagner, Head Trading Instructor, DailyFX EDU

    more...
    Premium Trading Forum: subscription || The Forex Guide to Fundamentals Fundamentals
    Trading blogs || My blog

  6. #66
    member ForeCastle's Avatar
    Join Date
    Apr 2013
    Posts
    1,077
    Blog Entries
    236

    How to Code Your Own Algo Trading Robot

    How to Build and Trade Strategies-ava.jpg


    How to Code Your Own Algo Trading Robot

    What an Algorithmic Trading Robot Is and Does

    At the most basic level, an algorithmic trading robot is a computer code that has the ability to generate and execute buy and sell signals in financial markets. The main components of such a robot include entry rules that signal when to buy or sell, exit rules indicating when to close the current position, and position sizing rules defining the quantities to buy or sell.

    The Main Tools

    Obviously, you’re going to need a computer and an Internet connection. After that, a Windows or Mac operating system will be needed to run MetaTrader 4 (MT4)—an electronic trading platform that uses the MetaQuotes Language 4 (MQL4) for coding trading strategies. Although MT4 is not the only software one could use to build a robot it has a number of significant benefits.

    Algorithmic Trading Strategies

    It is important to begin by reflecting on some core traits that every algorithmic trading strategy should have. The strategy should be market prudent in that it is fundamentally sound from a market and economic standpoint. Also, the mathematical model used in developing the strategy should be based on sound statistical methods.

    Next, it is crucial to determine what information your robot is aiming to capture. In order to have an automated strategy, your robot needs to be able to capture identifiable, persistent market inefficiencies. Algorithmic trading strategies follow a rigid set of rules that take advantage of market behavior and thus, the occurrence of a one-time market inefficiency is not enough to build a strategy around. Further, if the cause of the market inefficiency is unidentifiable, then there will be no way to know if the success or failure of the strategy was due to chance or not.

    The Bottom Line

    Considering that Richard Dennis, the legendary commodity trader, taught a group of students his personal trading strategies who then went on to earn over $175 million in just five years, it is completely possible for inexperienced traders to be taught a strict set of guidelines and become successful traders. However, this is one extraordinary example and beginners should definitely remember to have modest expectations.

    In order to be successful it is important to not just follow a set of guidelines but to understand how those guidelines are working. Liew stresses that the most important part of algorithmic trading is “understanding under which types of market conditions your robot will work and when it will break down,” and “understanding when to intervene.” Algorithmic trading can be rewarding but the key to success is understanding. Any course or teacher promising high rewards with minimal understanding should be a major warning sign.

    the source
    Premium Trading Forum: subscription || The Forex Guide to Fundamentals Fundamentals
    Trading blogs || My blog

  7. #67
    member ForeCastle's Avatar
    Join Date
    Apr 2013
    Posts
    1,077
    Blog Entries
    236

    GBP/USD Ranges ahead of US NFP Data

    The GBP/USD is trading today inside of a defined 55-pip range. Prices are currently turning lower after testing range resistance, which is found at the R3 Camarilla pivot at a price of 1.4403. So far price action has traversed today’s range once, and if market conditions continue traders may look for GBP/USD to again trade towards support. Range support is denoted in the graph above by the S3 pivot, which is located at a price of 1.4348.

    How to Build and Trade Strategies-gbpusd-h4-alpari-limited-2.png


    While many traders are expecting breakouts to develop during tomorrows NFP (Non-Farm Payrolls) news event, today traders should also continue to monitor both the R4 and S4 pivot points for a higher high or lower low. A move above 1.4430 at today’s R4 pivot point would signal a bullish breakout. In this scenario, traders may extrapolate 1X today’s 55 pip trading range to find preliminary breakout targets near 1.4485. Alternatively, a bearish breakout for the day begin beneath the S4 pivot at 1.4321. After extrapolating 1X the range, this places initial bearish targets at 1.4266.

    more...
    Premium Trading Forum: subscription || The Forex Guide to Fundamentals Fundamentals
    Trading blogs || My blog

  8. #68
    member ForeCastle's Avatar
    Join Date
    Apr 2013
    Posts
    1,077
    Blog Entries
    236

    AUD/USD Trades to Weekly Highs

    The AUD/USD is currently trading to new weekly highs, and is poised to close higher for the fourth consecutive session. This initial surge in price higher was predicated on a technical move through .7253, which is represented in the graph below using the 200 day moving. Normally a move above the 200-day MVA suggests the beginnings of a bullish trend. Knowing this, day traders may then elect to move in to smaller time frames and look for signs of the trend continuing.

    How to Build and Trade Strategies-audusd-d1-alpari-limited.png


    more...
    Premium Trading Forum: subscription || The Forex Guide to Fundamentals Fundamentals
    Trading blogs || My blog

  9. #69
    member ForeCastle's Avatar
    Join Date
    Apr 2013
    Posts
    1,077
    Blog Entries
    236

    Gold Prices Grind Sideways in a Triangle

    Gold prices have been consolidating in sideways fashion for the past month. With limited new information from the Fed regarding the status of the next rate hike, gold prices have found a comfortable range to trade in.

    How to Build and Trade Strategies-xauusd-h4-metaquotes-software-corp-2.png


    Technically speaking, this range could be taking the shape of a triangle. This pattern suggests we’ll look for lower levels to buy into. It is not uncommon for prices to briefly penetrate the triangle’s trend lines. Therefore, the risk can be set off the July 21 low near $1311.

    [image]

    more...
    Premium Trading Forum: subscription || The Forex Guide to Fundamentals Fundamentals
    Trading blogs || My blog

  10. #70
    member ForeCastle's Avatar
    Join Date
    Apr 2013
    Posts
    1,077
    Blog Entries
    236

    GBP/USD Declines on BOE Rate Decision

    The GBP/USD is trading near daily lows after the BOE (Bank of England) kept key interest rates flat at 0.25%. While it was expected that rates would be kept flat, the Pound is still losing ground to the majors as traders are speculating that rates may be cut in the future. Technically the GBP/USD is currently finding support at a short-term retracement value near 1.3193. This area is represented in the graph below as a 61.8% retracement from yesterday’s low of 1.3138 to the high of 1.3278. Now traders will wait to see if prices recover here, or if the Cable is set to decline further in the short term.

    GBP/USD, 30 Minute Chart with Breakout

    How to Build and Trade Strategies-gbpusd-m30-alpari-limited.png


    more...
    Premium Trading Forum: subscription || The Forex Guide to Fundamentals Fundamentals
    Trading blogs || My blog

Page 7 of 10 FirstFirst ... 5 6 7 8 9 ... LastLast

Tags for this Thread

Bookmarks

Posting Permissions

  • You may not post new threads
  • You may not post replies
  • You may not post attachments
  • You may not edit your posts
  •