

TechnoMeter
Price Pattern - Watch Ahead of the FOMC
by
, 12-16-2014 at 10:22 PM (1298 Views)
Talking Points
- SPX testing key downside threshold
- EUR/USD overcomes key Gann resistance
- USD/JPY cracks important downside pivot
Price & Time Analysis: EUR/USD
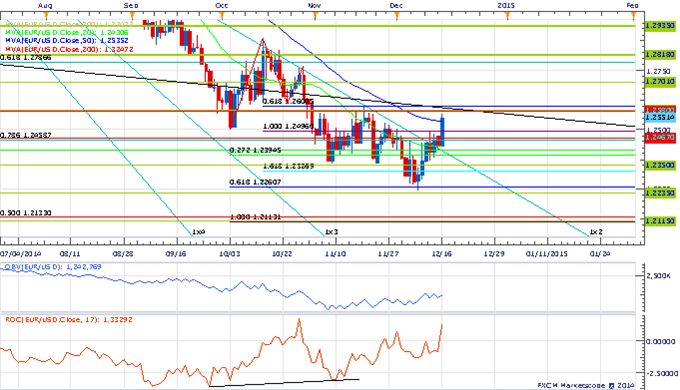
- EUR/USD has moved steadily higher since finding support early last week ahead of the 15th square root relationship of the years high in the 1.2250 area
- A daily close over the 2nd square root relationship of the years low at 1.2470 will turn us positive on the exchange rate
- Weakness below 1.2430 is needed to reinstill downside momentum in the rate
- A very minor turn window is eyed early next week
EUR/USD Strategy: Square. Will look to buy on weakness if spot close over 1.2470.
Price & Time Analysis: USD/JPY
Instrument Support 2 Support 1 Spot Resistance 1 Resistance 2 EUR/USD 1.2430 1.2470 1.2250 1.2585 1.2605
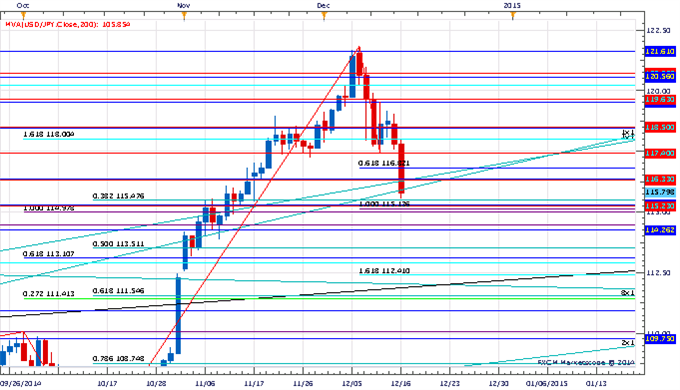
- USD/JPY broke below the 4th square root relationship of the years high earlier this morning and aggressive weakness has followed
- Our near-term trend bias is lower USD/JPY while below 117.40
- Important support is eyed at 115.45 and 115.00 and weakness below these level is needed to prompt a much more serious unwind
- A minor turn window is seen around the end of the week
- A close above 117.40 would turn us positive on the exchange rate
USD/JPY Strategy: Like the short side while under 117.40
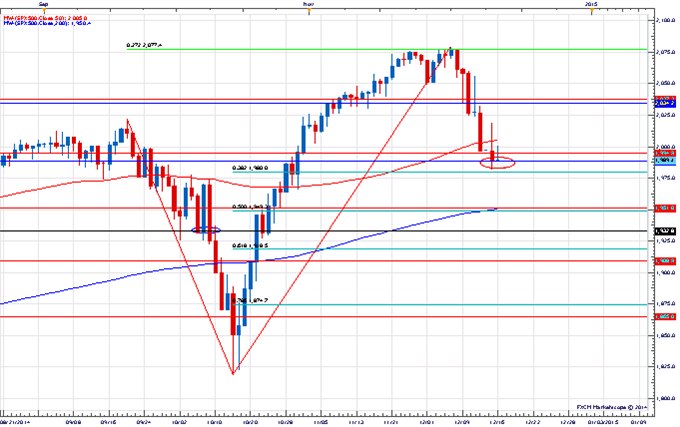
Focus Chart of the Day: S&P 500
Instrument Support 2 Support 1 Spot Resistance 1 Resistance 2 USD/JPY 115.00 115.45 116.20 116.80 117.40
As chaotic as the S&P 500 has been over the past few months it has also been rather symmetrical. For instance, the low in October at 1820 came right at the 161.8% projection of the early September decline. The high of the year came right at a convergence of the 6th square root relationship of the October low and the 127% extension of the September/October decline. On Tuesday the index closed right on the 2nd square root relationship of the years high at 1988. Those who read Price & Time with any regularity will know that we pay a lot of attention to 2nd square root relationships as they are a good barometer for determining if a market is about to undergo a more severe correction. In early October the 2nd square root relationship of the years then high in the S&P 500 was 1932 (black line circled in blue on chart). The market probed this level for over a week before finally closing below it on October 9th. A 100 point move lower followed. We bring all this up to illustrate the fact that we think the S&P 500 is currently at a critical level. A successful hold of 1988 could easily prompt a run for the roses into year-end. Theoretically there is still time. A close under 1988, on the other hand, will turn the technical picture convincingly negative and risk a potentially serious decline over the next few weeks.
More...


Tags:
None

- Categories
- Uncategorized
 Email Blog Entry
