

TechnoMeter
Chart Patterns - S&P 500 Breaks Monthly Uptrend, Drops Most Since Mid-October, Gold Mounts Sharp Recovery, Crude Oil Snaps 5-Day Loss Streak
by
, 12-03-2014 at 01:01 AM (1143 Views)
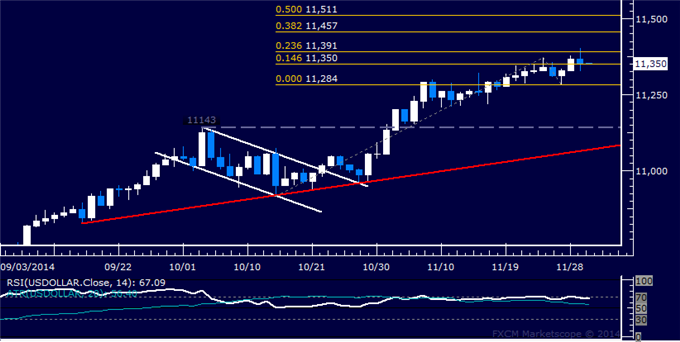
US DOLLAR TECHNICAL ANALYSIS Prices stumbled after spiking to a new five-year high, finishing the day with a modest loss. Near-term support is at 11350, the 14.6% Fibonacci expansion, with a break below that on a daily closing basis exposing the November 27 low at 11284. Alternatively, a turn above the 23.6% Fib at 11391 opens the door for a challenge of the 38.2% expansion at 11457.
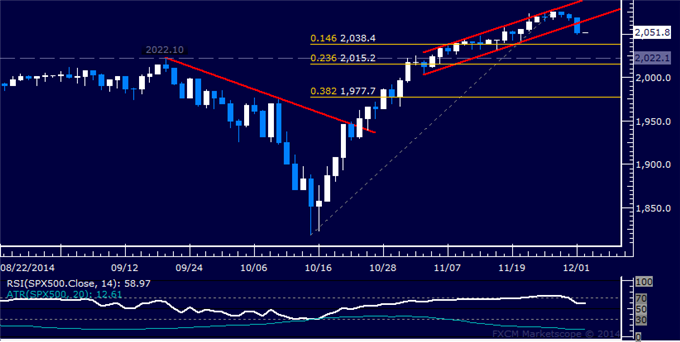
S&P 500 TECHNICAL ANALYSIS Prices turned sharply lower, producing the largest daily drawdown since mid-October. Sellers now aim to challenge the 14.6% Fibonacci retracement at 2038.40, with a break below that on a daily closing basis exposing the 2015.20-22.10 area marked by the 23.6% level and the September 19 high. Alternatively, a turn above channel bottom support-turned-resistance at 2064.70 targets the November 23 high at 2075.90.
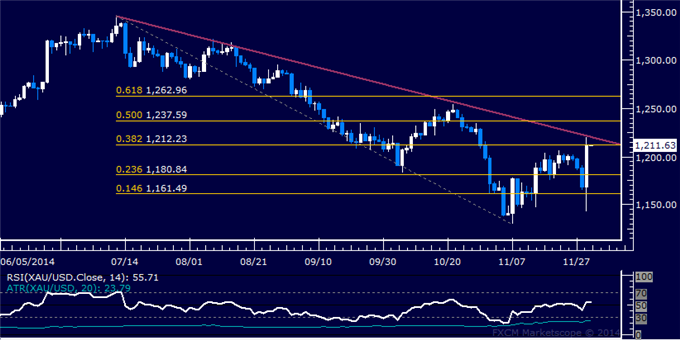
GOLD TECHNICAL ANALYSIS Prices vaulted aggressively higher after tapping a three-week low. Near-term resistance is in the 1212.23-19.41 area marked by the 38.2% Fibonacci retracement and a falling trend line set from early July. A break above this barrier exposes the 50% level at 1237.59. Alternatively, a reversal below support at 1180.84, the 23.6% Fib, aims for the 14.6% retracement at 1161.49.
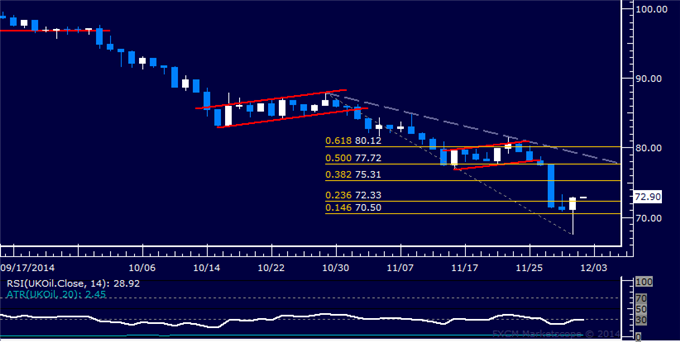
CRUDE OIL TECHNICAL ANALYSIS Prices recoiled upward after hitting the lowest levels since 2009, snapping a five-day losing streak. Near-term resistance is at 75.31, the 38.2% Fibonacci retracement, with a break above that on a daily closing basis exposing the 50% level at 77.72. Alternatively, a reversal below the 23.6% Fib at 72.33 aims for the 14.6% retracement at 70.50.
--- Written by Ilya Spivak, Currency Strategist for DailyFX.com
More...


Tags:
None

- Categories
- Uncategorized
 Email Blog Entry
