

TechnoMeter
Weekly Technical Analysis for EURUSD, NZDUSD, GBPUSD, AUDUSD, USDJPY, USDCAD and USDCHF
by
, 09-21-2014 at 11:40 PM (1365 Views)
- EURUSD 13 year trendline just below 1.2800 (USDCHF at 30 year trendline!)
- USDJPY nears 13 year trendline
- NZDUSD at midpoint of 2011-2014 range
EUR/USD
Weekly
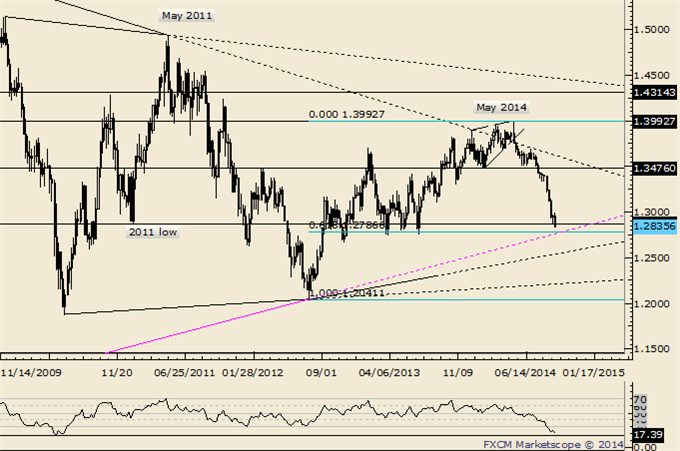
-Long term, a failed breakout and top would keep with the pattern of 3 year cycle tops. The break of 1.3476 completed a topping process with targets of 1.3294 (origin of diagonal), 1.3209 (2 equal legs), and 1.3012 (head and shoulders target).
-EURUSD crashed through all the objectives. I was surprised that 1.3020 (50% from 2012) didnt influence but an even bigger zone rests slightly below the current level. The zone in question is defined by long term trendline support along with the 2011 and 2013 lows (circled) at 1.2873 and 1.2744. These levels straddle the 61.8% retracement of the advance from the 2012 low at 1.2787. The trendline that extends from the 2001 and 2013 lows (pink line) is at 1.2771 next week. Bottom line; EURUSD has entered huge support and I expect a bounce (corrective recovery).
GBP/USD
Weekly
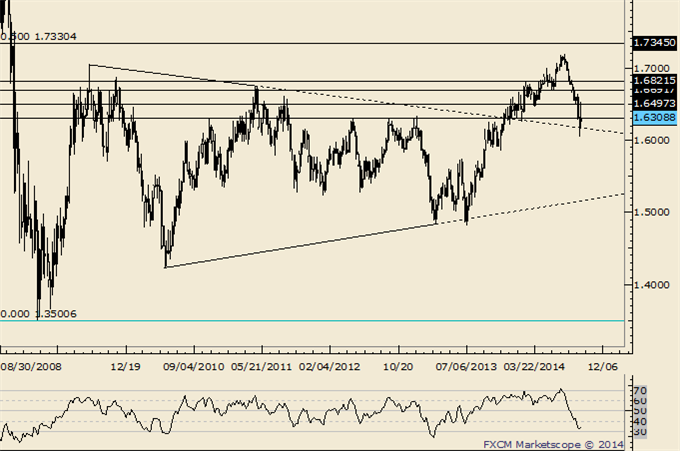
-Of note is a weekly outside reversal and weekly RSI rolling over from above 70 this week. Prior instances of RSI rolling over (2004, 2006, and 2007) from above 70 indicated tops of at least several months. Major support comes in from the 3 peaks in 2012 and this years low at 1.6250-1.6340.
-Near term momentum (daily RSI) is at a level that has only been reached several times in recent history, 2012 (one day) and 2008 (throughout August and September and once in October). Old triangle resistance came in as support this week (as it did in December 2013 and February this year and the rally ended up failing near the 8/15 low. A few more weeks of sideways action would do well to reset the market for another decline.
AUD/USD
Weekly
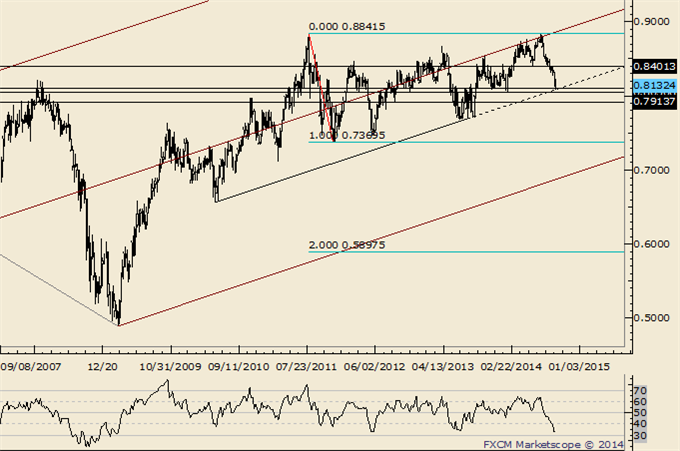
-The combination of the .9400 figure and weekly RSI failing near 60 indicates a lot of overhead to punch through. Since the 2011 top, each RSI failure near 60 has led to a top or topping process (range for several weeks then a breakdown...that may be the case now).
-AUDUSD broke down from a head and shoulders top on 9/9. The target was reached 4 days after the pattern completed. Weakness has extended below the line that extends off of the 2008 and 2014 lows, warning of something much more significant on the downside.
NZD/USD
Weekly
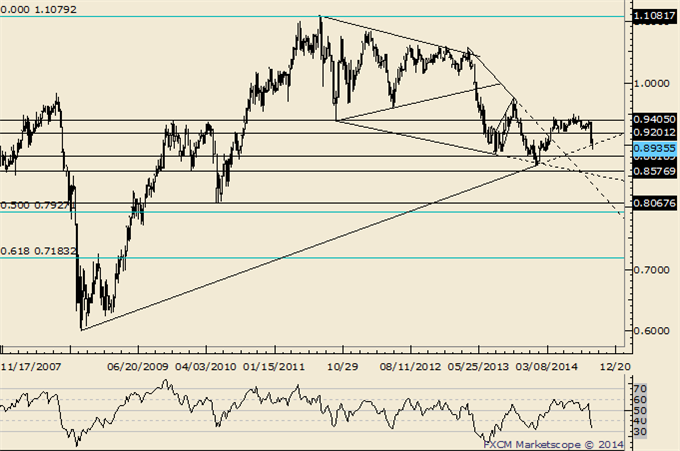
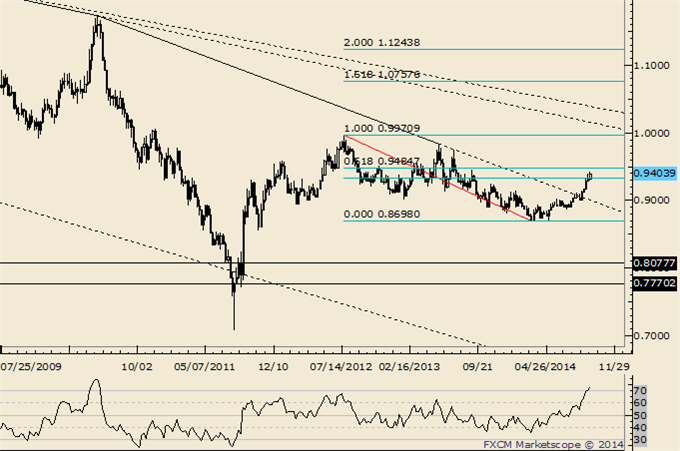
-Dont forget about the line that extends off of the 1996 and 2007 highs. That line crosses through the 2008, 2011, and highs as well. In 2011 (record free float high), the rate surged through the line in late July before topping on August 1st. The rate reversed this week from pips below the record high and above the mentioned line.
-Above .8534 is needed in order to suggest that at least a minor low is in place. Look lower as long as price is below that level. NZDUSD has entered a support area defined by a trendline, a number of former inflection points (including the 2007 high at .8108) and the midpoint of the 2011-2014 range (.8102). The level could offer several weeks of relief.
USD/JPY
Weekly
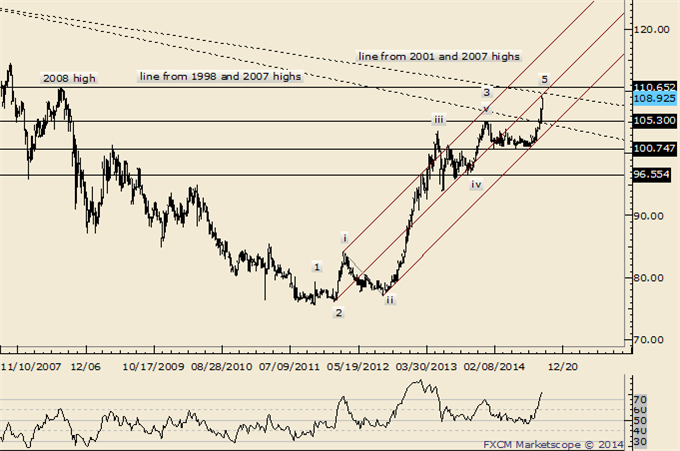
-Treat wave 4 as complete as long as price is above 102.50 (103.00/30 is support). That means new highs in wave 5 (then risk of a major decline but dont forget that 5ths can extend). 104.75 is a near term target.
-Focus is now on expansion targets at 108.33 and 110.12 as long as price is above 103.50. The first target has already been reached. The latter level isnt far from the August 2008 high at 110.65. There is also a trendline that extends from the 2001 and 2007 highs at the current level. 106.80-107.40 is support. At this point, USDJPY would have to break 105 to do real damage to the trend.
USD/CAD
Weekly
-USDCAD has fallen apart which ironically means it is probably going to find some sort of low soon. The rate is nearing important price levels. The 2011 high at 1.0657 and current year open at 1.0634 are possible supports. The line that extends off of the 2012 and September 2013 lows is at about 1.0607 next week. This level is in line with the July 2013 high at 1.0608. USDCAD ended up finding low at 1.0620.
-The USDCAD dip from 1.0997 found support at the 50% retracement of the 1.0620-1.0997 advance (the 61.8% is at 1.0764). The hold is a positive sign and I lean towards the upside.
USD/CHF
Weekly
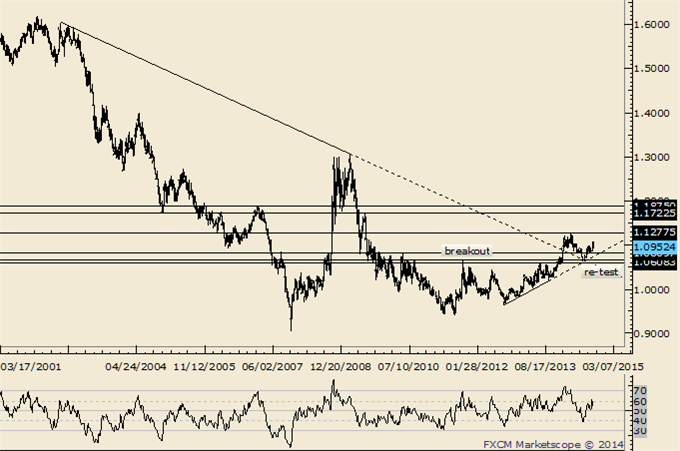
-There is a trendline that extends off of the 1985 and 2001 highs near .9400. The nearly 30 year trendline splits the 50% and 61.8% retracements of the decline from the 2012 high (.9335 and .9485). USDCHF is trading at the 30 year trendline now. Like EURUSD, the rate is at a level where one would expect at least a period of consolidation to take hold.
More...


Tags:
cycle,
key level,
resistance,
support

- Categories
- Uncategorized
 Email Blog Entry
