Page 6 of 70 FirstFirst ... 4 5 6 7 8 16 56 ... LastLast
Results 51 to 60 of 698
Like Tree1Likes

Tifia Daily Market Analytics

This is a discussion on Tifia Daily Market Analytics within the Analytics and News forums, part of the Trading Forum category; AUD/USD: attention to retail sales data 30/05/2017 Current dynamics The Australian dollar has recently remained one of the weakest against ...


  1. #51
    Senior Member TifiaFX's Avatar
    Join Date
    Mar 2017
    Posts
    697
    AUD/USD: attention to retail sales data
    30/05/2017

    Current dynamics

    The Australian dollar has recently remained one of the weakest against the US dollar. Despite the fact that earlier in the month the RBA retained the interest rate in Australia at 1.5%, among market participants the opinion is growing that the RBA can go on reducing the interest rate in the country due to a record household debt, a record low salary growth and a weak market Labor. Domestic consumption makes a big contribution to GDP growth. In view of the weak growth in consumption in Australia, some economists forecast zero or insignificant GDP growth for the first quarter.
    From the protocol published at the beginning of the month since the last meeting of the RBA, it follows that the bank as a whole is still optimistic about the situation in the Australian economy. However, according to the bank, "an increase in the interest rate will complicate the correction of the economy."
    On Thursday, important macro data for Australia will be published, including retail sales for April and companies' investments for the first quarter. A slight, almost zero growth in the level of retail sales is expected in April (+ 0.3%). Another weak data on sales will strengthen the opinion of market participants that the interest rate in Australia will soon be lowered.
    The RBA's restrained position on the rate in Australia and, conversely, the Fed's positive view on the process of raising the interest rate in the US strengthen the position of sellers of the Australian dollar against the US dollar.
    The negative medium-term dynamics of the AUD / USD pair remains.

    Support and resistance levels
    Indicators OsMA and Stochastics at different time intervals show mixed dynamics.
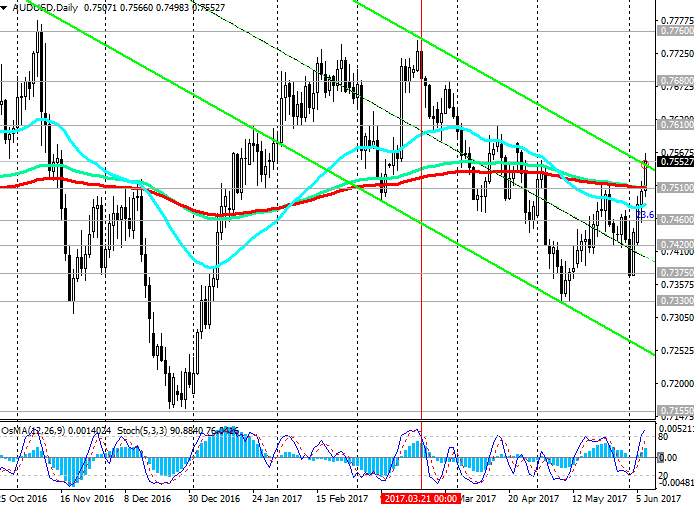
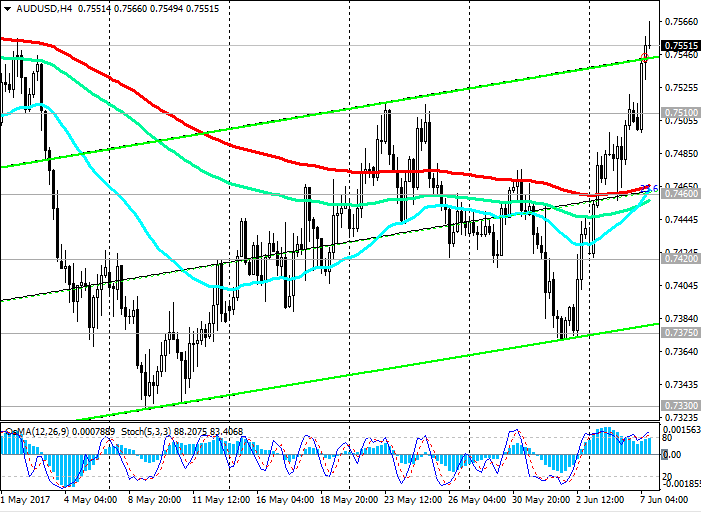
    Nevertheless, the pair AUD / USD continues to remain within the downward channel on the daily chart, trading below the important resistance levels 0.7460 (Fibonacci level of 23.6% correction to the wave of decline of the pair since July 2014), 0.7470 (EMA200 on the 4-hour chart), 0.7510 (EMA200 on the daily chart).
    Fundamental factors create the prerequisites for further reduction of the AUD / USD pair.
    The nearest target in case of further decline of the pair will be the level of 0.7330 (November minima and the bottom line of the ascending channel on the weekly chart). The next target in case of breakdown of this support level is the level of 0.7155 (May, December minima of 2016). The minimum wave of the last global decline of the pair since July 2014 is close to the level of 0.6830.
    The alternative scenario is related to the return of the pair AUD / USD to the zone above the level of 0.7510 and further growth to the resistance levels of 0.7610, 0.7680, 0.7760, 0.7840 (Fibonacci retracement of 38.2% correction to the fall wave from July 2014).
    Meanwhile, the negative dynamics of the pair AUD / USD prevails.

    Support levels: 0.7420, 0.7330, 0.7300, 0.7200, 0.7155
    Resistance levels: 0.7460, 0.7470, 0.7510, 0.7545, 0.7570, 0.7610, 0.7680

    Trading Scenarios

    Sell Stop 0.7410. Stop-Loss 0.7465. Take-Profit 0.7330, 0.7300, 0.7200, 0.7155
    Buy Stop 0.7465. Stop-Loss 0.7410. Take-Profit 0.7500, 0.7535, 0.7545, 0.7570, 0.7600


    *) Actual and detailed analytics can be found on the Tifia website at tifia.com/analytics

  2. #52
    Senior Member TifiaFX's Avatar
    Join Date
    Mar 2017
    Posts
    697
    EuroStoxx50: decline in the fifth consecutive session
    31/05/2017
    Current dynamics

    It seems that the main European stock indexes can finish this week in a negative territory. The election of the president of France is already behind, and the positive momentum begins to fade as weak macro statistics from the Eurozone arrive.
    ECB President Mario Draghi earlier this week confirmed that economic recovery is accelerating, but core inflation is still too weak to change the monetary policy of the bank. Here and today in the Eurozone came some macro statistics, which confirm the words of Mario Draghi. So, the preliminary index of consumer prices (CPI) of the Eurozone in May grew by 1.4% (against the forecast of + 1.5% and + 1.9% in April). Unemployment in the Eurozone in April fell by 0.1%, but still remains high (9.3%).
    Decrease in indices is observed throughout the world. So, the US stock indexes on Tuesday fell under the pressure of shares of oil and gas and financial companies. The oil and gas subindex in the S & P500 showed the worst results for the day, falling by 1.3%. The European StoxxEurope600 index lost another 0.3% on Tuesday, with banks and insurance companies leading the decline. The EuroStoxx50 index was down yesterday for the fifth consecutive session.
    At the beginning of today's European trading session, the EuroStoxx50 index is trading in a narrow range near the mark of 3554.0, however, is under pressure from incoming weak macro statistics for the Eurozone.
    As has been repeatedly announced by the leaders, the ECB is unlikely to go on winding up the extra soft monetary policy at the moment. The ECB management believes that the growth of the Eurozone economy is still weak enough to begin curtailing the QE program in the Eurozone. So far, this supports European indices. And still, among investors, there is talk that the ECB may announce the curtailment of the QE program in the Eurozone. The ECB's next meeting on monetary policy will be held on June 8. As ECB leaders said earlier, the rate hike will not begin earlier than the quantitative easing program, at which the European Central Bank will buy European assets worth 60 billion euros a month, will be completed.

    Support and resistance levels
    At the beginning of the month against the backdrop of the election of the new French president, the EuroStoxx50 index reached a new annual maximum near the mark of 3680.0. After that, a gradual decline in the index started, and at the moment the EuroStoxx50 index is traded at the short-term support level of 3550.0 (EMA144 and the bottom line of the uplink on the 4-hour chart).
    Indicators OsMA and Stochastics on the 4-hour, daily, weekly charts went to the side of sellers.
    If the EuroStoxx50 index falls further, the next target will be the support level of 3525.0 (EMA200 on the 4-hour chart, EMA50 on the daily chart).
    The level is strong enough. In general, the positive dynamics of the EuroStoxx50 index remains. In case of rebound from the level of 3525.0, the growth of the EuroStoxx50 index may resume. At least, the ECB's propensity to continue the extra soft monetary policy contributes to this.
    Medium-term short positions will become relevant only after the EuroStoxx50 index falls below the level of 3500.0 (March and April highs on the eve of the first round of presidential elections in France). The reduction targets will be support levels 3435.0 (Fibonacci level 23.6% correction to the wave of growth since June 2016), 3380.0 (EMA144), 3325.0 (EMA200 on the daily chart).
    Support levels: 3525.0, 3500.0, 3435.0, 3380.0, 3325.0
    Resistance levels: 3580.0, 3680.0, 3700.0

    Trading Scenarios

    Sell Stop 3520.0 Stop-Loss 3590.0. Take-Profit 3500.0, 3435.0, 3380.0, 3325.0
    Buy Stop 3590.0. Stop-Loss 3520.0. Take-Profit 3600.0, 3680.0, 3700.0


    *) Actual and detailed analytics can be found on the Tifia website at tifia.com/analytics

  3. #53
    Senior Member TifiaFX's Avatar
    Join Date
    Mar 2017
    Posts
    697
    AUD/USD: Against the background of weak macro data from China
    01/06/2017

    Current dynamics

    After extremely volatile trading, the Australian dollar fell sharply during the Asian session today. After the release of optimistic data on retail sales in Australia in April (+ 1.0% vs. the forecast + 0.3%), the Australian currency strengthened. This is the largest monthly increase in more than two and a half years. However, soon the Australian dollar fell sharply after China's production report, which turned out to be weak, was published. The index of supply managers (PMI) for China's manufacturing sector from Caixin Media Co. In May, it fell to 49.6 (against 50.3 in April).
    China is Australia's largest trade and economic partner and a consumer of Australian iron ore and coal. The growth of the Australian economy still depends heavily on the commodity sector. And the decline in commodity prices, as well as the slowdown in the economy of the Australian partner countries, have a strong impact on the Australian dollar, undervaluing its value.
    At the same time, despite the unexpected growth in retail sales in April, other statistics still indicate a limited increase in consumer spending. Domestic consumption makes a big contribution to GDP growth. In view of the weak growth in consumption in Australia, some economists forecast zero or insignificant GDP growth for the first quarter.
    The consumer confidence index is weak, salaries are growing slowly, and purchasing power is limited. House prices also began to decline, which unleashes the hands of the RBA in the matter of lowering the interest rate.
    Earlier this month, the RBA retained its interest rate in Australia at 1.5%. However, the RBA can go on reducing the interest rate in the country due to record household debt, a record low salary growth and a weak labor market.
    At the same time, the US dollar is showing growth today in the foreign exchange market.
    Despite the problems that have arisen with the administration of the US President in implementing the plans for a new economic policy, investors focus on positive macro statistics coming from the United States.
    President of the Fed-San Francisco and FOMC member John Williams today expressed confidence that the strengthening of the US economy justifies "three or four rate hikes" this year.
    Thus, the difference between the monetary policy of the Fed and the RBA is the main driver for reducing the pair AUD / USD.
    Today we are waiting for data from the USA. Between 12:15 and 14:00 (GMT) a whole block of important macroeconomic indicators is published. Among the data - the index of business activity ISM in the manufacturing sector (in May) and the index of gradual acceleration of inflation. We expect weaker indicators than in the previous month, which could negatively affect the dollar. Nevertheless, in absolute terms, the figures look very positive. Also worth paying attention to the report of ADP on the level of employment in the private sector of the US for May. Investors often consider it a harbinger of the NFP, although no direct correlation with Non-Farm Payrolls is usually noted. Strong data positively affects the dollar. Here the growth is expected (185,000 versus 177,000 in April), which will support the US dollar. In general, macro statistics are expected to be very positive, which will have a positive impact on the US dollar, including in the pair AUD / USD.

    Support and resistance levels
    Since mid-March, the AUD / USD pair is actively declining in the downlink on the daily chart. The pair AUD / USD is below the important resistance levels 0.7510 (EMA200 on the daily chart), 0.7460 (Fibonacci level of 23.6% correction to the wave of decline of the pair since July 2014, as well as the upper limit of the descending channel on the daily chart, EMA200 on the 4-hour Chart).
    The negative dynamics prevails.
    Indicators OsMA and Stochastics on the 1-hour, 4-hour, daily charts went to the side of sellers.
    The closest target in case of further decline of the pair will be the level of 0.7330 (November, May minima and the bottom line of the rising channel on the weekly chart). The next target in case of breakdown of this support level is the level of 0.7155 (May, December minima of 2016). The minimum wave of the last global decline of the pair since July 2014 is close to the level of 0.6830.
    The alternative scenario is related to the return of the pair AUD / USD to the zone above the level of 0.7510 and further growth to the resistance levels of 0.7610, 0.7680, 0.7760, 0.7840 (Fibonacci retracement of 38.2% correction to the fall wave from July 2014).
    Fundamental factors create the prerequisites for further reduction of the AUD / USD pair.

    Support levels: 0.7380, 0.7330, 0.7300, 0.7200, 0.7155
    Resistance levels: 0.7420, 0.7460, 0.7510, 0.7545, 0.7570, 0.7610, 0.7680

    Trading scenarios

    Sell Stop 0.7380. Stop-Loss 0.7420. Take-Profit 0.7330, 0.7300, 0.7200, 0.7155
    Buy Stop 0.7420. Stop-Loss 0.7380. Take-Profit 0.7460, 0.7510, 0.7535, 0.7545, 0.7570, 0.7600


    *) Actual and detailed analytics can be found on the Tifia website at tifia.com/analytics

  4. #54
    Senior Member TifiaFX's Avatar
    Join Date
    Mar 2017
    Posts
    697
    XAG/USD: pending publication of data from the labor market
    02/06/2017
    Current dynamics

    The focus of attention of all participants of financial markets today is the publication of data from the US labor market, which is scheduled for 12:30 (GMT). Very positive data are expected. Thus, according to the forecast it is expected that the growth of the average hourly wage will be 0.2% (against 0.3% in April), unemployment will not grow (4.4% against 4.4% in April).
    But perhaps the main focus will be on Non-Farm Payrolls (the number of new jobs created in the non-agricultural sector of the US economy).
    Yesterday Automatic Data Processing Inc. And Moody's Analytics reported data that in May the number of jobs in the private sector in the US increased by 253,000, which is significantly better than the forecast (185,000 and 174,000 in the previous month). This is the highest growth in the number of jobs since 2014.
    Recent positive macro data from the US significantly strengthened investors' opinion that the Fed will raise the interest rate by 0.25% to 1.25% on June 13-14. So, positive ADP data on employment contributed to the growth of the dollar and the yield of treasury bonds. The index of the dollar WSJ rose by 0.2%, and the yield of 10-year Treasury bonds rose to 2.225% from 2.198% recorded on Wednesday.
    Investors are not so much worried about slipping into plans to reform the tax system and stimulate budget spending in the US, focusing on macroeconomic indicators. So, the index of business activity ISM published in the manufacturing sector (for May) released yesterday with a value of 54.9 (the forecast was 54.5 and 54.8 in April). The index of business activity ISM in the manufacturing sector of the US economy is an important indicator of the state of the American economy as a whole. Along with the data from ADP, the publication of the ISM index further stimulated the closing of short positions in the dollar on the eve of today's NFP publication.
    The Fed pays particular attention to data on the number of jobs, and by many investors they are perceived as the most important indicator of the state of the American economy. Now, many investors expect the Fed to raise rates more rapidly.
    That's the president of the Fed-San Francisco and FOMC member John Williams today, that the strengthening of the US economy justifies "three or four rate hikes" this year.
    If the data from the labor market, which are published today, really "do not disappoint", then the dollar will receive a powerful positive impulse before the Fed meeting on June 13-14. Then the market participants will have no doubt that the Fed will raise the rate at this meeting. Higher interest rates make dollar assets more attractive to investors. Precious metals, which do not bring interest income, become cheaper in the conditions of the rate increase; the cost of their acquisition and storage is growing.
    With disappointing data on the US labor market, the dollar may weaken significantly in the foreign exchange market, and demand for precious metals, particularly silver, with the continuing political tension in the US around President Donald Trump will grow again.

    Support and resistance levels
    The pair XAG / USD could not gain a foothold above the key resistance level of 17.35 (EMA200 and the upper limit of the descending channel on the daily chart) and the third day is falling.
    Indicators OsMA and Stochastics on the 4-hour, daily, weekly charts went to the side of sellers.
    The pair XAG / USD is in the zone of short-term support levels 17.18 (EMA200 on the 1-hour chart), 17.14 (EMA200 on the 4-hour chart). If the NFP data prove to be strong, the pair XAG / USD will break through the levels of 17.18, 17.14 and go to the support level of 16.85 (Fibonacci level of 23.6% of corrective growth to fall in the pair since August 2016 and level 20.59) with the prospect of a downward movement - 15.72 (low of 2016).
    You can return to consideration of long positions after fixing a pair above the level of 17.35.
    Support levels: 17.18, 17.14, 16.85, 16.20, 15.72
    Resistance levels: 17.35, 17.58, 18.17, 18.55, 18.75

    Trading Scenarios

    Sell Stop 17.10. Stop-Loss 17.28. Take-Profit 17.00, 16.85, 16.20, 15.72
    Buy Stop 17.28. Stop-Loss 17.10. Take-Profit 17.35, 17.58, 18.17, 18.55, 18.75


    *) Actual and detailed analytics can be found on the Tifia website at tifia.com/analytics

  5. #55
    Senior Member TifiaFX's Avatar
    Join Date
    Mar 2017
    Posts
    697
    GBP/USD: on the eve of parliamentary elections
    05/06/2017

    Current dynamics

    The PMI index (or the index of business activity) for the UK services sector in May was 53.8 (the forecast was 55.0, which is lower than the April index of the index 55.8). This index is an indicator of the economic situation in the service sector of Great Britain. The PMI of the UK service sector does not have such a strong impact on GDP as PMI in the manufacturing sector or the level of retail sales and consumer activity in the UK. At the same time, the decline in the PMI index for the service sector negatively affects the British currency. After the publication (08:00 GMT) of this index, the pound declined in the foreign exchange market.
    Nevertheless, the GBP / USD pair closed its sharp decline (with a gap of 30 points after the next terrorist act in Great Britain last weekend) during today's European session at the opening of today's trading day.
    Against the backdrop of the weakening dollar, the GBP / USD pair remains positive ahead of the June 8 elections to the UK Parliament.
    As you know, in mid-April, British Prime Minister Theresa May unexpectedly announced early parliamentary elections to ensure the dominant position of the Conservative Party in Parliament.
    It is likely that in these 3 days before the election to the UK Parliament the frequency of various sociological polls of the country's population will increase, which will cause an increase in the volatility in the pound trades.
    The elections, which will be held in the UK on June 8, attract the attention of investors. In the case of a significant advantage of conservatives in parliament, British Prime Minister Theresa May will probably be able to agree with the EU on more favorable conditions for Brexit. If this happens, then the pound may significantly strengthen in the foreign exchange market.
    This Thursday also will be a meeting of the European Central Bank on monetary policy, and next week will be a meeting of the Fed. It is widely expected that the Fed will raise the rate by 0.25% to 1.25%. Nevertheless, the dollar remains under pressure in the foreign exchange market. Probably, all the same, that the risks associated with the implementation of the new economic policy of President Donald Trump, as well as his statements about the desirability of a cheaper dollar, outweigh the sellers of the dollar.
    Thus, if conservatives manage to get a convincing majority in the June 8 elections, then the GBP / USD pair can significantly strengthen. Otherwise, the pound and GBP / USD pair are expected to weaken in the foreign exchange market.
    In any case, this week, especially on the eve of June 8, the pound is expected to have increased volatility with sharp movements in both directions.

    Support and resistance levels
    The GBP / USD pair is currently trading near the balance line and the level of 1.2885, through which the 200-period moving average passes on the 1-hour chart. The GBP / USD pair keeps positive dynamics, trading in the uplink on the daily chart, above the key support levels of 1.2840 (EMA200 on the 4-hour chart), 1.2800 (EMA200 and the bottom line of the rising channel on the daily chart).
    Indicators OsMA and Stochastics on the 1-hour, 4-hour, daily charts went to the side of buyers.
    In case of breakdown of the local resistance level 1.2925, the pair GBP / USD growth will resume, and the GBP / USD pair will go to the resistance levels 1.3050 (May highs), 1.3210 (Fibonacci level 23.6% correction to the GBP / USD decline in the wave, which began in July 2014 near the level of 1.7200).
    In the case of breakdown of the support level 1.2800 and further reduction in support, the level will be 1.2700 (EMA144 on the daily chart).
    Further GBP / USD dynamics will in many respects be determined by the dynamics of the dollar and the comments of the Fed, which will be sounded on June 14, after the decision on the interest rate in the US is made.
    Support levels: 1.2885, 1.2840, 1.2800, 1.2760, 1.2700, 1.2680, 1.2590, 1.2485, 1.2340, 1.2110
    Resistance levels: 1.2925, 1.3000, 1.3050, 1.3100, 1.3210

    Trading Scenarios

    Sell Stop 1.2855. Stop-Loss 1.2910. Take-Profit 1.2840, 1.2800, 1.2760, 1.2700, 1.2680, 1.2590, 1.2485, 1.2340, 1.2110
    Buy Stop 1.2910. Stop-Loss 1.2855. Take-Profit 1.2925, 1.3000, 1.3050, 1.3100, 1.3210


    *) Actual and detailed analytics can be found on the Tifia website at tifia.com/analytics

  6. #56
    Senior Member TifiaFX's Avatar
    Join Date
    Mar 2017
    Posts
    697
    XAU/USD: investors prefer safe havens
    06/06/2017
    Current dynamics

    The dollar continues to be under pressure following Friday's disappointing US labor market data for May. As you know, despite the fact that the unemployment rate in the US fell by 0.1% to a level of 4.3%, the NFP was significantly below the forecast. The number of jobs outside of US agriculture in May increased by 138,000 compared with April (the forecast was +184,000).
    Against the backdrop of a number of political and economic events that have recently occurred and are expected this week, investors prefer to withdraw their savings into safe haven assets - government bonds, yen, precious metals.
    Strengthening tensions in the Middle East around Qatar, a number of recent terrorist attacks in Britain, lower expectations of budget stimulation of the US economy, the expectation of the speech of former FBI director James Komi before the US Congress on Thursday, as well as parliamentary elections in the UK and the ECB meeting also scheduled for Thursday - here are the main geopolitical risks that increase the demand for gold and other safe assets.
    Gold enjoys strong demand even though the probability of an increase in the interest rate in the US next week is estimated by investors higher than 90%. As you know, higher interest rates make dollar assets more attractive to investors, and lead to the sale of gold. This precious metal does not bring interest income and can not compete with assets that generate such income, for example, government bonds. At the same time, the cost of acquiring gold and its storage is growing.
    And, nevertheless, the increased geopolitical risks promote active purchases of gold.
    So, at the beginning of today's European session, gold is trading near the level of 1288.00 dollars per troy ounce, which is $ 20 or 1.5% higher than the opening price of the current month.
    At the same time, the index of the dollar WSJ, which reflects the value of the US dollar against the basket of 16 other currencies, fell to a value of 88.16, approaching the levels where it was before the victory of Donald Trump in the November 8 elections.
    It is likely that before June 8, when the elections to the British Parliament and the ECB meeting on monetary policy are held, the pair XAU / USD will maintain a positive trend with a propensity for further growth.

    Support and resistance levels
    Having rebounded from the support level of 1220.00 (the lower border of the rising channel on the daily chart and the Fibonacci level of 38.2% correction to the wave of decline since July 2016), since the middle of last month the pair XAU / USD continues to grow actively within the upward channel on the daily chart.
    The nearest target and resistance level of 1292.00 (Year and April highs) can be passed to the nearest trading session. A more distant goal is the resistance level of 1305.00, just above which the upper limit of the ascending channel passes on the daily chart. The highs of the previous wave of growth of the pair XAU / USD are near the level of 1370.00.
    Indicators OsMA and Stochastics on the 4-hour, daily, weekly charts went to the side of buyers.
    The reverse scenario is related to the return of the pair XAU / USD to support level 1277.00 (Fibonacci level 61.8%) and further decrease to support levels 1257.00 (EMA200 on 4-hour chart), 1248.00 (Fibonacci level 50%). Breakdown of the key support level of 1240.00 (EMA200 on the daily chart) will increase the risks of a return to the downtrend.
    Support levels: 1277.00, 1261.00, 1257.00, 1248.00, 1240.00, 1220.00, 1200.00, 1185.00
    Resistance levels: 1292.00, 1305.00

    Trading Scenarios

    Sell Stop 1278.00. Stop-Loss 1293.00. Take-Profit 1270.00, 1257.00, 1248.00, 1240.00
    Buy Stop 1293.00. Stop-Loss 1278.00. Take-Profit 1305.00, 1400.00


    *) Actual and detailed analytics can be found on the Tifia website at tifia.com/analytics

  7. #57
    Senior Member TifiaFX's Avatar
    Join Date
    Mar 2017
    Posts
    697
    AUD/USD: GDP data supported the Australian dollar
    07/06/2017

    Current dynamics

    While all the attention of investors is concentrated these days on Europe, the Australian dollar has received powerful support today from positive macro statistics and is actively growing in the foreign exchange market. The Australian dollar strengthens in the foreign exchange market, and the AUD / USD pair has been growing for the fourth consecutive session.
    According to the data released today, Australia's GDP in the first quarter grew by 0.3% (the forecast was + 0.2%) against + 1.1% in the previous quarter and by 1.7% in annual terms (forecast was +1.5 %). The data turned out to be better than the forecast, which inspired market participants, who resumed purchases of the Australian currency, despite the fact that this is the slowest annual GDP growth rate since 2009.
    The growth of the Australian economy continues for 26 years after the recession that ended in the early 1990s. Over the years, the country's economy has become one of the most sustainable in the world.
    Nevertheless, slow growth rates of wages and incomes of the population of Australia, increased unemployment and low, according to the RBA, the growth rate of the country's GDP can not but alarm the monetary authorities and the Australian government.
    As you know, yesterday, the RB of Australia left the key interest rate unchanged at 1.50%. As it was said in the accompanying statement, "the strengthening of the Australian dollar will complicate the adjustment of the economy", and "the preservation of rates unchanged corresponds to the goals in relation to GDP, inflation". As noted in the RBA, the conditions for doing business in the country have improved, the capacity utilization has increased, however, there are other risks for the country's economy that restrain the RBA from tightening monetary policy.
    At the same time, the slowdown in China's economy, Australia's largest trade and economic partner, its high debt levels represent an external medium-term risk factor for economic growth in Australia.
    On Thursday (01:30 GMT), the Australian Bureau of Statistics will publish data on the foreign trade balance of Australia for April. A decrease in the balance surplus is expected to reach 1.91 billion Australian dollars. First of all, it is necessary to pay attention to the export data, which is the most important component of the country's budget. Reduction of the balance and export level surplus may negatively affect the quotations of the Australian dollar.
    Also on Thursday and Friday during the Asian trading session in China, published a number of important macroeconomic indicators (for May). If the data indicate deterioration in China's foreign trade balance and a slowdown in inflation, the Australian dollar may also react with a decline.

    Support and resistance levels
    The AUD / USD pair broke the key resistance level 0.7510 (EMA200, EMA144 on the daily chart) at a strong positive momentum at the beginning of the month from the support level of 0.7375 (the bottom line of the uplink on the 4-hour chart and on the weekly chart) and develops an upward trend.
    The pair AUD / USD is trading in the uplink on the weekly chart, the upper limit of which is above the resistance level of 0.7840 (the Fibonacci level of 38.2% correction to the wave of decline of the pair since July 2014).
    Indicators OsMA and Stochastics on the 4-hour, daily and weekly charts went to the side of buyers.
    The pair's growth will continue with the targets of 0.7610, 0.7680, 0.7760 (EMA144 on the weekly chart), 0.7840 (the Fibonacci level of 38.2% correction to the wave of the pair's decline since July 2014), provided the US dollar remains weak. A more distant medium-term goal in this case is the level of 0.8000 (EMA200 on the weekly chart). If the positive dynamics of the AUD / USD pair remains, this goal can be achieved by September-October of the current year.
    The reverse scenario implies a return to the descending channel on the daily chart and the resumption of the decline in the wave that began in mid-March. The breakdown of the short-term support level at 0.7460 (EMA200 on 1-hour, 4-hour charts and 23.6% Fibonacci level) will confirm this scenario. The nearest medium-term goal in case of further decline in the pair will be the level of 0.7330 (November and May lows). The next target in case of breakdown of this support level is the level of 0.7155 (May, December minima of 2016). The minimum of wave in the last global decline of the pair since July 2014 is close to the level of 0.6830.
    Support levels: 0.7510, 0.7460, 0.7420, 0.7375, 0.7330, 0.7300, 0.7200, 0.7155
    Resistance levels: 0.7570, 0.7610, 0.7680, 0.7760

    Trading Scenarios

    Sell Stop 0.7490. Stop-Loss 0.7530. Take-Profit 0.7460, 0.7420, 0.7375, 0.7330, 0.7300, 0.7200, 0.7155
    Buy Stop 0.7570. Stop-Loss 0.7530. Take-Profit 0.7600, 0.7680, 0.7760


    *) Actual and detailed analytics can be found on the Tifia website at tifia.com/analytics

  8. #58
    Senior Member TifiaFX's Avatar
    Join Date
    Mar 2017
    Posts
    697
    DJIA: US stock indexes are rising
    08/06/2017

    Current dynamics

    Despite all the volatility of foreign exchange markets and the uncertainty in the world political arena observed in recent weeks, the US stock market remains stable, as evidenced by the continued growth of major US stock indexes.
    While the index of the dollar WSJ, which reflects the value of the US dollar against 16 other currencies, declined in recent months to a level near the level of 88.00 (on Tuesday the index closed at a minimum since November 4), and the yield of 10-year US government bonds fell to the level of 2.1 % -2.2%, US stock indexes are breaking new records. So, the S & P500 index rose by 1.2% in May. DJIA and S & P500 rose for the second month in a row. But the biggest increase is demonstrated by the technological index Nasdaq, which in May grew by 2.5%, and the Nasdaq index has been growing for the seventh month in a row.
    The Dow Jones Industrial Average, which includes shares of the largest US banks, also demonstrates a stable upward trend, which began in February last year.
    Even after the publication of an ambiguous report on the US labor market, published last Friday, the main US stock indexes rose again. The unemployment rate reached a minimum in May for 16 years, down to 4.3% from 4.4% in April. In general, the report on the US labor market is favorable enough for the Fed to raise interest rates next week. The probability of this is estimated by investors at about 90%.
    "Given the good state of the economy", as President of the Federal Reserve Bank of Philadelphia Patrick Harker said last week, we can expect further growth in US stock indices, even though the Fed will raise the interest rate.
    Uncertainty about the implementation of the new economic policy of US President Donald Trump seems to be less worrisome for investors who are betting on the growth of the US stock market.
    Today and tomorrow, a volatility surge is expected in the foreign exchange market due to the fact that
    the ECB decides on the interest rate, there will be elections in the UK, and in the US, a former FBI head James Komi will speak in a Senate committee, testifying to the possible impact of Russia on the election campaign in the US, which can further complicate the position of President Donald Trump . The most cautious traders today took a wait-and-see attitude.
    With respect to the US stock indices, we can say that strong corporate reports for the first quarter, evidence of a stable recovery in the US economy, and a policy of gradual increase in interest rates in the US create the basis for further growth of the US stock market.

    Support and resistance levels
    At the beginning of the month the DJIA index exceeded the recent annual highs near 21170.0 and closed last week at the new absolute maximum of 21200.0.
    Indicators OsMA and Stochastics on the 4-hour, daily, weekly charts continue to remain on the side of buyers. The DJIA index continues to grow in the ascending channels on the 4-hour, daily, weekly charts. In case of breakdown of the level 21200.0, the growth of the index may continue.
    In the alternative scenario, a short-term correction to the lower border of the uplink and EMA200 on the 1-hour chart (level 21115.0) is possible. Deeper correction movement is possible to the lower border of the ascending channel on the daily chart (level 20600.0).
    If the downward trend is to increase, then the decline in the index may extend to support levels of 20360.0 (April lows), 19990.0 (EMA200 on the daily chart and December highs), 19850.0 (Fibonacci level of 23.6% correction to the wave growth from the level of 15660.0 after recovery in February this year to the collapse of the markets since the beginning of the year. The maximum of this wave and the Fibonacci level of 0% are near the mark of 21170.0).
    The positive dynamics of the US stock market and DJIA index remains. Only in case of breakdown of the support level 19850.0 can we speak about the breakdown of the bullish trend.
    Support levels: 21170.0, 21020.0, 21000.0, 20965.0, 20825.0, 20600.0, 20500.0, 20360.0, 19990.0, 19850.0
    Resistance levels: 21200.0, 22000.0

    Trading Scenarios

    Buy in the market. Stop-Loss 21090.0. Take-Profit 21220.0, 22000.0
    Sell Stop 21090.0. Stop-Loss 21220.0. Take-Profit 21020.0, 21000.0, 20965.0, 20825.0, 20600.0


    *) Actual and detailed analytics can be found on the Tifia website at tifia.com/analytics

  9. #59
    Senior Member TifiaFX's Avatar
    Join Date
    Mar 2017
    Posts
    697
    XAG/USD: The dollar is strengthening
    09/06/2017
    Current dynamics

    The third trading session the dollar strengthens in the foreign exchange market against the assets-shelters - yen, franc, precious metals. The dollar received an additional positive impulse today after the first results of the elections to the UK Parliament became known, and after the ECB yesterday's meeting. As you know, the ECB kept the benchmark interest rate at 0%, the deposit rate - at the level of -0.4%, the rate on marginal loans - at the level of 0.25%. The QE program, in which the ECB monthly buys European assets worth 60 billion euros, has also remained unchanged.
    The pound today collapsed in the foreign exchange market immediately after the first results of the exit poll of the elections became known yesterday at 21:00 (GMT), according to which the Conservatives and its leader, the current Prime Minister of Britain, Theresa May, failed to achieve an absolute majority in the country's parliament. The ruling Conservative party, although it remains the largest in the parliament, received 314 of 650 seats. Most votes are provided by 326 seats. Any factors that increase uncertainty around Brexit will be negative for the pound and the British stock market.
    The US dollar, meanwhile, is building up its positions in the foreign exchange market. The index of the dollar WSJ, which reflects the value of the US dollar against the basket of 16 other currencies, rose yesterday by 0.1%, to 88.21.
    Now, after the ECB meeting, investors' attention shifts to a meeting of the US Federal Reserve System, which will be held on June 13-14. Most market participants expect an interest rate increase of 0.25%.
    August gold futures fell 1.2% yesterday, to 1278.20 dollars per troy ounce.
    Other precious metals, in particular silver, are also falling in price. The pair XAG / USD is down today for the third consecutive session, trading during today's European session near the mark of 17.35 dollars per troy ounce. The probability of an increase in the interest rate in the US next week is estimated by investors higher than 90%. As you know, higher interest rates make dollar assets more attractive to investors, and lead to the sale of precious metals that do not bring interest income. At the same time, the costs of their acquisition and storage are growing.
    And, nevertheless, the continuing geopolitical risks, as well as political uncertainty in the UK, the US, France, where elections to the local parliament will also take place this weekend, support the demand for precious metals.
    Of the news for today, it is worth paying attention to the publication at 12:30 (GMT) of data from the labor market of Canada, which may increase volatility in the foreign exchange market.

    Support and resistance levels
    For the past 4 weeks, the pair XAG / USD has skyrocketed in the upward short-term channel on the 4-hour chart, the upper limit of which is close to the level of 17.86.
    At the moment, after a three-day corrective decline, the pair XAG / USD is trading near support levels of 17.25 (EMA200 and the bottom line of the uplink on the 4-hour chart), 17.35 (EMA200, EMA144 on the daily chart).
    Indicators OsMA and Stochastics on the 4-hour, daily charts went to the side of sellers.
    The reduction scenario is associated with a breakthrough in the support level at 17.25 and a further decline in the downward channel on the daily chart with targets of 16.85 (the Fibonacci level of 23.6% of corrective growth to the fall of the pair since August 2016 and the level of 20.59), 16.05, 15.72 (low of 2016 ).
    The immediate goal in the case of continued growth of the pair XAG / USD are the levels of 17.58 (Fibonacci level 38.2%), 17.86 (EMA144 on the weekly chart). Here, the upper line of the descending channel passes on the daily and weekly charts.
    More distant medium-term targets are the levels 18.17 (Fibonacci 50%), 18.48 (EMA200 on the weekly chart and April highs), 18.75 (Fibonacci level 61.8%).
    In the dynamics of the pair XAG / USD, one should pay attention to the current correlation with the pairs USD / JPY (-85%), XAU / USD (71%). Given the rather high cross-correlation, and how these pairs are relative to key support levels (EMA200, EMA144 on the daily chart), the conclusion suggests: either the pair XAG / USD will grow slightly (within 1.0% - 1.5%), Or remain at the current level of 17.35 (key support level (EMA200, EMA144 on the daily chart), but provided that the dollar in pairs USD / JPY, XAU / USD increases by the same amount (1.0% - 1.5%).
    In the current situation of geopolitical uncertainty and on the eve of the Fed meeting next week, both options are possible.
    Support levels: 17.35, 17.25, 17.00, 16.85, 16.20, 15.72
    Resistance levels: 17.58, 17.86, 18.17, 18.48, 18.75

    Trading Scenarios

    Sell Stop 17.23. Stop-Loss 17.46. Take-Profit 17.00, 16.85, 16.20, 15.72
    Buy Stop 17.46. Stop-Loss 17.23. Take-Profit 17.58, 17.86, 18.17, 18.48, 18.75


    *) Actual and detailed analytics can be found on the Tifia website at tifia.com/analytics

  10. #60
    Senior Member TifiaFX's Avatar
    Join Date
    Mar 2017
    Posts
    697
    NZD/USD: when will the pair begin to decline?
    13/06/2017

    Current dynamics

    This week a number of important events will take place: meetings of central banks of Switzerland, Great Britain, Japan. However, the focus of traders will be a two-day meeting of the Fed (June 13-14) and the Fed's decision on the interest rate, which will be published June 14 at 18:00 (GMT). Forecast: the rate will be increased by 0.25% to 1.25%. After the decision on the interest rate, a comment on the monetary policy (FOMC Statement) is published and the press conference of the Federal Reserve begins. In the period of publication, a surge in volatility is expected across the financial market, and market participants will study the statement of the Fed on the presence of signals for further plans for monetary policy.
    Higher interest rates tend to support the dollar, making US assets more attractive to investors, and putting pressure on commodity prices and commodity currencies. If the Fed signals about the possibility of one or two more rate increases this year, the US dollar will receive significant support.
    Also on Wednesday (at 22:45 GMT) a report on New Zealand's GDP for the first quarter is published. Forecast: + 0.7% (previous value + 0.4%). The publication of data will cause increased volatility in NZD. Against the background of rising prices for agricultural products in recent years (especially for dairy products, which is an important part of New Zealand's exports), it is likely that the report on New Zealand's GDP for the first quarter will come with positive indicators, and this will positively affect the positions of the New Zealand currency.
    If the GDP report turns out to be worse than expected, and the Fed signals about the possibility of further interest rate hikes, then the NZD / USD pair may drop sharply and finally begin a corrective downward movement to the pair's active growth from the middle of last month.
    Otherwise, the pair NZD / USD will continue its upward movement against the backdrop of positive macro data coming in from New Zealand recently.
    We also await data from New Zealand on the balance of payments for the first quarter (it is expected that the negative balance was 1 billion New Zealand dollars against the surplus of 1.18 billion NZ dollars in the 1st quarter of last year), which are published today at 10:45 (GMT) And data from China (retail sales, industrial production in May) on Wednesday morning, which will increase the volatility of trades on the New Zealand dollar.
    *)An advanced fundamental analysis is available on the Tifia website at tifia.com/analytics

    Support and Resistance levels
    As a result of active growth, which began in the middle of last month, the pair NZD / USD broke through a strong resistance level of 0.7190 (EMA144 on the weekly chart) and came close to the resistance level of 0.7235 (the Fibonacci level of 38.2% of the upward correction to the global fall wave from the level of 0.8800 , Which began in July 2014, the minimums of December 2016).
    A little higher, through to the resistance level of 0.7270 is the 200-period moving average on the weekly chart. Thus, the NZD / USD pair is in the zone of strong resistance levels. For further growth and breakdown of these levels, the pair NZD / USD needs strong positive fundamental drivers, for example, signals from the RBNZ about the possibility of an early interest rate increase in New Zealand. The next meeting of the RBNZ on this issue will be held on June 21, ie. Already next week.
    As you know, RBNZ last month kept interest rate at 1.75% and stated that interest rates will remain unchanged for quite a long time, at least until the third quarter of 2019. If, however, in the rhetoric of the bank will be marked a more rigid position, the New Zealand dollar will receive a strong support, and then the resistance level of 0.7270 can be passed.
    Otherwise, the New Zealand dollar and the pair NZD / USD are waiting for a decline.
    While the RBNZ seeks to keep the current monetary policy unchanged, the Fed says it plans to gradually tighten monetary policy in the US. The difference between the monetary policies of the RBNZ and the Fed will remain the main fundamental factor in favor of the US dollar in the next couple of years, despite the possible growth periods for the NZD / USD pair over several weeks.
    The return of the pair NZD / USD to the short-term support level 0.7165 (EMA200 on the 1-hour chart) may trigger a further decline in the NZD / USD pair and in the medium term with a target near the key support level of 0.7050 (EMA200, EMA144, EMA50 on the daily chart).
    By the way, indicators OsMA and Stochastics on the daily period begin to unfold on short positions.
    Support levels: 0.7190, 0.7165, 0.7100, 0.7050, 0.6945, 0.6900, 0.6885, 0.6860, 0.6818
    Resistance levels: 0.7235, 0.7270, 0.7300, 0.7380

    Trading Scenarios

    Sell Stop 0.7190. Stop-Loss 0.7240. Take-Profit 0.7165, 0.7100, 0.7050, 0.6945, 0.6900, 0.6885, 0.6820
    Buy Stop 0.7240. Stop-Loss 0.7190. Take-Profit 0.7270, 0.7300, 0.7380


    *) For up-to-date and detailed analytics and news on the forex market visit Tifia company website tifia.com

Page 6 of 70 FirstFirst ... 4 5 6 7 8 16 56 ... LastLast

Tags for this Thread

Bookmarks

Posting Permissions

  • You may not post new threads
  • You may not post replies
  • You may not post attachments
  • You may not edit your posts
  •