Page 196 of 196 FirstFirst ... 96 146 186 194 195 196
Results 1,951 to 1,960 of 1960
Like Tree3Likes

Wave Analysis by InstaForex

This is a discussion on Wave Analysis by InstaForex within the Analytics and News forums, part of the Trading Forum category; Forex Analysis & Reviews: EUR/USD Overview. December 2. The Euro Quietly Rises The EUR/USD currency pair traded relatively calmly on ...


  1. #1951
    Junior Member
    Join Date
    Mar 2024
    Posts
    393
    Forex Analysis & Reviews: EUR/USD Overview. December 2. The Euro Quietly Rises


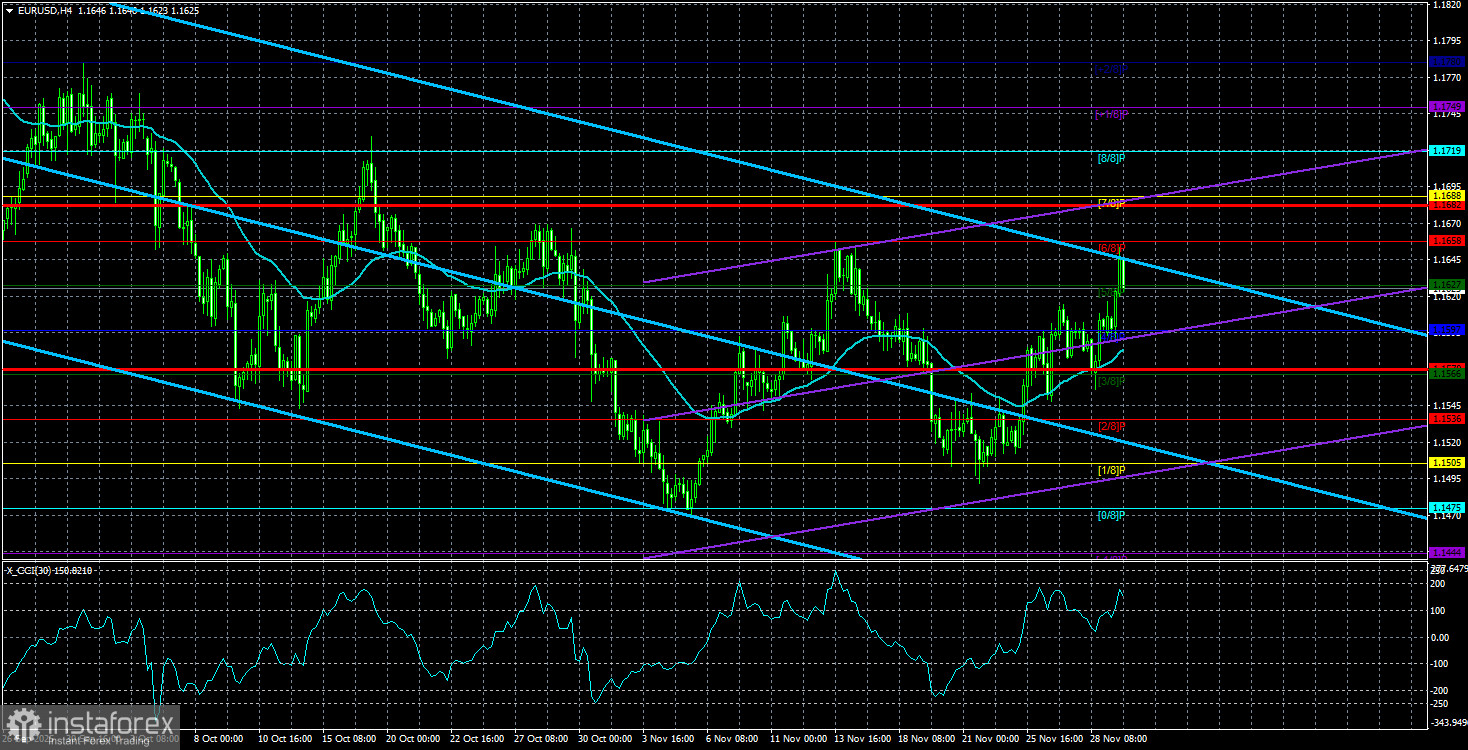
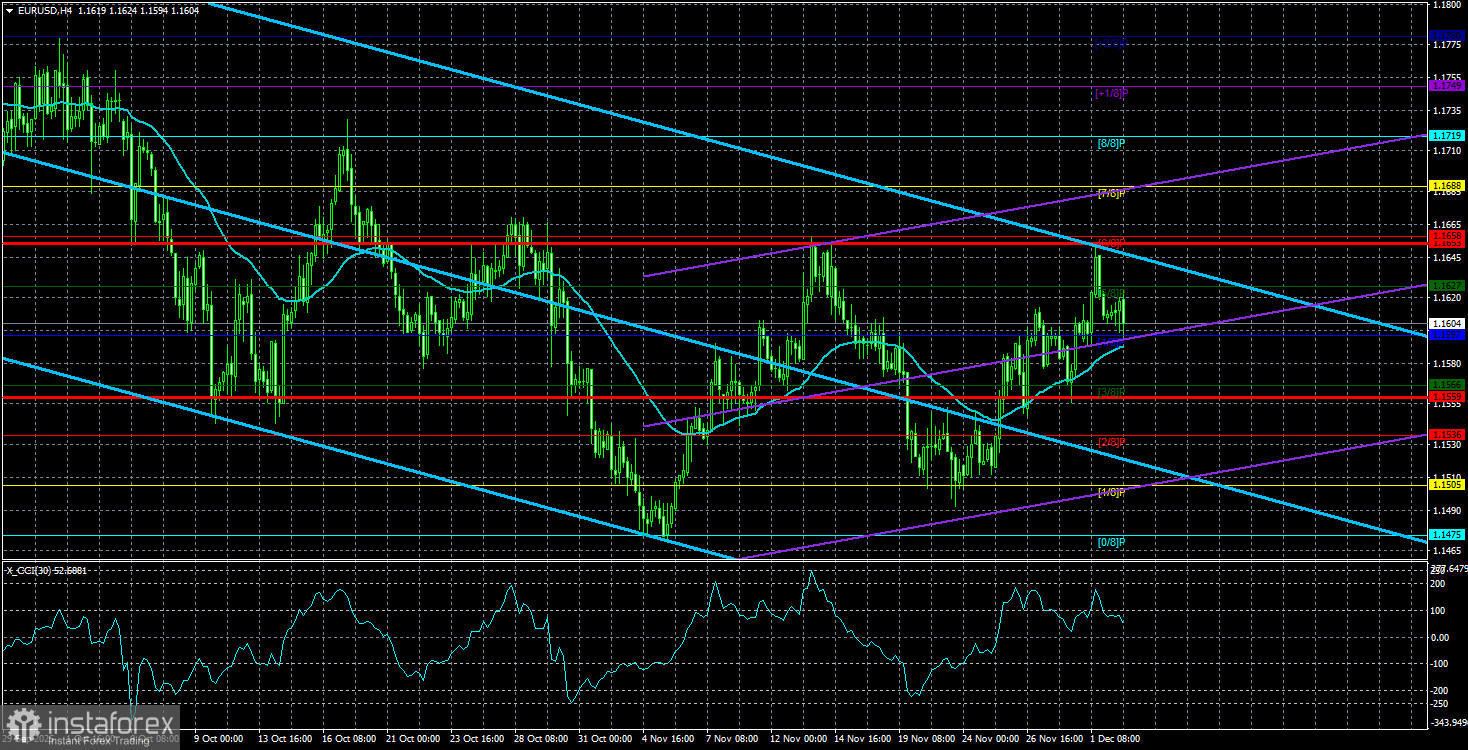
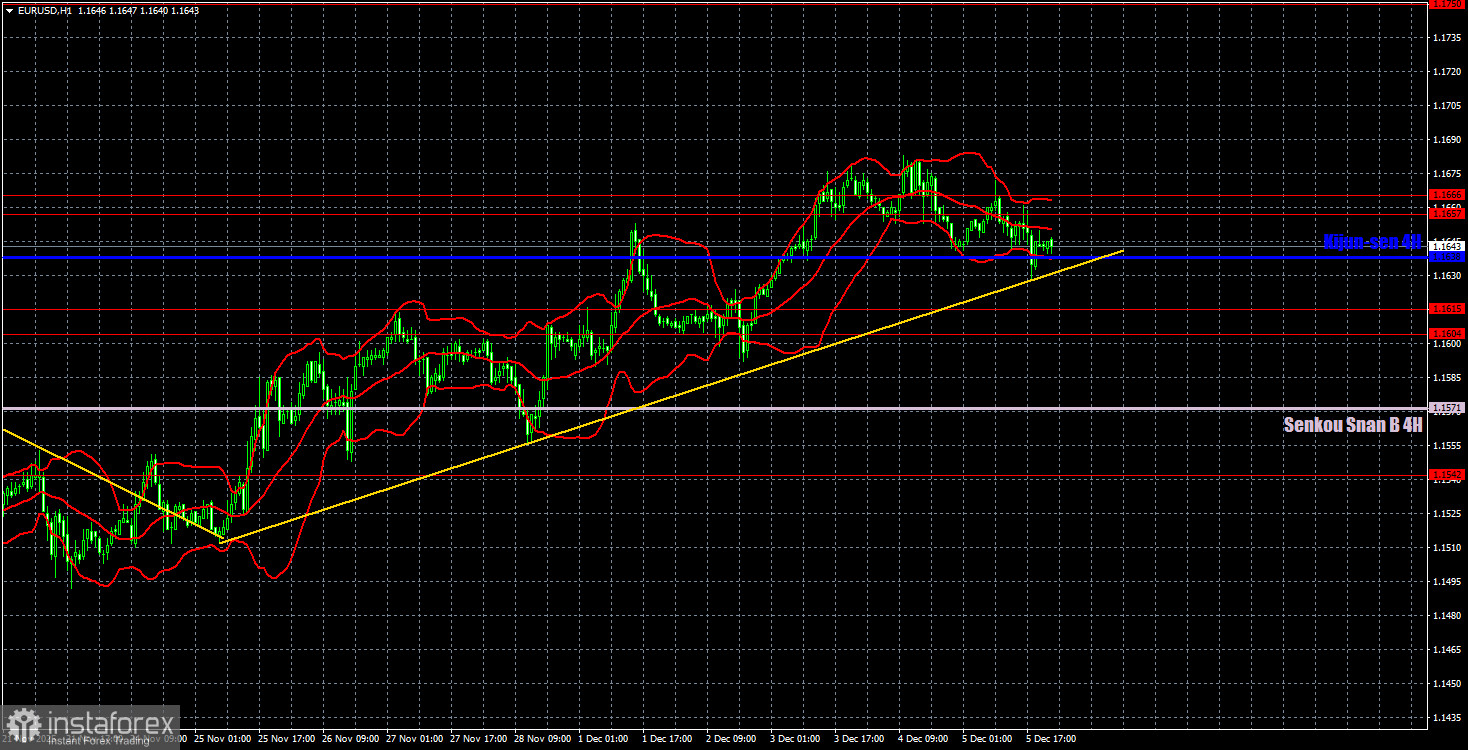
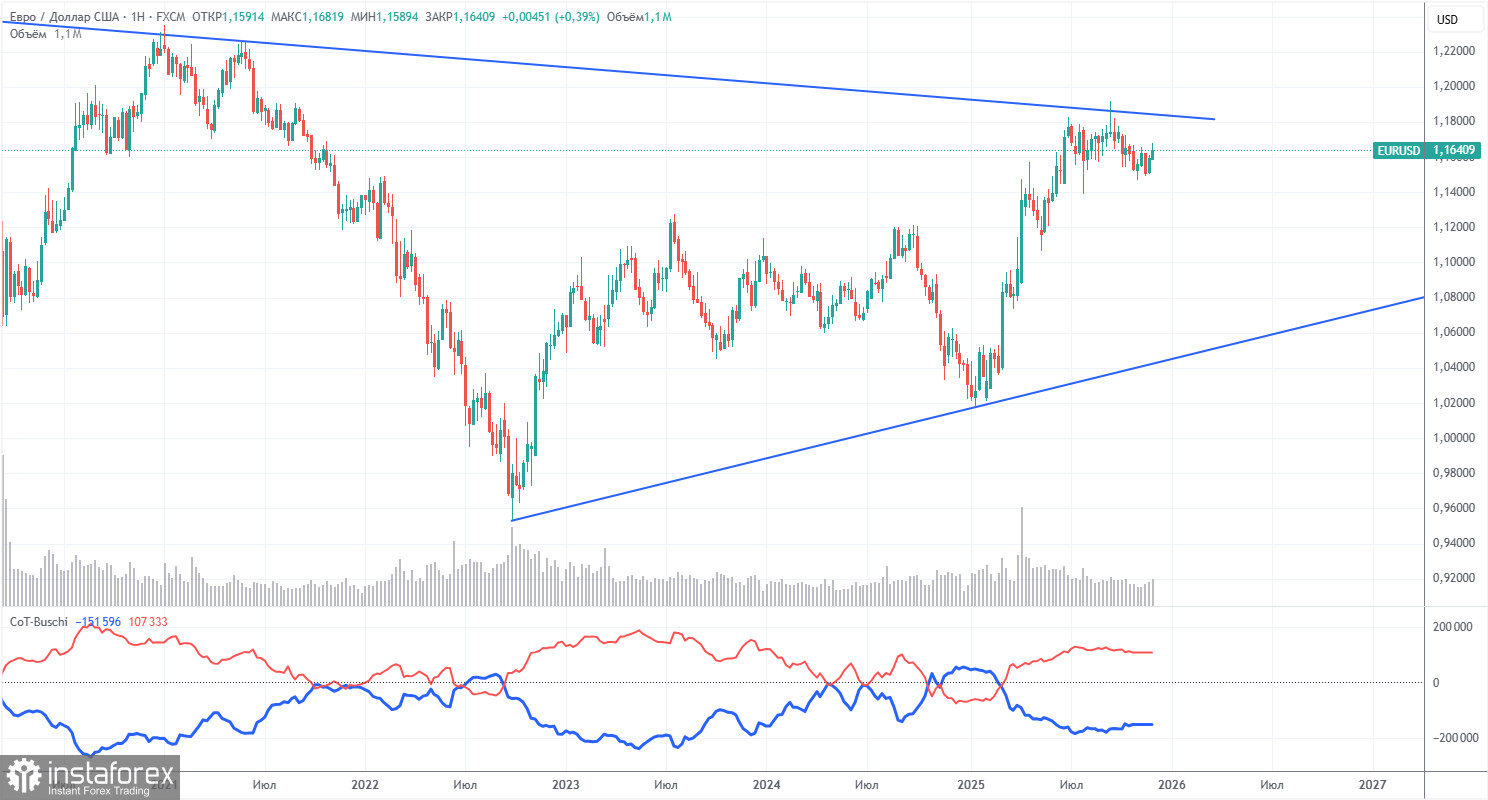
    The EUR/USD currency pair traded relatively calmly on Monday while maintaining an upward trend. This is quite encouraging, as we may be witnessing the beginning of a new phase in the global upward trend that we've been waiting for over the past few months. Since approximately July 1, the EUR/USD pair has been stuck in a sideways channel between the levels of 1.1400 and 1.1830. Sooner or later, any flat period comes to an end. When it does, a new trend begins or an old one resumes. The trend remains upward, so we continue to expect growth. On Monday, there were no significant fundamental events in either the U.S. or the Eurozone. Yet this is not needed at the moment. The dollar has failed to demonstrate sustained growth over the past five months, showing a total decline of 1650 pips while correcting by only 23.6% according to Fibonacci. In simpler terms, the dollar fell nearly 1700 pips and then spent five months stagnating, as a 23% correction hardly qualifies as a true correction. The fundamental reasons behind the dollar's new decline remain unchanged: Donald Trump's policies, the trade war, the Federal Reserve's easing of monetary policy, and the ongoing pressure on the Fed from Trump. Moreover, the unresolved "shutdown" issue, the end of the European Central Bank's easing cycle, and the uncertain prospects for the American economy mean there are plenty of reasons to sell the dollar. Importantly, all these factors remain relevant. We want to emphasize that the trade war is not a Fed meeting that the market can price in in a day and then forget. The trade war can have a prolonged and destructive impact on the dollar. We already see central banks beginning to reduce dollar reserves, which can be interpreted as a global counter-dollar trend. The world is shifting away from reliance on the American dollar, mainly due to Donald Trump. Of course, the leader of America will demand that the dollar remain the number one currency. Those who dare to disobey will face tariffs and sanctions—as usual, nothing new or surprising. Traders have likely become accustomed to Trump's policies. It is also worth noting that the dollar has risen against the euro and the pound for about 16 years, since 2008. Trends eventually come to an end, so we may now be at the beginning of a new 10- or 20-year trend. The euro has already risen by 22% or 21 cents against the dollar since 2022. However, considering the next 10 years, this is relatively modest. Warnings of a new rise in the European currency have also been abundant.


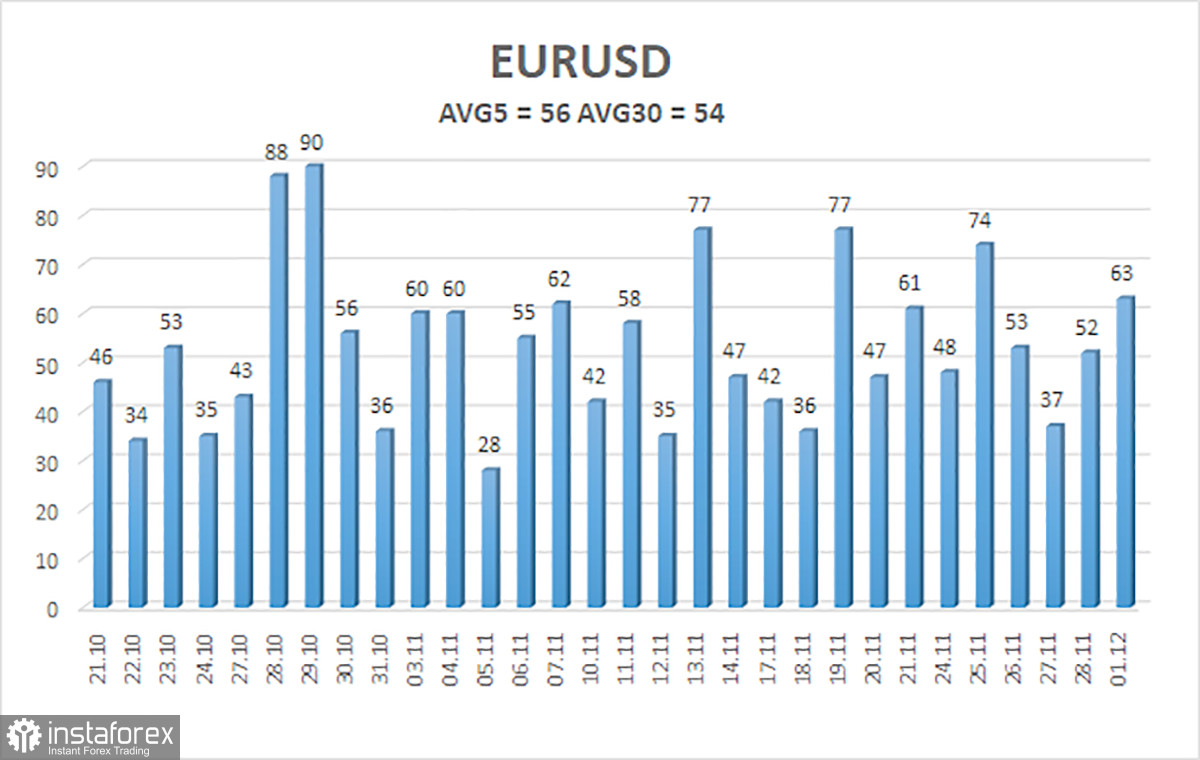
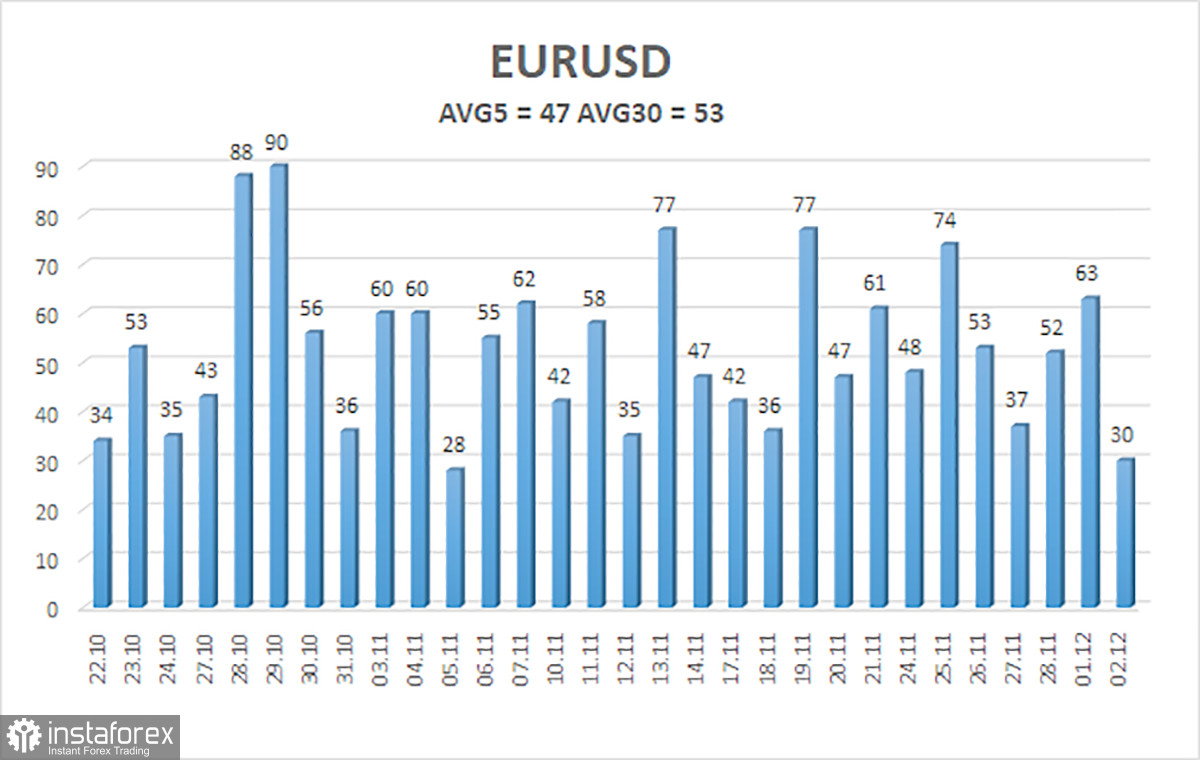
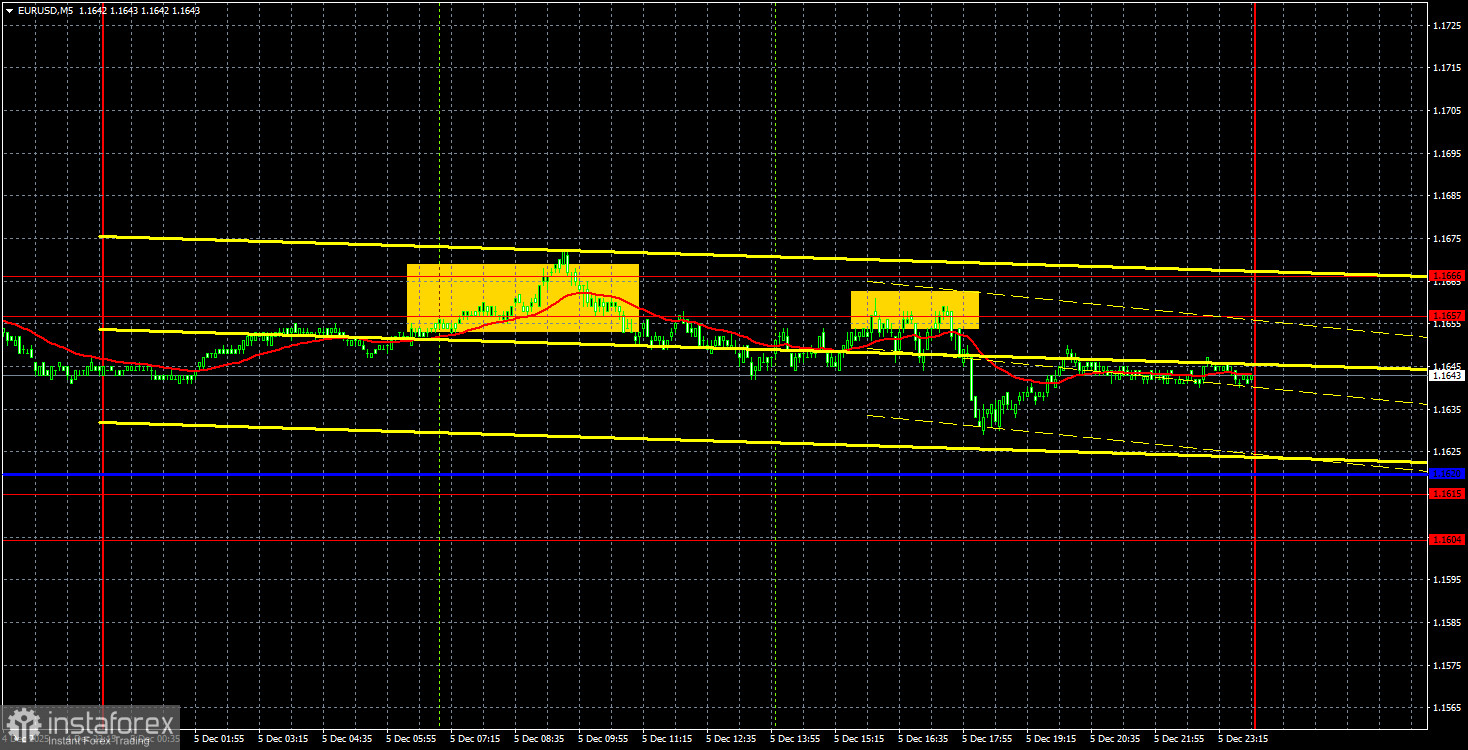
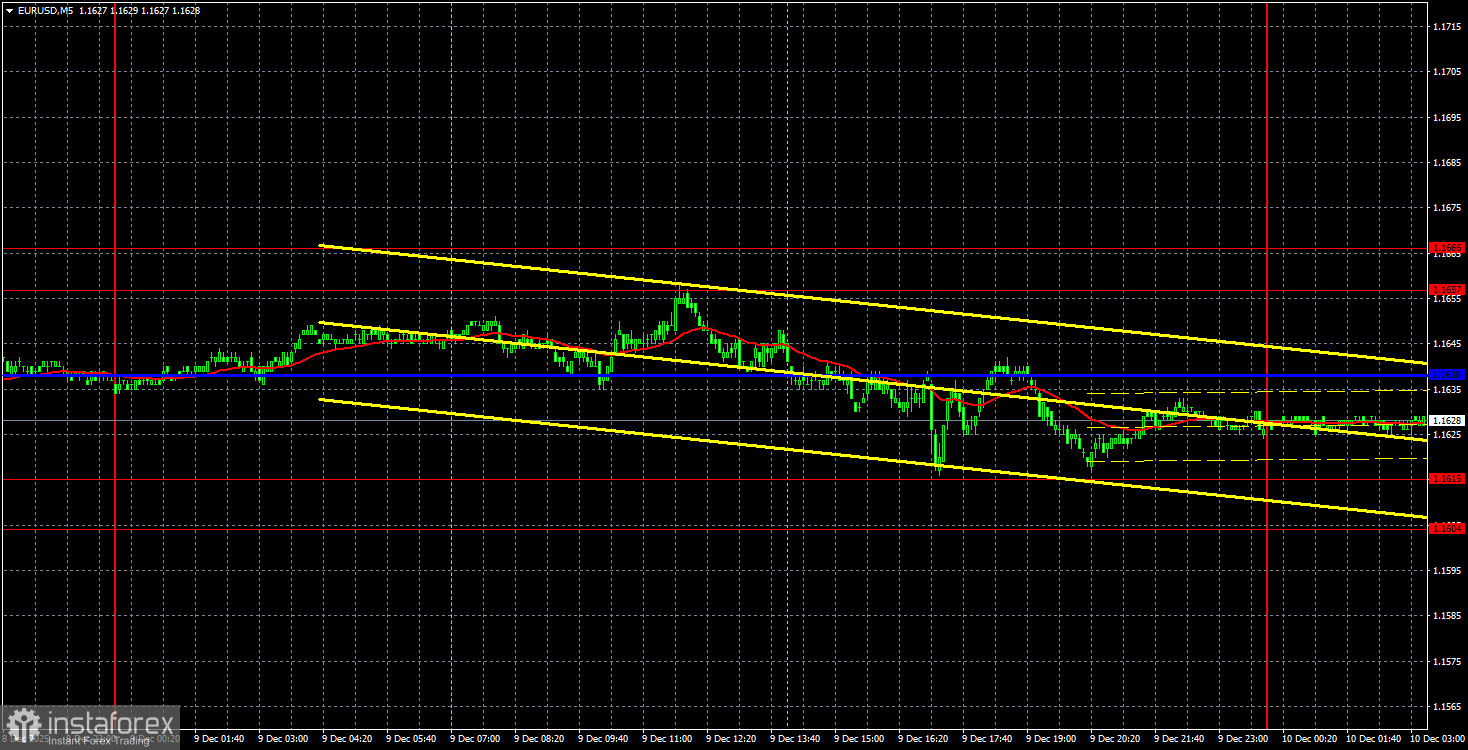
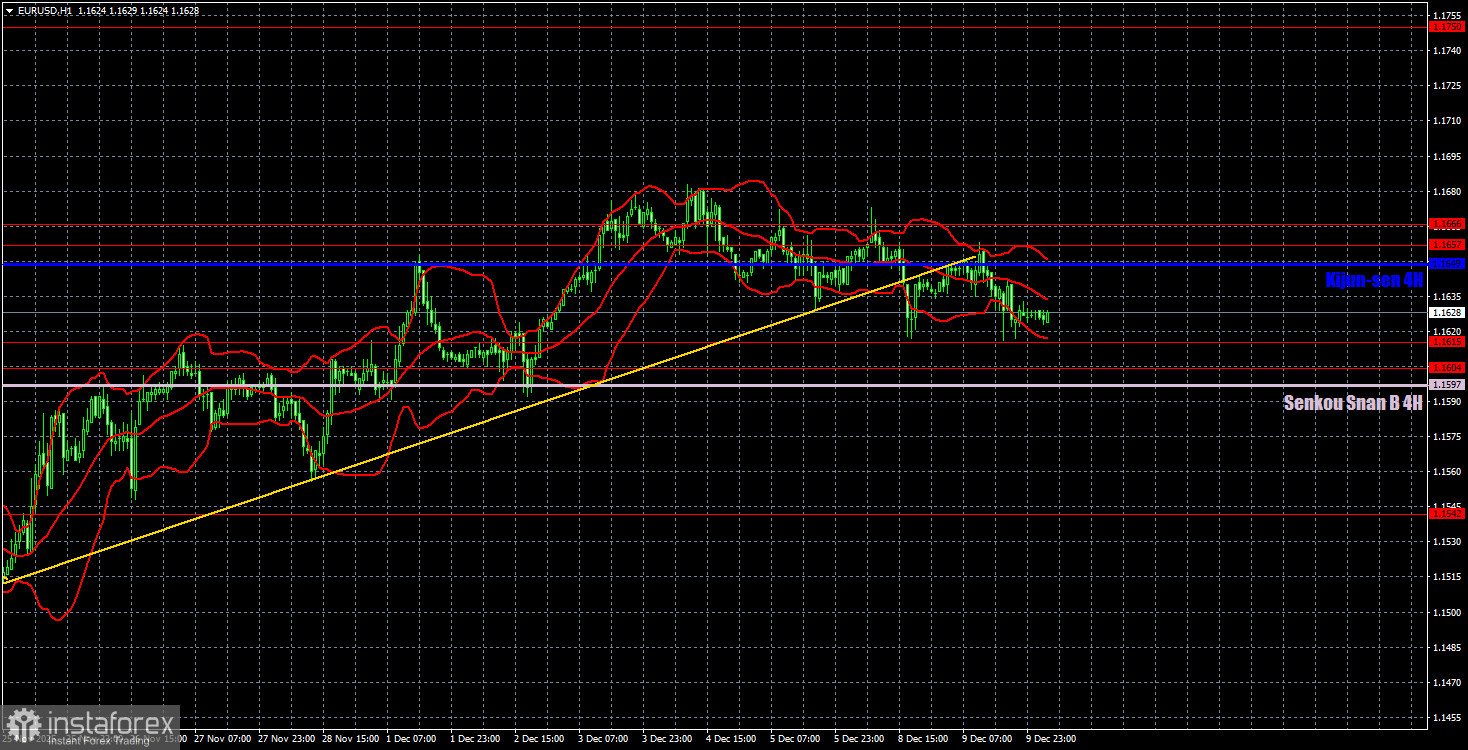
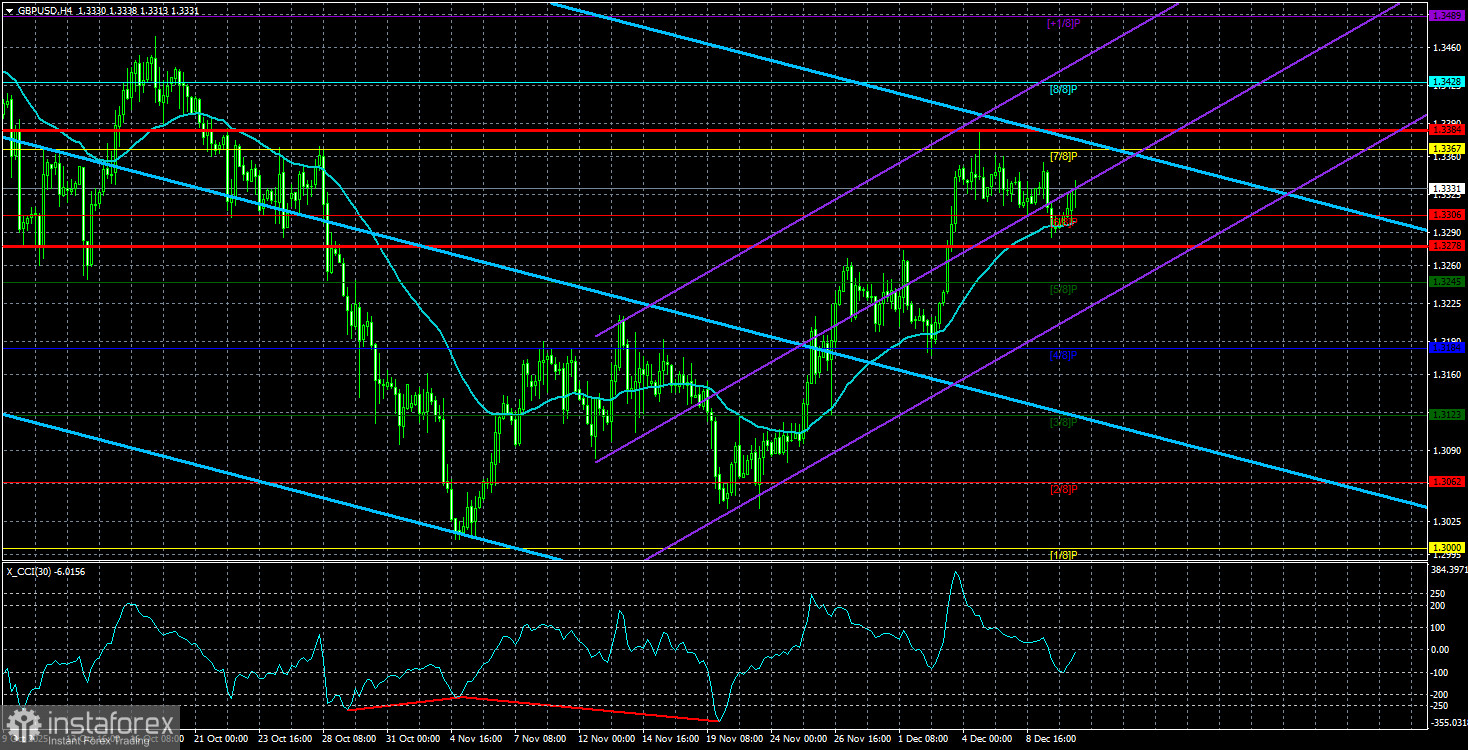
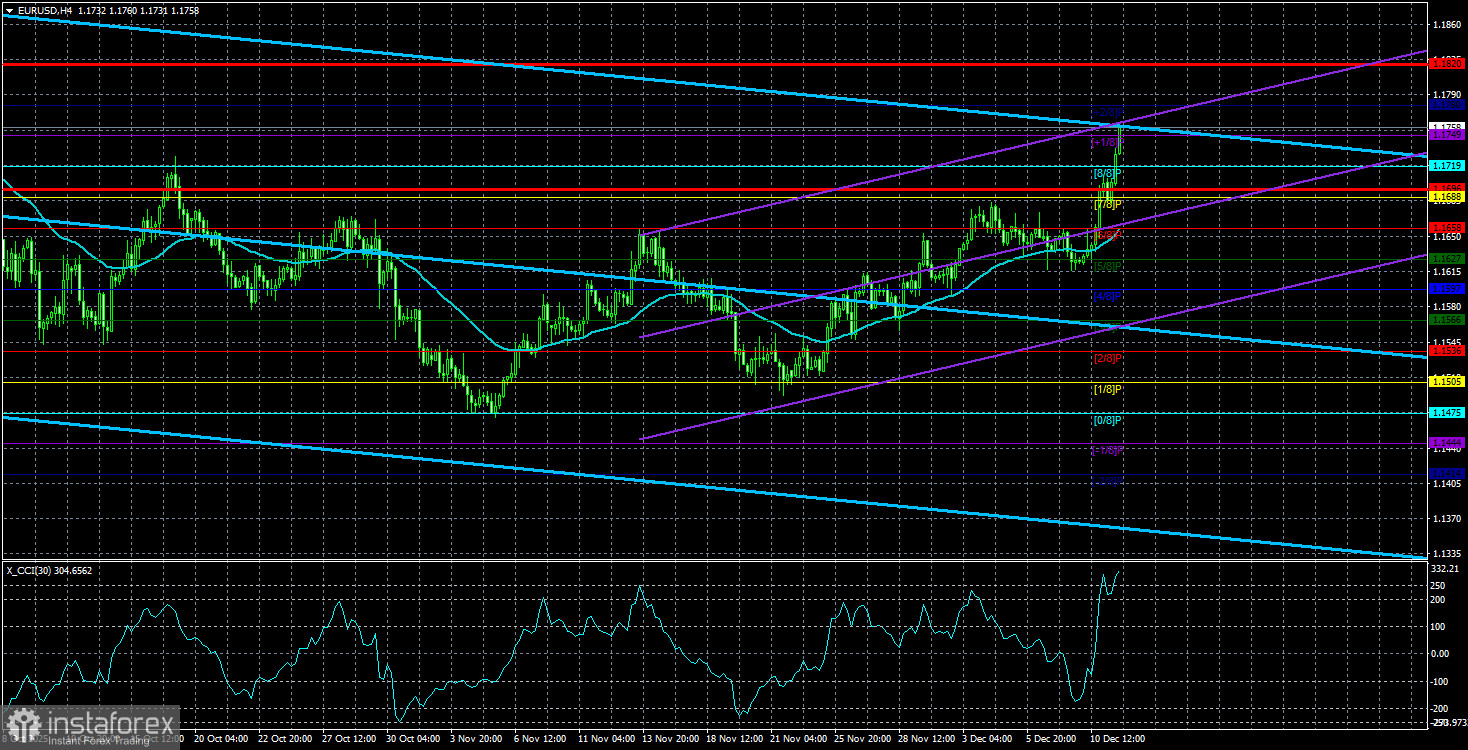
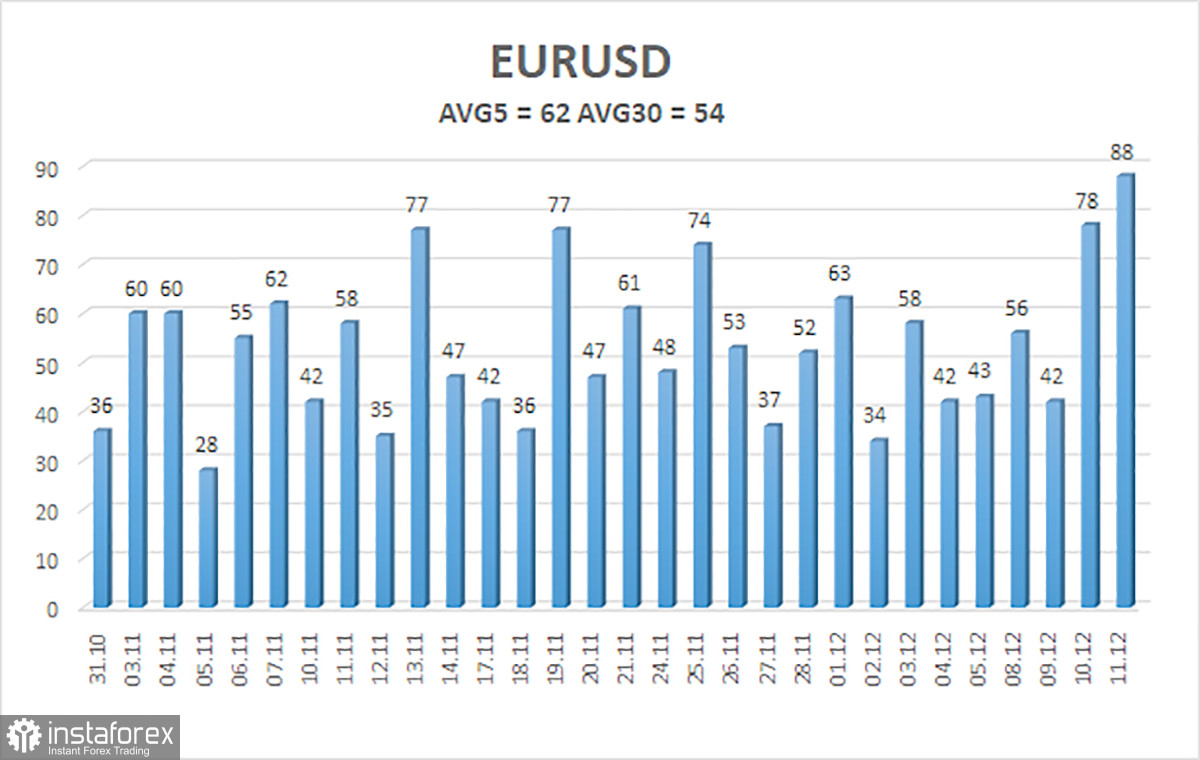
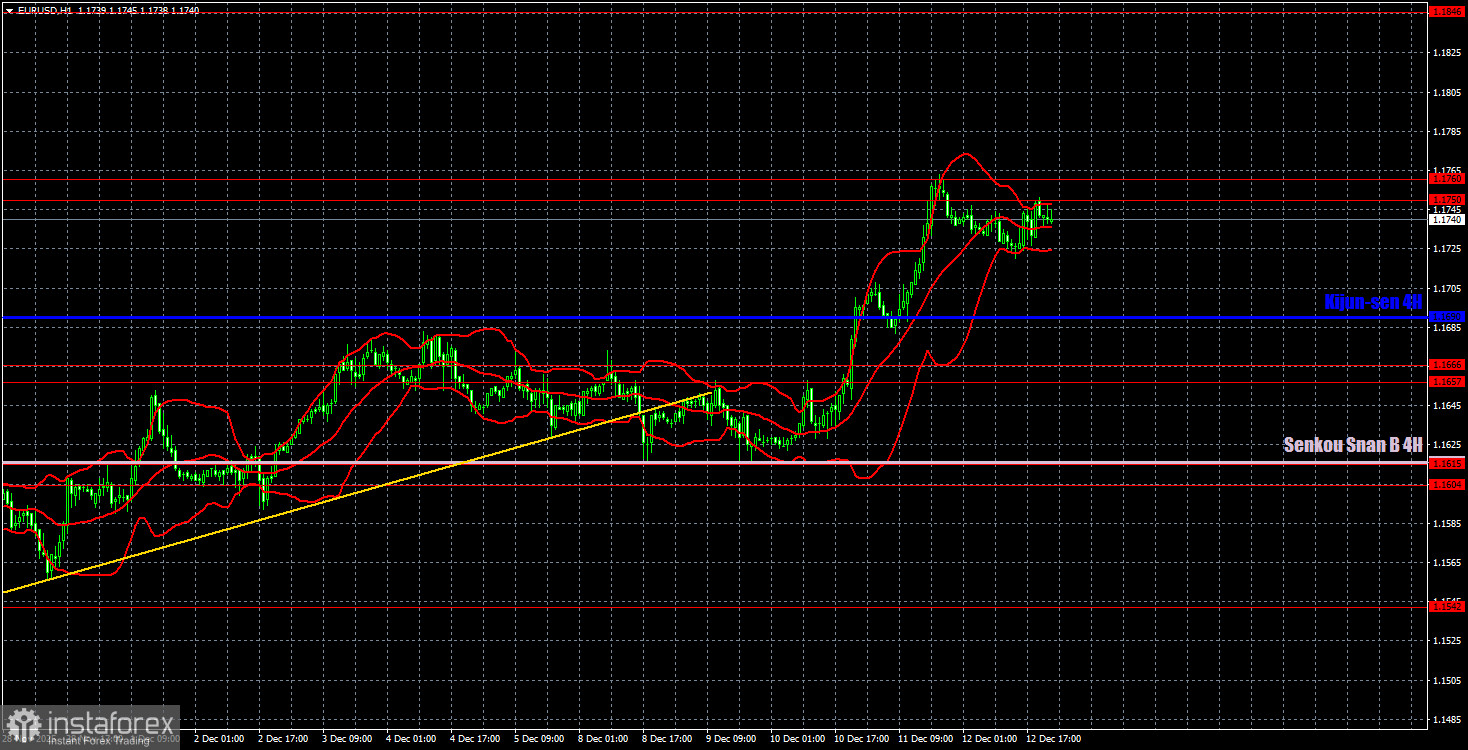
    The average volatility of the EUR/USD currency pair over the last five trading days, as of December 2, is 56 pips and is categorized as "medium." We expect the pair to trade between 1.1570 and 1.1682 on Tuesday. The upper channel of the linear regression trend is directed downwards, indicating a bearish trend, but a flat continues on the daily timeframe. The CCI indicator entered the oversold area twice in October (!!!), which could trigger a new upward trend for 2025. Nearest Support Levels: S1 – 1.1627 S2 – 1.1597 S3 – 1.1566 Nearest Resistance Levels: R1 – 1.1658 R2 – 1.1688 R3 – 1.1719 Trading Recommendations: The EUR/USD pair remains below the moving average, but the upward trend persists on all higher timeframes, and a flat has been ongoing on the daily timeframe for several months. The global fundamental background remains critically important for the market. Recently, the dollar has risen, but only within a sideways channel. There is no fundamental basis for long-term growth. With the price positioned below the moving average, small short positions with targets of 1.1536 and 1.1505 can be considered on purely technical grounds. Above the moving average, long positions remain relevant with a target of 1.1800 (the upper line of the flat on the daily timeframe).

    Analysis are provided by InstaForex.

    Read more: https://ifxpr.com/4pgvXDI

  2. #1952
    Junior Member
    Join Date
    Mar 2024
    Posts
    393
    Forex Analysis & Reviews: EUR/USD Review. December 3. The Market Has Put Off Matters Until 2026


    The EUR/USD currency pair traded quite calmly on Tuesday. We have mentioned volatility in every article, as we believe it is currently a key factor. With any macroeconomic backdrop, fundamentals, or technical picture, if there are no market movements (or they are extremely weak), it is difficult to expect high profits from trades. The EUR/USD pair has been trading in a range for five consecutive months, as shown on the daily timeframe. We consider the range to be the second-most important factor in analyzing the pair's movements. Range + low volatility, what can we expect now? The macroeconomic backdrop on Tuesday had the potential to provoke decent movements in the euro, but the market chose to ignore the reports on unemployment and inflation. As previously mentioned, the Consumer Price Index (CPI) in the Eurozone is currently of limited significance for the euro, as its value is almost equal to the European Central Bank's target level. Thus, the ECB has no reason to consider changing the monetary course. A slight increase in inflation for November is practically meaningless. Conversely, the unemployment rate, which rose to 6.4%, is also unlikely to be deemed a "failure." For example, in 2023, the unemployment rate in the Eurozone was 6.7%, and in October 2020, it was 8.4%. Therefore, in the long term, this indicator is declining and, over the past year, has fluctuated between 6.1% and 6.5%. Thus, there is no cause for alarm. Essentially, the key event of the day was Donald Trump's announcement that he had chosen a new Federal Reserve chair. However, he did not name the president and intends to maintain a prolonged theatrical pause. Yet there is no real intrigue in this. Markets are confident that the new Fed chair will be Kevin Hassett, the current Trump advisor on economic matters. Traders also understand that it does not matter who the new Fed chair will be; it will be a person aligned with Trump, which means he will indeed follow the White House's directives. Since Trump desires a significantly lower key interest rate, one can be certain that Hassett will support easing at every meeting, as Stephen Miran does now. The only question is how the "independent wing" of the Monetary Committee will behave. It should be recalled that most FOMC officials are concerned about new inflation rises and are not prepared to sacrifice one mandate (price stability) for another (full employment). At the moment, there are still more "hawks" than "doves." Therefore, Trump may need to fire one or two officials resistant to rate cuts to tilt the balance in favor of his agenda during monetary votes, or at least make an attempt to do so. However, in any case, the new Fed head will exert pressure on all the "hawks." Trump would criticize from the outside, while the new chair would act from within the Fed.


    The average volatility of the EUR/USD currency pair over the last five trading days as of December 3 is 47 pips and is characterized as "medium-low." We expect the pair to trade between 1.1559 and 1.1653 on Wednesday. The upper linear regression channel is directed downward, indicating a bearish trend, but in reality, the pair continues to trade sideways on the daily timeframe. The CCI indicator entered the oversold area twice in October, which could trigger a new wave of the upward trend in 2025. Nearest Support Levels: S1 – 1.1597 S2 – 1.1566 S3 – 1.1536 Nearest Resistance Levels: R1 – 1.1627 R2 – 1.1658 R3 – 1.1688 Trading Recommendations: The EUR/USD pair remains below the moving average, but the upward trend persists across all higher timeframes, while the daily timeframe has been in a range for several months. The global fundamental backdrop remains immensely important for the market. We see that the dollar has recently been rising, but it has only moved within a sideways channel. For long-term growth, it lacks a fundamental basis. With the price below the moving average, small short positions can be considered, with targets at 1.1559 and 1.1536 based solely on technical grounds. Above the moving average, long positions remain relevant with a target of 1.1800 (the upper line of the range on the daily timeframe).


    Analysis are provided by InstaForex.

    Read more: https://ifxpr.com/48ALJlT

  3. #1953
    Junior Member
    Join Date
    Mar 2024
    Posts
    393
    Forex Analysis & Reviews: Trading Recommendations and Trade Analysis for GBP/USD on December 4. The Pound Went Wild

    Analysis of GBP/USD 5M


    The GBP/USD currency pair surged by an extraordinary amount over the past 24 hours. The upward movement began (or resumed) during the Asian trading session, and throughout the day, the British pound rose by 130 pips, something that hasn't happened in a long time. In general, discussing the reasons makes little sense, as they were the same as for the EUR/USD pair. However, the euro rose only 60 pips, while the pound rose twice as much. Why? From our perspective, the pound has fallen significantly more than the euro in recent months, and that's why it is now rising strongly. We have repeatedly pointed out the illogicality of such a sharp decline in the British currency. Hence, this powerful rise does not surprise us at all. Yesterday, we also mentioned that the consolidation below the trend line should not mislead, as the upward trend remains above the Senkou Span B line. Last night, the pair consolidated above the 1.3201-1.3212 range and continued to rise. Reports from the U.S. served the pound well yesterday. The ADP report failed, raising the likelihood of new monetary policy easing from the Federal Reserve to 100%. Reports on industrial production and the ISM services sector remained better than forecasts, but they did not save the dollar from its inevitable decline. Unfortunately, on the 5-minute timeframe, the trading signal to buy, which allowed for the completion of yesterday's movement, was formed overnight. Those traders who acted on it made good profits, as the target level of 1.3307 was reached.

    COT Report


    COT reports on the British pound indicate that, in recent years, commercial traders' sentiment has been consistently changing. The red and blue lines displaying the net positions of commercial and non-commercial traders have been crossing frequently, often staying near the zero mark. Currently, they are at nearly the same level, which indicates a roughly equal number of long and short positions. The dollar continues to weaken due to Donald Trump's policies, as clearly seen on the weekly timeframe. The trade war is likely to continue in one form or another for a long time. The Federal Reserve is set to lower rates in the next 12 months. Demand for the dollar will decline one way or another. According to the last COT report (as of October 14) regarding the British pound, the "Non-commercial" group closed 14,900 long contracts and 7,700 short contracts. Consequently, the net position of non-commercial traders decreased by 7,200 contracts over the week. However, this data is already outdated, and no fresh information is available. In 2025, the pound significantly increased, but it should be understood that the reason is single – Donald Trump's policies. Once this reason is neutralized, the dollar may strengthen, but when that will happen remains uncertain. Regardless of how fast the net position of the pound rises or falls, the dollar's net position is decreasing, and usually at a faster pace.

    GBP/USD Analysis 1H


    On the hourly timeframe, the GBP/USD pair continues to form an upward trend. We believe that medium-term growth will continue regardless of the local macroeconomic and fundamental backdrop, and that the correction on the daily timeframe will eventually finish. Or it may have already finished. The British pound finally showed the movement we were waiting for. It's a sin not to continue this trend. For December 4, we highlight the following important levels: 1.2863, 1.2981-1.2987, 1.3042-1.3050, 1.3096-1.3115, 1.3201-1.3212, 1.3307, 1.3369-1.3377, 1.3420, 1.3533-1.3548, and 1.3584. The Senkou Span B (1.3152) and Kijun-sen (1.3261) lines can also serve as signals. It is recommended to set the Stop Loss to breakeven when the price moves in the right direction by 20 pips. The Ichimoku indicator lines may shift during the day, which should be taken into account when determining trading signals. On Thursday, the UK is scheduled to release the construction sector activity index, while the U.S. will report unemployment claims. Both reports are secondary. Thus, market reactions may be extremely weak, and volatility may significantly decrease. Trading Recommendations: Today, traders may consider selling if the price bounces from the 1.3369-1.3377 area, targeting 1.3307. Long positions will become relevant upon consolidation above the region of 1.3369-1.3377 with a target of 1.3420 or on a bounce from the 1.3307 level with a target of 1.3369-1.3377.

    Analysis are provided by InstaForex.

    Read more: https://ifxpr.com/44Az4Os

  4. #1954
    Junior Member
    Join Date
    Mar 2024
    Posts
    393
    Forex Analysis & Reviews: Overview of the GBP/USD Pair. December 5. Why Did the British Pound Surge?


    The GBP/USD currency pair traded quite calmly on Thursday, after showing impressive growth the day before. Recall that on this day, the US dollar received yet another verdict in the form of the ADP report. As a result, the number of private-sector employees in the US decreased by 32,000 in November, rendering all other data virtually meaningless for the American currency. The ISM Services PMI rose? Good, but it does not save the dollar from a decrease in the Federal Reserve's key rate next week. However! The euro rose by 50 pips, and the British pound by more than 100. Why? There are two obvious answers to this question. First, the British currency is historically more volatile than the euro. Second, in recent months, the British pound has depreciated against the dollar much more than its European counterpart. It is worth noting that over the past five months, the euro has been in a flat range on the daily timeframe, and the British pound initially also "showed" a flat. But at the final stage, the GBP/USD pair fell below what it should have, turning the flat into a classic correction consisting of three waves. But were there grounds for the pound to decline more significantly? In our opinion, no. In about half of the cases, the British pound depreciated due to the same issue regarding the UK budget for 2026, and in the other half of the cases, it was without cause. The macroeconomic background in Great Britain disappointed last month, but can the news flow from the US really please anyone right now? Thus, we continue to believe that we observed a technical correction, the magnitude of which was significantly larger than the logical and fair size. Therefore, the British pound is currently catching up. That is why it is rising stronger than the European currency. Some traders may argue that the Bank of England is likely to lower the key rate in December as well. And they would be right. In this case, there seems to be no reason for the dollar to fall. However, let us return to October and November, when the market simply ignored a whole layer of news: the "shutdown" in the US, new tariffs from Donald Trump, and two cuts in the Fed's key rate. This is by no means a complete list, just the main points. Thus, in any case, the GBP/USD pair has fallen too much. On the daily timeframe, an upward trend persists. Yes, we saw a five-month correction, but the trend has not been canceled or changed. Therefore, as long as the trend is not canceled, we should only expect growth. Yesterday, the Senkou Span B line was reached on the daily timeframe, and its breach will open the way for the British currency to reach yearly highs around the 38 level. As before, we expect movement only in the upward direction.

    The average volatility of the GBP/USD pair over the last five trading days is 76 pips. For the pound/dollar pair, this value is "average." On Friday, December 5, we therefore expect movement within a range limited by the levels 1.3274 and 1.3426. The upper linear regression channel is directed downwards, but only because of a technical correction on higher timeframes. The CCI indicator has entered the oversold area six times over the past months and has formed another "bullish" divergence, which constantly warned of a resumption of the upward trend. Nearest Support Levels: S1 – 1.3306 S2 – 1.3245 S3 – 1.3184 Nearest Resistance Levels: R1 – 1.3367 R2 – 1.3428 R3 – 1.3489 Trading Recommendations: The GBP/USD currency pair is attempting to resume the 2025 upward trend, and its long-term prospects have not changed. Donald Trump's policies will continue to exert pressure on the dollar, so we do not expect the American currency to appreciate. Thus, long positions with targets of 1.3428 and 1.3489 remain relevant in the near future as long as the price is above the moving average. If the price is below the moving average line, small short positions with a target of 1.3184 can be considered on technical grounds. From time to time, the American currency shows corrections (globally), but for a robust trend strengthening, it needs signs of an end to the trade war or other positive global factors.

    Analysis are provided by InstaForex.

    Read more: https://ifxpr.com/44cAGxH

  5. #1955
    Junior Member
    Join Date
    Mar 2024
    Posts
    393
    Forex Analysis & Reviews: EUR/USD: Trading Recommendations and Trade Analysis for December 8. The Euro Remains Bullish

    Analysis of EUR/USD (5M)


    The EUR/USD pair struggled on Friday, with volatility not exceeding 40 pips. For the second consecutive day, the pair corrected within a weak upward trend. The ascending trendline remains relevant, suggesting the euro retains upside potential. However, next week, movements and the trend will certainly depend on the FOMC meeting, Jerome Powell's speech, and possibly the JOLTs report, which will be significant simply because there are no other labor market data from the US. The pair could easily consolidate below the trendline and below the critical line, which would cancel the upward trend again. On Friday, the Eurozone released a GDP report, along with the core PCE price index, the University of Michigan consumer sentiment index, and US personal income and spending data. Traders expecting strong movements, especially those who don't read our articles daily, were met with minimal price action. The US dollar strengthened slightly during the US session, but a 20-pip increase amid three relatively important reports is rather insufficient. Nonetheless, the flat market persists on the daily timeframe, making everything quite logical. On the 5-minute chart, two sell signals formed in the 1.1657-1.1666 range. The price bounced off the indicated area twice and failed to cover the distance to the nearest target—Kijun-sen line—of 27 pips for the remainder of the day.

    COT Report


    The latest COT report was released last week and dated October 28. Thus, it is somewhat outdated. The net position of non-commercial traders has been bullish for a long time, with bears only recently gaining a slight edge at the end of 2024, which they quickly lost. Since Trump's second term began, the dollar has only been falling. While we cannot state with 100% certainty that the dollar's decline will continue, the current developments globally do suggest this direction. We still do not see any fundamental factors supporting the strengthening of the euro, while there remains an ample supply of factors for the dollar's decline. The global downtrend is still intact, but what does it matter where the price has moved over the last 17 years? The dollar may strengthen if the global fundamental picture changes, but there are currently no signs of that. The position of the red and blue lines in the indicator continues to indicate the retention of a bullish trend. During the last reporting week, the number of long positions in the "Non-commercial" group increased by 5,900, while the number of short positions increased by 10,300. Therefore, the net position decreased by 4,400 contracts over the week. However, this data is outdated and holds little relevance.

    Analysis of EUR/USD (1H)


    On the hourly timeframe, the EUR/USD pair continues to form an upward trend but is moving slowly, almost reluctantly. The price remains within the sideways channel of 1.1400-1.1830 on the daily timeframe; hence, growth towards 1.1800 can still be expected, though it remains weak overall. Fluctuations within this flat range tend to be weak and incoherent. For December 8, we highlight the following levels for trading: 1.1234, 1.1274, 1.1362, 1.1426, 1.1542, 1.1604-1.1615, 1.1657-1.1666, 1.1750-1.1760, 1.1846-1.1857, 1.1922, 1.1971-1.1988, as well as the Senkou Span B line (1.1571) and Kijun-sen line (1.1638). The Ichimoku indicator lines may move throughout the day, which should be taken into account when determining trading signals. Don't forget to set Stop Loss orders to breakeven once the price moves 15 pips in the right direction. This helps protect against potential losses if the signal turns out to be false. On Monday, there are absolutely no important events or releases scheduled in the Eurozone or the US. The only report worth mentioning is Germany's industrial production data, but all traders understand that its maximum impact might yield a reaction of just 20 pips. Trading Recommendations: On Monday, traders can look to trade from the area of 1.1657-1.1666 since the price has been hovering around this zone for several days. In the event of a bounce from this area, consider short positions with a target of 1.1620. If the price consolidates above this area, consider long positions with a target of 1.1750. It is also possible to capitalize on bounces from the critical Kijun-sen line.

    Analysis are provided by InstaForex.

    Read more: https://ifxpr.com/4iKDnN8

  6. #1956
    Junior Member
    Join Date
    Mar 2024
    Posts
    393
    Forex Analysis & Reviews: Trading Recommendations and Trade Analysis for GBP/USD on December 9. Another Local Flat for the Pound

    GBP/USD Analysis 5M


    The GBP/USD currency pair traded very calmly on Monday, even weaker than the EUR/USD pair, which is quite rare. Throughout the day, the British pound fell to 1.3307 in the absence of any fundamental or macroeconomic events. Thus, the pair is now positioned near the trend line and close to the Kijun-sen line. The upward trend persists, but the European currency has already shown an inexplicable decline this week. Recall that the results of the Federal Reserve meeting will be known tomorrow evening, and they are likely to be "dovish." Thus, the dollar's initial strengthening this week (albeit weak) looks surprising. However, the dollar has repeatedly surprised both traders and analysts in recent months. Most still cannot understand why the dollar is rising when it should be falling. We believe that the key factor remains the flat on the daily timeframe, specifically the flat for the euro. The British pound has formed a complete downward correction, but its decline is limited by the euro's drop within its sideways channel. It will be difficult for the euro to drop below 1.1400 anytime soon. Moreover, even reaching the 1.1400 level will be challenging given the volatility in recent months. On the 5-minute timeframe, a trading signal was formed yesterday evening. The price reached 1.3307, reacted perfectly, rebounded from it, and moved up by about 10 pips. The day's overall volatility was 40.

    COT Report


    COT reports for the British pound show that, in recent years, sentiment among commercial traders has been constantly changing. The red and blue lines depicting the net positions of commercial and non-commercial traders frequently cross and are mostly located near the zero mark. Currently, they are practically at the same level, indicating an approximately equal number of buy and sell positions. The dollar continues to decline due to Donald Trump's policies, as clearly seen on the weekly timeframe (illustration above). The trade war will continue in one form or another for a long time. The Fed will, in any case, be lowering rates over the next 12 months. Demand for the dollar will fall in one way or another. According to the last COT report (dated October 28) for the British pound, the "Non-commercial" group opened 7,000 contracts for BUY and 10,500 contracts for SELL. Thus, the net position of non-commercial traders decreased by 3,500 contracts over the week. However, this data is already outdated, and no fresh figures are available. In 2025, the pound rose significantly, but it should be understood that the reason is one: Donald Trump's policies. Once this reason is neutralized, the dollar may begin to rise, but when that will happen is uncertain. It doesn't matter at what pace the net position for the pound is rising or falling (if it is falling). The net position for the dollar is declining in any case, and usually at a higher rate.

    GBP/USD Analysis 1H

    On the hourly timeframe, the GBP/USD pair continues to form an upward trend. We believe that growth in the medium term will continue regardless of the local macroeconomic and fundamental backdrop, and the correction on the daily timeframe will eventually be completed. Or may already have been completed. However, much will depend on U.S. labor market data, unemployment, and inflation this December, which will determine the direction of the Fed's monetary policy. For December 9, we highlight the following important levels: 1.2863, 1.2981-1.2987, 1.3042-1.3050, 1.3096-1.3115, 1.3201-1.3212, 1.3307, 1.3369-1.3377, 1.3420, 1.3533-1.3548, 1.3584. The Senkou Span B line (1.3155) and Kijun-sen line (1.3279) may also provide signals. It is recommended to set the Stop Loss at breakeven if the price moves in the correct direction by 20 pips. The Ichimoku indicator lines may move throughout the day, which should be taken into account when determining trading signals. On Tuesday, there are no significant events or reports planned in the UK, but the U.S. will release relatively important JOLTs reports on job openings and ADP reports on changes in the private sector's workforce (weekly version). Thus, high volatility is unlikely today, but the pair may trade somewhat more actively in the afternoon. Trading Recommendations: Today, traders may consider selling if the price re-establishes below the Kijun-sen line, with a target at 1.3201-1.3212. Long positions will become relevant upon a bounce from the 1.3307 level with a target at 1.3369-1.3377. Illustration Explanations: Support and Resistance Levels: Thick red lines where price movement may end. These are not sources of trading signals. Kijun-sen and Senkou Span B Lines: Ichimoku indicator lines projected onto the hourly timeframe from the 4-hour timeframe. These are strong lines. Extreme Levels: Thin red lines where the price previously rebounded. These are sources of trading signals. Yellow Lines: Trend lines, trend channels, and any other technical patterns. Indicator 1 on COT Charts: The size of the net position for each category of traders.

    Analysis are provided by InstaForex.


    Read more: https://ifxpr.com/4iKTZEt

  7. #1957
    Junior Member
    Join Date
    Mar 2024
    Posts
    393
    Forex Analysis & Reviews: Trading Recommendations and Deal Analysis for EUR/USD on December 10. Dollar Calm Before FOMC Meeting

    Analysis of EUR/USD (5M)


    The EUR/USD currency pair continued its movement on Tuesday, which might only provoke a nervous tic in most traders. For the fifth consecutive day, the quotes of the European currency slid down at a pace not even a pregnant turtle would envy. Over the full five trading days, the pair fell 44 pips, while the average volatility during this period was 49 pips. Thus, we continue to note the obvious fact – market movements are virtually non-existent. Yesterday, even relatively important reports like ADP and JOLTs did not help. We warned that the data on job openings has long been outdated and that the ADP report is now published not once a month but weekly, which sharply reduces its already low significance. As a result, yesterday, traders paid no attention to either ADP or JOLTs. To be precise, the market's reaction to these three reports (JOLTs was published two months late) amounted to a 20-pip move. Due to the fact that the number of job openings exceeded forecasts, the US dollar appreciated by 20 pips, which it successfully lost over the next half hour. Regarding trading signals, it again made no sense to consider them yesterday. The price during the European session perfectly bounced off the level of 1.1657, but what was the sense in opening a short position when 20 pips lower was the Kijun-sen line? The price settled below the Kijun-sen line, but what was the point of opening a short position when the support area of 1.1604-1.1615 lay 20 pips lower?

    COT Report


    The latest COT report was released last week and is dated October 28. Thus, it is, to put it mildly, outdated. The illustration above clearly shows that the net position of non-commercial traders has been "bullish" for a long time; bears struggled to enter their zone of superiority at the end of 2024, but quickly lost it. Since Trump took office as President of the United States for a second time, only the dollar has been falling. We cannot say with 100% certainty that the decline of the American currency will continue, but current developments around the world suggest it is likely. We still do not see any fundamental factors supporting the strengthening of the European currency, while there are enough factors for the decline of the American one. The global downward trend persists, but what significance does it have now where the price moved in the past 17 years? The dollar could appreciate if the global fundamental picture changes, but so far, there are no signs of that. The positioning of the red and blue lines of the indicator continues to indicate a maintained "bullish" trend. During the last reporting week, the number of long positions for the "Non-commercial" group increased by 5,900, while the number of shorts increased by 10,300. Accordingly, the net position decreased by 4,400 contracts over the week. However, this data is already outdated and holds no importance.

    Analysis of EUR/USD (1H)


    On the hourly timeframe, the EUR/USD pair may have completed another upward trend, but we would not draw such conclusions, given the nature of the pair's movement in recent months, until it settles below the Senkou Span B line. The price remains within the sideways channel of 1.1400-1.1830 on the daily timeframe; therefore, a further strengthening of the euro to 1.1800 can still be expected in the near future. The growth of the European currency is extremely weak, but movements within the flat are always weak and chaotic. For December 10, we highlight the following levels for trading: 1.1234, 1.1274, 1.1362, 1.1426, 1.1542, 1.1604-1.1615, 1.1657-1.1666, 1.1750-1.1760, 1.1846-1.1857, 1.1922, 1.1971-1.1988, as well as the Senkou Span B line (1.1597) and Kijun-sen (1.1649). The Ichimoku indicator lines may move throughout the day, which should be taken into account when determining trading signals. Do not forget to set a stop-loss order at break-even if the price has moved in the right direction by 15 pips. This will protect against possible losses if the signal turns out to be false. On Wednesday, European Central Bank President Christine Lagarde is scheduled to speak in the European Union, and in the US, a key event of the current week will take place – the FOMC meeting. The decision on the key rate seems to have already been made, but in addition to the rate, the "dot-plot" schedule will be published, and Jerome Powell will give a speech. A sharp increase in volatility can be expected in the evening. Trading Recommendations: On Wednesday, traders may again trade from the area of 1.1604-1.1615. However, above this area lies the Kijun-sen line, and below – the Senkou Span B. We would advise waiting for signals to form when the target is not 20 pips away. Additionally, the FOMC meeting in the evening may provoke moves in either direction, which should be kept in mind

    Analysis are provided by InstaForex.

    Read more: https://ifxpr.com/4iNALhx

  8. #1958
    Junior Member
    Join Date
    Mar 2024
    Posts
    393
    Forex Analysis & Reviews: GBP/USD Overview. December 11. The British Pound Feels Confident


    The GBP/USD currency pair traded relatively weakly on Wednesday, at least until the FOMC meeting, the results of which and the market reaction will not be discussed in this article. The outcomes will be summarized tomorrow, once the market's passions have settled. For this week, only one significant event can be highlighted. On Tuesday, the JOLTs report on job openings was released, prompting the first more noticeable movement. The US dollar strengthened slightly as the number of job openings exceeded forecasts. However, it's worth recalling that the JOLTs report has never been a key indicator for the US labor market. Key reports will be published next week, and these could awaken the market. Although there are doubts about this. At the moment, it is still unclear whether the correction on the daily timeframe has ended. The euro remains within its sideways channel, thus limiting the potential for the British pound to decline. We already believe that the pound has weakened too much in the second half of 2025. From its yearly high, the British currency has lost around 45%, while the euro has depreciated only by 23%. Yes, the UK has had its share of "wonderful" reports and fundamentals, while the Bank of England, unlike the European Central Bank, continues to ease monetary policy. Next week, it may cut the key rate for the fourth time this year. Therefore, a more substantial decline in the pound seems justified. Yet at the same time, this decline occurs within an upward trend, whose renewal we are all waiting for. We continue to consider the key level for the pound to be the Senkou Span B line of the Ichimoku indicator on the daily timeframe. This line is positioned at 1.3364, and it was at this level that the last wave of growth stalled. Thus, the strength and importance of this line have already been confirmed. If the price settles above it, the trend will change to bullish according to the Ichimoku indicator, which is what we anticipate. In our view, the market has ignored a significant number of factors indicating a decline in the US dollar over recent months. Still, it has responded triply to factors indicating a decline for the pound. This week, Andrew Bailey gave a speech, but the Governor of the BoE did not consider it necessary to enlighten the market on what decision would be made next week or what it would depend on. Hence, there remains very little information coming into the market. As we mentioned earlier, the JOLTs and ADP reports are interesting, but they are overshadowed by the FOMC meeting and the upcoming Non-Farm Payrolls, unemployment rates, and consumer price index reports.


    The average volatility of the GBP/USD pair over the last five trading days is 53 pips, which is considered "low" for this currency pair. Therefore, on December 11, we expect movement within the range of 1.3278-1.3384. The upper channel of the linear regression is directed downwards, but only due to the technical correction on higher timeframes. The CCI indicator has entered the oversold territory six times over the past months and has formed several bullish divergences, constantly warning of a potential resumption of the upward trend. Last week, the indicator "visited" the overbought area, and yesterday it formed another bullish divergence. Nearest Support Levels: S1 – 1.3306 S2 – 1.3245 S3 – 1.3184 Nearest Resistance Levels: R1 – 1.3367 R2 – 1.3428 R3 – 1.3489 Trading Recommendations: The GBP/USD currency pair is attempting to resume its upward trend in 2025, and its long-term prospects remain unchanged. Donald Trump's policies will continue to exert pressure on the dollar, so we do not expect the US currency to appreciate. Long positions with targets at 1.3428 and 1.3489 remain relevant for the near term while the price is above the moving average. If the price is positioned below the moving average line, small shorts can be considered with targets at 1.3245 and 1.3184 on technical grounds. Occasionally, the US currency shows corrections (globally), but for a trend-based strengthening, it needs signs of the end of the trade war or other global positive factors. Illustration Explanations: Price Levels (Support/Resistance): Thick red lines where movement may end. They are not sources of trading signals. Kijun-sen and Senkou Span B Lines: Strong lines of the Ichimoku indicator transferred to the hourly timeframe from the 4-hour timeframe. Extreme Levels: Thin red lines where the price has previously bounced. These are sources of trading signals. Yellow Lines: Trendlines, trend channels, and other technical patterns. Indicator 1 on COT Charts: Represents the net position of each trader category.

    Analysis are provided by InstaForex.

    Read more: https://ifxpr.com/48RJgDL

  9. #1959
    Junior Member
    Join Date
    Mar 2024
    Posts
    393
    Forex Analysis & Reviews: EUR/USD Overview. December 12. The Market Made the Right Decision: The Dollar Is Falling Again


    The EUR/USD currency pair resumed its upward movement on Wednesday and Thursday. This marks the market's almost first logical reaction to an important fundamental event in recent months. Remember that on Wednesday evening, the Federal Reserve announced its decision to lower the key interest rate by another 0.25%, which, naturally, was expected to provoke a decline in the US dollar. However, starting from September, the market had been engaged in various activities, excluding a logical response to macroeconomics and fundamentals. The explanation for this is quite simple — the sideways movement on the daily timeframe. Based on this same sideways trend, we have predicted a rise in the pair to 1.1800, even without the Fed meeting. It should be understood that the market has been trading illogically for the past few months, but this situation cannot last forever. A sideways range always leads to random movements and is never a coincidence. Simply put, a sideways range occurs when market makers establish new positions in anticipation of a new trend. Therefore, the movements we have observed over the last five months (and continue to observe) should not be explained by macroeconomic or fundamental events. The pair is currently rising primarily because it has reversed near the lower boundary of the sideways channel at 1.1400-1.1830. Thus, a move to initiate a downward trend has not happened after the sideways range. There were no grounds for such a scenario. Now we should expect growth toward the upper boundary of the range, and two scenarios may follow. Either a new reversal downward and continuation of the sideways movement, or a breakout from the range and resumption of the upward trend of 2025. Of course, we favor the second option. If we analyze the Fed meeting in detail, the dollar was more expected to show growth. Yes, the key rate was lowered; however, what was surprising about this for traders? For three consecutive weeks, information has been flowing from every source stating that the Fed is preparing for another round of easing. Thus, the market had ample time to price in this event in advance. As for 2026, which, by the way, begins in 20 days, the Fed has revealed completely different plans, which we have also warned about multiple times. The Fed plans to pause the easing process until inflation moves towards the target level of 2%. How will inflation move towards 2% if the Fed has cut rates three times already? However, understanding this allows us to assume that the next rate cut will not happen anytime soon. This is excellent news for the US dollar, as in 2025, anything that isn't bad is already good. Nevertheless, the market, which has held the dollar in a "golden cage" for five months, has grown tired of this. On the daily timeframe, the pair could return to the yearly highs before the New Year.


    The average volatility of the EUR/USD pair over the last five trading days as of December 12 is 62 pips, characterized as "medium." We expect the pair to move between levels 1.1696 and 1.1820 on Friday. The upper channel of linear regression is directed downwards, signaling a bearish trend, but in reality, the pair is still in a sideways range on the daily timeframe. The CCI indicator entered the oversold area twice in October (!!!), which may provoke a new upward trend in 2025. Nearest Support Levels: S1 – 1.1749 S2 – 1.1719 S3 – 1.1688 Nearest Resistance Levels: R1 – 1.1780 Trading Recommendations: On Friday, traders can trade from the area of 1.1750-1.1760. A price bounce from this area will allow traders to open short positions targeting the Kijun-sen line at 1.1686. A breakout of the stated area will allow for holding long positions or opening new ones with a target of 1.1800-1.1830. Notes on Illustrations: Support and resistance price levels (resistance/support) — thick red lines near which the movement may end. They are not sources of trading signals. The Kijun-sen and Senkou Span B lines are Ichimoku indicator lines transferred to the hourly timeframe from the 4-hour timeframe. They are considered strong lines. Extreme levels are thin red lines from which the price has previously bounced. They are sources of trading signals. Yellow lines denote trendlines, trend channels, and any other technical patterns. Indicator 1 on COT charts shows the net position size of each category of traders.

    Analysis are provided by InstaForex.

    Read more: https://ifxpr.com/3MvmlXg

  10. #1960
    Junior Member
    Join Date
    Mar 2024
    Posts
    393
    Forex Analysis & Reviews: Trading Recommendations and Deal Analysis for EUR/USD on December 15. The Week Ends with a New Range

    Analysis of EUR/USD 5M


    The EUR/USD currency pair showed no notable movements on Friday, with overall volatility for the day at just 31 pips. The only macroeconomic event of note on Friday was German inflation, but we had already warned that market reactions to the report could be minimal. The reason is that inflation in many countries is published in two estimates. The market reacts to the first, while the second rarely differs from the first and is typically ignored. Thus, it can be concluded that there were no significant events on Friday, and the pair's movement throughout the day fully aligned with the fundamental and macroeconomic backdrop. From a technical standpoint, the hourly timeframe continues to show an upward trend, but the pair failed to overcome the 1.1750-1.1760 area on its first attempt. Recall that we had predicted the euro would reach at least 1.1800 when the price was around 1.1500. The pair has been within the sideways channel of 1.1400-1.1830 for six months on the daily timeframe, so after the rebound near the lower boundary of the range, growth towards the upper boundary was reasonably expected. If the area of 1.1750-1.1760 is surpassed, growth will continue towards 1.1800-1.1830. If this area fails to hold, the upward trend of 2025 will resume. On the 5-minute timeframe, no trading signals were formed on Friday. Therefore, there were no grounds for traders to open positions. This turned out to be for the best, as there were no movements during the day.

    COT Report

    https://forex-images.ifxdb.com/userf...be_source!.jpg

    The latest COT report was released last week and is dated November 18. Thus, it is still outdated. The illustration above clearly shows that the net position of non-commercial traders has long been "bullish," with bears struggling to move into their own zone of superiority at the end of 2024 but quickly losing it. Since Trump took office as president of the United States for the second time, only the dollar has been declining. We cannot say with 100% certainty that the decline of the American currency will continue, but current global developments suggest this possibility. We still do not see any fundamental factors that would strengthen the European currency, while there are enough factors that would weaken the American one. The global downward trend remains in place, but what does it matter where the price has moved in the last 17 years? The dollar could rise if the global fundamental picture changes, but there are currently no signs of that. The placement of the red and blue lines of the indicator continues to indicate a sustained "bullish" trend. During the last reporting week, the number of longs in the "Non-commercial" group increased by 8,000, while the number of shorts decreased by 17,400. Consequently, the net position grew by 25,400 contracts over the week. However, this data is still outdated and holds no significance.

    Analysis of EUR/USD 1H


    On the hourly timeframe, the EUR/USD pair continues its upward movement, in line with our expectations. As we warned, it is not wise to rush to conclusions about the end of the upward trend until there is a consolidation below the Senkou Span B line. The price remains within the sideways channel of 1.1400-1.1830 on the daily timeframe, so further strengthening of the euro toward the level of 1.1800 can still be anticipated. We also expect the upward trend of 2025 to resume in December. For December 15, we highlight the following trading levels: 1.1234, 1.1274, 1.1362, 1.1426, 1.1542, 1.1604-1.1615, 1.1657-1.1666, 1.1750-1.1760, 1.1846-1.1857, 1.1922, 1.1971-1.1988, as well as Senkou Span B (1.1616) and Kijun-sen (1.1690) lines. The Ichimoku indicator lines may shift throughout the day, which should be considered when determining trading signals. Don't forget to set a Stop Loss order to breakeven if the price moves in the correct direction by 15 pips. This will safeguard against potential losses if the signal turns out to be false. On Monday, a joint report is scheduled for the Eurozone and the US: industrial production in the EU. This report is not the most important, so we do not expect strong movements today. The EUR/USD pair will face a significant technical dilemma soon – to conclude the flat on the daily timeframe or to remain in the sideways channel of 1.1400-1.1830. Trading Recommendations: On Monday, traders may trade from the area of 1.1750-1.1760. A price bounce from this area will allow traders to open short positions targeting the Kijun-sen line at 1.1690. Overcoming the specified area will allow for holding long positions or opening new ones with targets at 1.1800-1.1830 and 1.1846. Explanations for Illustrations: Support and resistance price levels – thick red lines around which movements may conclude. These are not sources of trading signals. Kijun-sen and Senkou Span B lines – lines of the Ichimoku indicator transferred to the hourly timeframe from the 4-hour timeframe. They are strong lines. Extreme levels – thin red lines from which the price has previously bounced. These are sources of trading signals. Yellow lines – trend lines, trend channels, and any other technical patterns. Indicator 1 on COT charts – the size of the net position of each category of traders.

    Analysis are provided by InstaForex.


    Read more: https://ifxpr.com/48TsCDI

Page 196 of 196 FirstFirst ... 96 146 186 194 195 196

Tags for this Thread

Bookmarks

Posting Permissions

  • You may not post new threads
  • You may not post replies
  • You may not post attachments
  • You may not edit your posts
  •