Page 7 of 8 FirstFirst ... 5 6 7 8 LastLast
Results 61 to 70 of 74
Like Tree2Likes

Daily Market Analysis and Overview by Unitedpips

This is a discussion on Daily Market Analysis and Overview by Unitedpips within the Analytics and News forums, part of the Trading Forum category; EUR/USD Price Action: Is the Euro Ready to Break Resistance? Introduction to EUR/USD The EURUSD pair represents the exchange rate ...


  1. #61
    Junior Member
    Join Date
    Oct 2024
    Posts
    74
    EUR/USD Price Action: Is the Euro Ready to Break Resistance?


    Introduction to EUR/USD
    The EURUSD pair represents the exchange rate between the Euro and the US Dollar, two of the most influential currencies in global markets. As one of the most traded currency pairs in the world, EUR-USD holds significant importance for traders and investors. Understanding the fluctuations of this pair is essential for market participants, as it reflects not only the relative strength of the two economies but also broader geopolitical and monetary trends. The nickname for this pair is "Fiber," derived from the Euro's name in the Forex market, and it is highly sensitive to global economic developments.


    EURUSD Market Overview
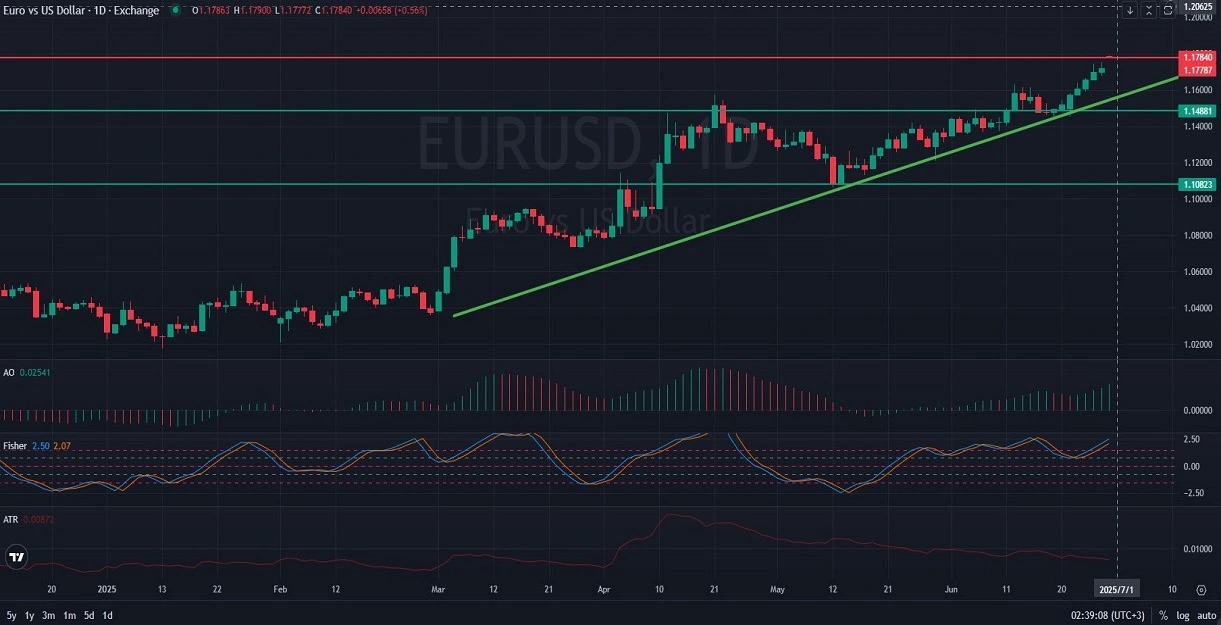
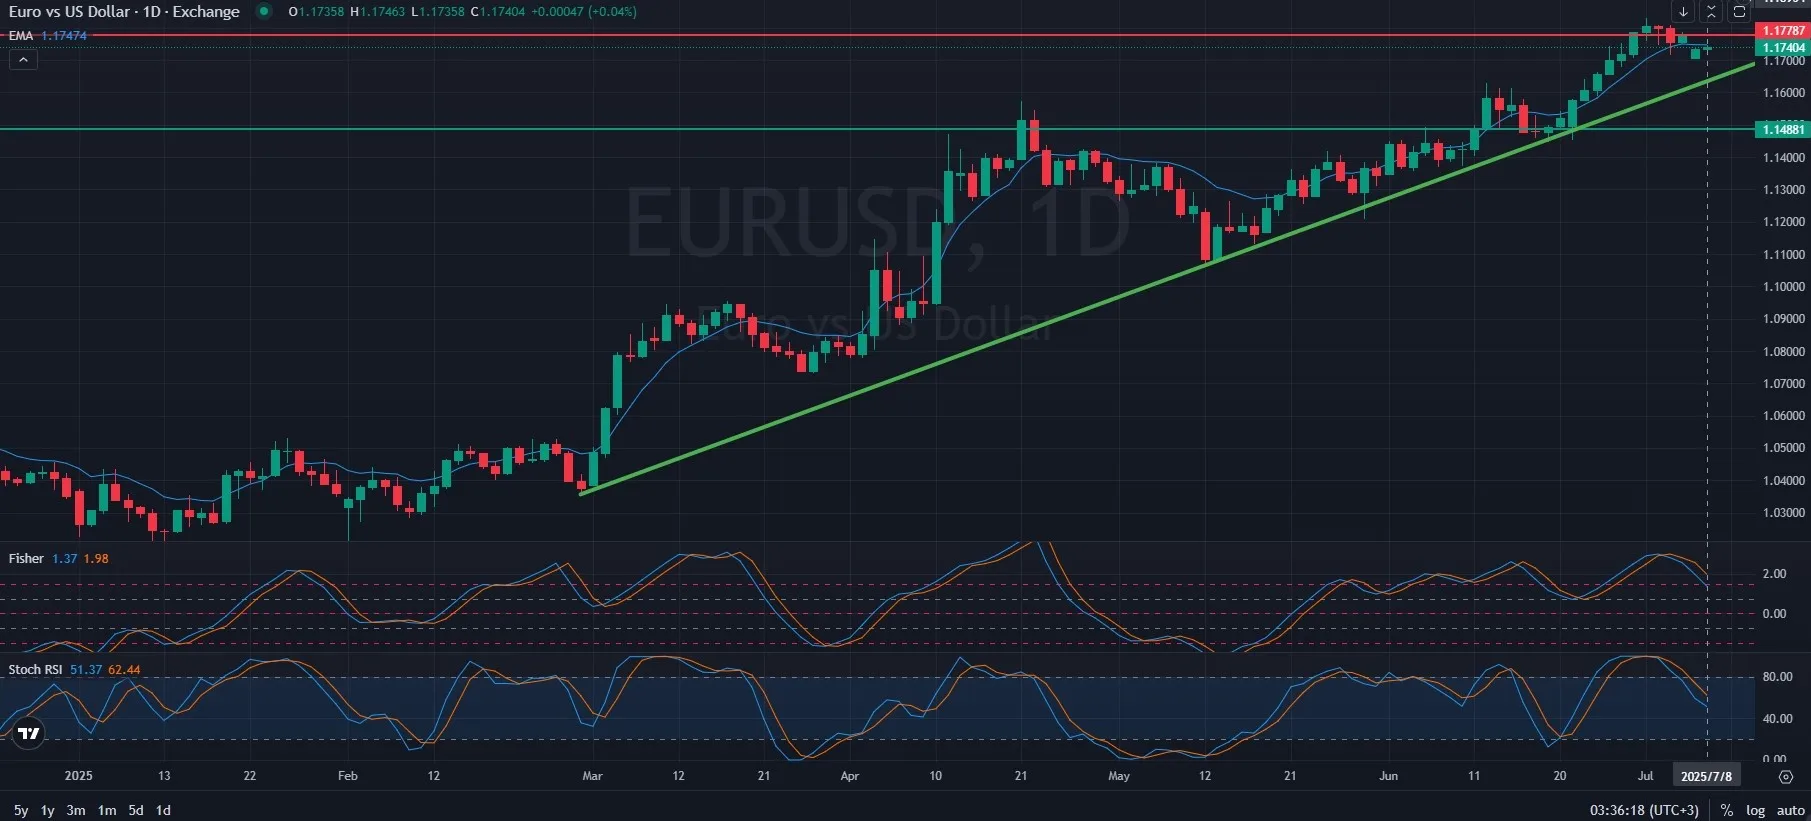
    The EUR USD currency pair has recently been experiencing upward momentum, breaking through key resistance levels and approaching the long-term resistance line, which has held for years. Economic news from the U.S. has been influential, with Federal Reserve Chair Jerome Powell making statements at the ECB Forum on Central Banking in Sintra, sparking potential market volatility. Investors are keenly watching for hints regarding future monetary policy decisions, particularly as the U.S. labor market shows resilience, with positive job openings reports and inflation indicators expected. Meanwhile, European economic data, including manufacturing indices, is expected to play a critical role in determining whether the Euro can maintain its strength against the U.S. Dollar. The next few days are crucial for EUR/USD, as the market will likely react to speeches from key central bank figures, including European Central Bank President Christine Lagarde, whose tone could influence the Euro's short-term outlook. As we approach the upcoming data releases, the balance of monetary policy expectations between the ECB and the Fed will drive short-term price action.


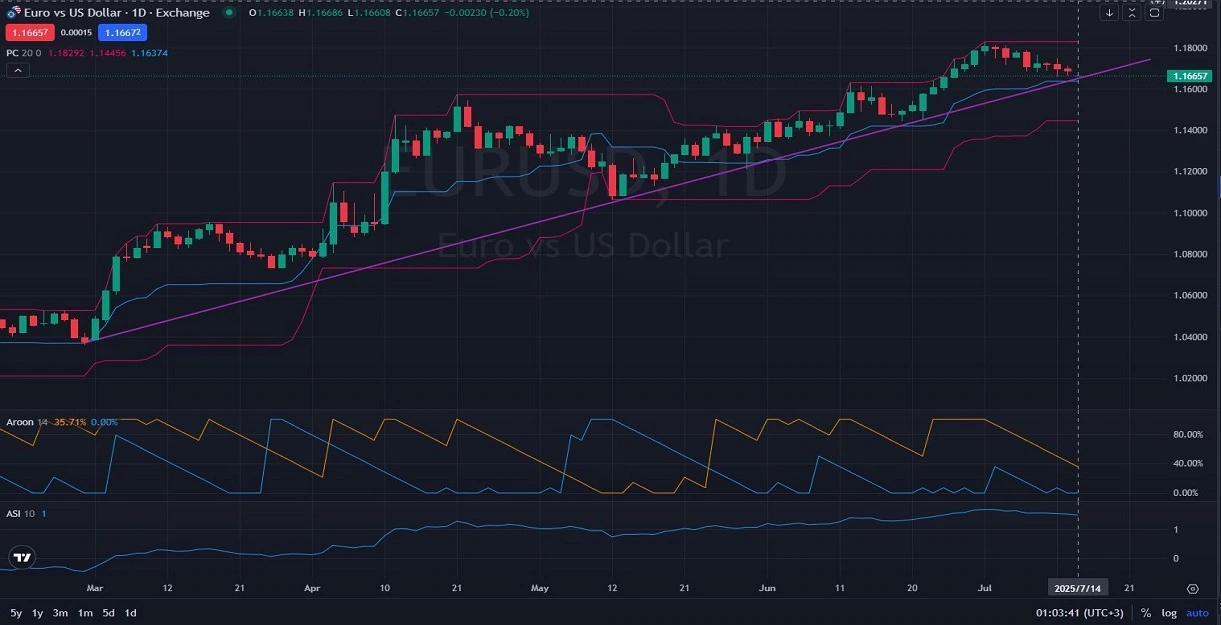
    EUR/USD Technical Analysis
    Looking at the daily chart of EUR-USD, the price is currently approaching a long-term resistance level, one that has been in place for the past four years. Despite the strong momentum in the recent uptrend, it seems unlikely that the price will break this resistance level on its first attempt. However, if the momentum continues, there is a possibility of a breakthrough on a retest. Should the price correct, the first target would likely be the trend line at around 1.14881, and if further decline occurs, we could see a retracement towards 1.10823. The Awesome Oscillator (AO) currently indicates strong bullish momentum, suggesting that buying pressure remains in play. The Fisher Transform indicator is signaling a continuation of this upward move, with values supporting a possible breakout. On the other hand, the Average True Range (ATR) is showing relatively low volatility, which may point to a period of consolidation before any significant price movements.


    Final Words about EUR vs USD
    In conclusion, EURUSD has entered a critical phase, where the price is testing a long-standing resistance level. While immediate breakout potential may seem limited, the current bullish momentum and economic drivers, such as central bank speeches and U.S. labor market data, suggest that the Euro might continue its strength against the U.S. Dollar. Traders should monitor price action closely at this resistance level and be prepared for either a breakout or a correction toward the trend line. The upcoming economic data from both sides of the Atlantic will be key to shaping the direction of this currency pair in the near future.


    07.01.2025

  2. #62
    Junior Member
    Join Date
    Oct 2024
    Posts
    74
    USD/CHF Analysis: Bearish Momentum with Safe-Haven Support


    Introduction to USD-CHF
    The USDCHF pair, often referred to as the "Swissie," represents the exchange rate between the US Dollar and the Swiss Franc. This pair is known for its stable and relatively low volatility compared to other major currency pairs, making it a popular choice among risk-averse traders. USDCHF movements are influenced by economic indicators and policy decisions in both the United States and Switzerland, as well as global risk sentiment, since the Swiss Franc is considered a safe-haven currency. Traders watch for economic data, interest rate decisions, and geopolitical events to anticipate price fluctuations.


    USD/CHF Market Overview
    The USDCHF pair is currently experiencing mixed movement, with the US Dollar supported by strong economic data, including a 99K rise in ADP Non-Farm Employment and positive Factory Orders. However, the Swiss Franc remains resilient, backed by stable inflation figures. Traders are watching for upcoming events, such as FOMC Member Bostic's speech, which could impact USD strength. While the US economic outlook is positive, the Swiss Franc's safe-haven status may limit significant fluctuations, keeping the pair's movement contained in the near term.


    USDCHF Technical Analysis
    On the daily chart of USDCHF, the pair is experiencing a significant downward movement after recently breaking below a key support zone around 0.7900. Price action confirms the bearish sentiment, as recent lows have been lower than previous troughs, reflecting ongoing selling pressure. The RSI is currently at 25.75, indicating that the pair is in oversold conditions, which suggests the possibility of a short-term correction or bounce.
    The MACD is showing negative momentum, with the MACD line well below the signal line, confirming continued bearish momentum. As the pair trades below the 22-day Exponential Moving Average (EMA 22), this further supports the downtrend, with no signs of a reversal at the moment. Traders should remain cautious, as the combination of these indicators suggests further downside potential in the near term.


    Final Words about USD vs CHF
    In conclusion, the USDCHF pair presents a mixed outlook, driven by the interplay of strong US economic data and the Swiss Franc's role as a safe-haven currency. While the US Dollar remains supported by solid economic indicators, such as rising employment and factory orders, the Swiss Franc's stability and low volatility keep the pair contained. Technically, the break below key support and bearish signals from the RSI and MACD suggest continued downside potential, although oversold conditions hint at a possible short-term correction. Traders should remain vigilant, closely monitoring upcoming economic events and potential shifts in risk sentiment that could influence the pair's movements in the near term.


    07.02.2025

  3. #63
    Junior Member
    Join Date
    Oct 2024
    Posts
    74
    SILVERUSD Analysis: What Traders Should Watch Next


    Introduction to SILVER/USD
    The SILVER/USD pair, also known by its commodity ticker XAG/USD, reflects the value of one troy ounce of silver quoted in US dollars. Often referred to simply as “silver,” this precious metal is both an industrial input and a safe-haven asset. Traders often use this pair as a hedge against inflation, currency weakness, or geopolitical risk. Given its dual nature, SILVER USD is influenced by both economic indicators and commodity demand factors.


    SILVERUSD Market Overview
    SILVERUSD is currently maintaining a bullish tone, trading just below recent highs around the $36.40 mark. The bullish momentum is partly supported by a slightly weaker US dollar amid cautious optimism over labor market signals. Recently released US job data, including Non-Farm Payrolls, Unemployment Rate, and Initial Jobless Claims, suggests a still-resilient labor market but without significant overheating. Traders are closely watching the US employment numbers scheduled for August 1, 2025, which could be pivotal for future dollar strength. Meanwhile, speeches from FOMC members like Raphael Bostic are contributing to expectations around monetary policy stability, which might continue to influence precious metals, especially silver, which reacts sensitively to interest rate sentiment.


    SILVERUSD Technical Analysis
    The daily chart of SILVER-USD reveals strong bullish momentum, with price action staying in the upper half of a long-term rising price channel, just below the resistance trendline around the $37.00 mark. The current price is consolidating near $36.37, showing resilience after a recent pullback. The Money Flow Index (MFI) sits at 63.75, signaling healthy inflows but not yet in overbought territory. Volume activity remains stable, supporting continued buying pressure. Notably, silver is holding above the middle band of the Price Channel, indicating strength. A break above the rising resistance could open the door to a push beyond $37.00, while support rests around $35.00, followed by a stronger floor near $33.00.


    Final Words about Silver vs US Dollar
    SILVER/USD continues to demonstrate bullish characteristics, with both price action and volume indicators favoring the upside. However, the price remains close to a long-standing resistance line, which may cause short-term consolidations or pullbacks. Any dovish commentary from the Fed or signs of a cooling labor market in upcoming US economic releases could weaken the dollar and further fuel silver's rally. On the flip side, strong labor data or a hawkish Fed tone could cap gains. Traders should remain vigilant near resistance zones and be prepared for increased volatility around key US data announcements.


    07.03.2025

  4. #64
    Junior Member
    Join Date
    Oct 2024
    Posts
    74
    EUR/JPY Forex Forecast: Bullish Signals from Indicators


    Introduction to EUR/JPY
    The EUR/JPY pair, representing the Euro and Japanese Yen, is one of the most popular currency pairs in the forex market. It combines the European Union’s Euro, a global reserve currency, with Japan’s Yen, which is heavily influenced by economic policies and global market conditions. This pair is often referred to as a "cross-currency pair" because it involves two currencies that don't include the US dollar, providing traders with additional opportunities for profit. The EUR/JPY is known for its volatility, often reacting to economic data releases and geopolitical events.


    EURJPY Market Overview
    In recent days, EURJPY has been in a notable uptrend, with the price moving above key support levels. The global market sentiment has been mixed, with inflation figures in Europe and Japan showing some signs of stability but also volatility due to changing global conditions. Recent news out of Europe indicates stable growth with better-than-expected industrial output and retail sales data. This has provided the Euro with some support. In Japan, while consumer spending remains robust, analysts are monitoring whether the inflationary pressures from global markets will affect the Bank of Japan’s policies. These global developments are critical as they might influence future movements in EUR/JPY. As traders digest these fundamental factors, price action has been relatively bullish, supported by the strengthening of the Euro against the Yen.


    EUR-JPY Technical Analysis
    On the daily chart, EUR-JPY is showing a strong bullish trend. The price is positioned in the upper half of the regression channel, indicating the market is in an uptrend. The price remains well above all the Alligator lines, with the green lips at the top, red teeth in the middle, and blue jaws at the bottom, signaling a bullish market structure. Additionally, the MACD indicator shows the MACD and signal lines are both above the zero line, suggesting that the momentum is in favor of the bulls. The histogram supports this with a positive reading, reinforcing the bullish sentiment. Furthermore, the Fisher indicator shows that both the Fisher line and the Trigger line are positioned above the neutral level, indicating strong bullish momentum. Finally, the Accelerator Oscillator (AO) is at -0.045, showing that while the market is still in a bullish phase, the buying pressure might be slowing down slightly. This overall technical outlook suggests that EUR JPY has strong bullish potential in the short term, though caution should be taken as the price approaches resistance levels.


    Final Words about EUR vs JPY
    The current technical indicators strongly support the bullish trend in EUR/JPY. With the price above the key support levels and the majority of indicators aligning for a continued upward movement, traders can be optimistic for the short term. However, it is crucial to watch out for upcoming economic releases, particularly from the Eurozone and Japan, which could provide fresh direction to the pair. As the market approaches key resistance levels, a careful assessment of price action near those levels will be important. For traders looking to take advantage of the trend, staying informed about both technical and fundamental factors is essential to navigate potential volatility in the coming days.


    07.04.2025

  5. #65
    Junior Member
    Join Date
    Oct 2024
    Posts
    74
    EURUSD Pair Technical Insights: Consolidation or Correction?


    Introduction to EUR/USD
    EUR-USD, commonly known as "Fiber," is one of the most actively traded currency pairs globally. This major pair represents the exchange rate between the Euro (EUR) and the US Dollar (USD), reflecting economic conditions between the Eurozone and the United States. Traders closely monitor this pair due to its liquidity and volatility, making it essential for investors seeking insights into global economic health.


    EUR USD Market Overview
    The EUR/USD pair is currently experiencing upward momentum, supported by recent favorable economic data from the Eurozone. Germany's trade balance has indicated increased exports, highlighting strong external demand which bolsters the Euro. Furthermore, traders are anticipating the speech by Deutsche Bundesbank President Joachim Nagel, whose hawkish stance could further strengthen the Euro if it signals tighter monetary policy by the ECB. On the US front, the NFIB small business index and consumer credit data indicate stable economic confidence, lending moderate support to the USD. However, recent volatility in oil inventory data from the API could inject short-term uncertainty into USD valuations. Traders should closely monitor the upcoming economic releases from both regions, which could significantly influence market sentiment in the immediate term.


    EUR-USD Technical Analysis
    On the daily chart, EURUSD recently tested resistance at the 1.17780 level and formed a hanging man candlestick pattern, indicating potential bearish reversal pressure. Currently, the 9-day Exponential Moving Average (EMA9) is providing immediate support, but its effectiveness remains uncertain. Should EMA9 support fail, the ascending trendline acts as the next significant support, around the 1.17000 area. The Fisher oscillator remains positive but shows signs of weakening momentum, suggesting caution. Similarly, the Stochastic RSI oscillator, currently neutral, points toward possible consolidation or slight downward pressure before another attempt to retest the 1.17780 resistance level.


    Final Words about EUR vs USD
    In conclusion, EUR-USD maintains a cautiously bullish outlook, but short-term corrective moves appear likely given recent technical signals. Traders should prepare for volatility around upcoming economic announcements and the Bundesbank President's speech, which could significantly influence EUR sentiment. Maintaining vigilance around key support levels, particularly EMA9 and the upward trendline, will be crucial in the coming trading sessions. A confirmed breakout above the resistance level at 1.17780 would signal continued bullish momentum, while a breakdown below trendline support could trigger further bearish corrective movements.


    07.08.2025

  6. #66
    Junior Member
    Join Date
    Oct 2024
    Posts
    74
    NZDUSD Analysis: Economic Drivers and Technical Outlook


    Introduction to NZD-USD
    The NZDUSD pair, often referred to as the "Kiwi," represents the exchange rate between the New Zealand Dollar and the US Dollar. It is a popular major currency pair known for its sensitivity to global risk sentiment, commodity prices—particularly dairy exports—and interest rate differentials between New Zealand and the United States. Movements in NZDUSD are influenced by economic data releases, central bank decisions (such as those from the RBNZ and the Federal Reserve), and broader market trends. Traders closely watch this pair for opportunities driven by changes in monetary policy and global market conditions.


    NZD/USD Market Overview
    The NADUSD pair represents the exchange rate between the Namibian Dollar and the US Dollar. While not a major pair, it is sensitive to USD-driven events. Today, several key U.S. economic indicators came into play. Final Wholesale Inventories showed a slight improvement at -0.2%, better than the expected -0.3%. Crude Oil Inventories posted a notable drawdown of 1.7 million barrels, indicating rising demand or reduced supply. The 10-year Bond Auction saw strong demand with a 4.42% yield and a bid-to-cover ratio of 2.5. The market’s main focus is now on the FOMC Meeting Minutes, expected to offer insight into the Fed’s future rate path. These developments could drive short-term volatility in the NADUSD pair.


    NZDUSD Technical Analysis
    On the daily chart of NZDUSD, the pair remains within a well-defined ascending channel but has recently faced a sharp pullback from the upper boundary, now testing the midline near the 0.6000 level. This decline suggests growing bearish pressure in the short term. The Stochastic Oscillator shows a bearish crossover, with the %K line at 48.02 below the %D line at 56.42, indicating fading bullish momentum and the potential for further downside. Volume has picked up slightly on recent red candles, reinforcing the likelihood of continued selling. While the price is still within the overall bullish channel, a break below the lower boundary could signal a shift in trend. Traders should watch for further confirmation from momentum indicators and price action around the channel support.


    Final Words about NZD vs USD
    In summary, the NZDUSD pair—commonly known as the "Kiwi"—continues to be influenced by a combination of economic fundamentals, central bank policies, and technical dynamics. While the broader trend remains within a rising channel, recent price action shows signs of short-term weakness as the pair pulls back from upper resistance levels. With key U.S. economic data and Fed commentary adding to potential volatility, traders should remain attentive to both macroeconomic releases and technical indicators. Continued monitoring of momentum signals and support levels will be crucial in determining whether the current pullback is a temporary correction or the start of a deeper reversal.


    07.09.2025

  7. #67
    Junior Member
    Join Date
    Oct 2024
    Posts
    74
    XAU/USD Forecast: Market Awaits US Economic Signals


    Introduction to XAU/USD
    The GOLD/USD pair, also known as XAU/USD, represents the spot price of Gold against the US dollar, widely referred to as the "Yellow Metal." This currency pairing is critical for traders seeking safe-haven assets during economic uncertainty. GOLDUSD movement indicates market sentiment towards risk and economic stability. Monitoring this pair provides essential insight into global economic health and market trends.


    GOLD-USD Market Overview
    Currently, the XAU/USD pair is witnessing a consolidation phase, influenced by recent economic data from the United States. The latest Department of Labor release indicated jobless claims data, which typically affects the US dollar’s strength. Furthermore, speeches by Federal Reserve officials, including Alberto Musalem, Christopher Waller, and Mary Daly, have added volatility due to their potential implications for monetary policy decisions. The market is closely watching natural gas inventory reports and Treasury bond auction outcomes, which could further impact investor confidence and influence GOLD/USD direction. These combined events have created cautious sentiment, keeping the pair trading within a tightening range ahead of upcoming economic data.


    XAU-USD Technical Analysis
    Analyzing the daily (D1) chart, GOLD USD is exhibiting a classic symmetrical triangle pattern, characterized by converging support and resistance lines, indicating a potential breakout scenario. The divergence between price action and the Relative Strength Index (RSI) suggests that the upward trend remains intact, raising the probability of an upward breakout. If the price breaks the triangle's upper boundary, the upper Bollinger Band, indicating potential resistance levels based on standard deviation, could become a significant target. Bollinger Bands currently indicate reduced volatility, which often precedes a breakout move. The Fischer oscillator confirms a neutral bias, while RSI hovering around 48 suggests balanced momentum, neither strongly bullish nor bearish, reinforcing the significance of the approaching breakout.


    Final Words about GOLD vs USD
    Considering the current market indicators and ongoing economic news from the US, the GOLD-USD pair appears poised for a significant breakout, likely leaning bullish given the technical indicators' signals. Traders should closely monitor key resistance and support levels defined by the symmetrical triangle for entry and exit signals. Furthermore, upcoming speeches from Federal Reserve members and economic data releases will play a crucial role in shaping short-term market sentiment. A disciplined risk management strategy is highly recommended due to the potential volatility around these market-moving events. Staying informed on macroeconomic developments remains essential for predicting and navigating potential price fluctuations.


    07.10.2025

  8. #68
    Junior Member
    Join Date
    Oct 2024
    Posts
    74
    Forex Alert: USD/CAD Approaching Critical Decision Point


    Introduction to USDCAD
    The USD-CAD pair, also known as the "Loonie," compares the value of the US Dollar to the Canadian Dollar. This pair is widely traded due to significant trade flows between the United States and Canada. Forex traders frequently analyze USDCAD for opportunities driven by shifts in commodity prices, particularly oil, given Canada's reliance on energy exports


    USD CAD Market Overview
    The USD/CAD currency pair is currently experiencing a downtrend correction despite maintaining an overall long-term upward trajectory. Recently, economic data from the US Department of the Treasury indicated the budget balance will influence the USD’s short-term strength. On the Canadian side, employment data from Statistics Canada will significantly impact the CAD. Positive employment changes and a reduced unemployment rate typically bolster the Canadian Dollar, possibly counteracting USD strength. Additionally, new building permit data, set for release shortly, will provide further insight into Canada's economic health, influencing traders' decisions on the USDCAD pair in the coming days.


    USD-CAD Technical Analysis
    On the daily chart, USDCAD is showing signs of correction within its broader bullish trend. After bouncing from its support level at approximately 1.35730, the pair managed to break the initial descending resistance line. However, it is currently struggling with a secondary resistance line, a crucial technical area for determining future price direction. The Bollinger Bands suggest price equilibrium, with the currency pair hovering around the middle band. The Awesome Oscillator indicates slight bearish momentum, whereas the StochRSI oscillator shows overbought conditions, suggesting potential downside pressure in the near term if the current resistance is not overcome.


    Final Words about USD vs CAD
    Considering the present technical and fundamental signals, USD/CAD traders should cautiously monitor the immediate resistance levels. The current correction within the long-term bullish trend could be temporary, but it warrants close observation. Upcoming economic data from both the US and Canada, including job statistics and building permits, will likely create volatility, offering opportunities for traders. Effective risk management and vigilance toward significant economic announcements are recommended due to potential rapid market shifts.


    07.11.2025

  9. #69
    Junior Member
    Join Date
    Oct 2024
    Posts
    74
    Daily Technical Analysis on EUR/USD: Eyes on Support


    Introduction to EUR/USD
    The EURUSD pair, often referred to as the “Fiber,” represents the exchange rate between the Euro and the US Dollar, the two most traded currencies in the world. This pairing is a cornerstone of the global forex market, serving as a benchmark for international traders and investors. Movements in the EUR/USD exchange rate provide insights into economic trends across both the Eurozone and the United States. As such, understanding EUR/USD dynamics is essential for anyone engaging in forex trading or macroeconomic analysis.


    EURUSD Market Overview
    The Euro vs US Dollar pair has recently been influenced by a series of significant economic reports from both sides of the Atlantic. On the Eurozone front, Germany’s latest ZEW Economic Sentiment Index highlighted a cautiously optimistic view, remaining above 0, signaling that institutional investors still foresee moderate growth despite broader uncertainties. Additionally, industrial output figures from Eurostat showed steady production levels, hinting at resilience in the Eurozone economy. Meanwhile, traders are closely watching the upcoming ECOFIN meetings, which could set the tone for fiscal policies impacting the Euro. Across the Atlantic, recent CPI data releases from the US Bureau of Labor Statistics revealed that core inflation is holding firm, reinforcing expectations that the Federal Reserve may maintain a more hawkish stance on interest rates. Upcoming speeches from Fed officials, including Bowman, Barr, Barkin, and Collins, are expected to provide further cues on monetary policy direction. The combination of steady inflation and robust manufacturing sentiment in New York continues to support the US Dollar’s strength, although the Euro remains underpinned by modest investor optimism and industrial stability. This balance of data keeps EUR USD in a relatively tight range, with traders watching for the next breakout.


    EUR USD Technical Analysis
    The daily chart of EUR/USD shows the pair maintaining its long-standing bullish momentum, despite recent minor pullbacks. The price action continues to respect an ascending trendline, which has acted as a solid support level after being tested approximately three times. Each test of this support has been met with buying pressure, suggesting that bulls still control the medium-term direction. Looking at indicators, the Price Channel shows the last few candles as red and positioned near the upper boundary, indicating a mild retracement within an overall upward move. The Aroon indicator reflects a weakening bullish drive, with the Aroon Up line sliding toward the 40% level while the Aroon Down remains at 0%, hinting at potential consolidation or a slight slowdown in bullish momentum. Meanwhile, the ASI (Accumulation Swing Index) remains comfortably above 1, signaling that the underlying strength of the trend is still intact. Overall, as long as the ascending trendline holds, EUR/USD is expected to continue its upward trajectory.


    Final Words about Euro vs US Dollar
    Given the technical setup and the blend of economic factors from both the Eurozone and the US, the outlook for EUR/USD remains cautiously bullish in the daily timeframe. Traders should closely watch the support trendline; a decisive break below could shift momentum in favor of the bears. However, sustained Eurozone investor optimism and stable industrial output, combined with the absence of any sharp hawkish pivot from the Fed beyond current expectations, may keep the pair supported. Going forward, key events such as the next ZEW release, Eurozone industrial data, and US CPI figures will likely be critical catalysts for any breakout. For now, the Fiber looks set to continue its steady climb, provided market sentiment remains stable. As always, traders are advised to stay updated on economic releases and maintain disciplined risk management given the pair’s susceptibility to swift shifts from macroeconomic headlines.


    07.15.2025

  10. #70
    Junior Member
    Join Date
    Oct 2024
    Posts
    74
    GBP/USD Outlook: Key Support Test Amid Diverging Data


    Introduction to GBP-USD
    The GBPUSD pair, commonly known as "Cable," represents the exchange rate between the British Pound Sterling and the US Dollar. It is one of the most widely traded major currency pairs, known for its liquidity and historical significance in the forex market. GBPUSD is heavily influenced by economic indicators from both the United Kingdom and the United States, including GDP growth, inflation, employment data, and interest rate decisions from the Bank of England (BoE) and the Federal Reserve. Additionally, political developments—such as Brexit-related news or UK general elections—can cause notable volatility in the pair. Traders monitor GBPUSD closely for insights into monetary policy shifts and broader macroeconomic trends affecting the two major economies.


    GBP/USD Market Overview
    The GBPUSD pair, representing the exchange rate between the British Pound and the US Dollar, saw renewed volatility today following a slate of key economic releases. In the UK, wage growth slowed as the Average Earnings Index came in at 5.0% vs. 5.3% expected, while the Claimant Count Change rose by 17.9K, below forecasts, and the Unemployment Rate remained steady at 4.6%. In the U.S., stronger-than-expected Core Retail Sales (0.3% vs. -0.3%) and Retail Sales (0.1% vs. -0.9%) signaled consumer resilience, while a modest rise in Import Prices and an uptick in Unemployment Claims to 233K added nuance to the outlook. The Philly Fed Manufacturing Index improved to -1.2, and housing sentiment ticked up slightly. With FOMC member Kugler set to speak, markets are closely watching for any clues on the Fed’s policy direction, keeping GBPUSD sensitive to shifts in rate expectations and economic momentum on both sides of the Atlantic.


    GBPUSD Technical Analysis
    On the daily chart of GBPUSD, the pair is testing a key horizontal support zone around 1.3390 after a sustained pullback from recent highs. Price has dipped below the Tenkan-sen line of the Ichimoku Cloud and is approaching the top of the Kumo, suggesting weakening bullish momentum. The 100-day EMA remains upward sloping and sits below at 1.3300, offering dynamic support should the current level fail to hold. Volume has increased slightly on recent red candles, hinting at growing bearish pressure. While the pair is still technically within a longer-term bullish structure, a decisive daily close below the current support zone could open the door to a deeper correction. Traders should closely watch the interplay between the Ichimoku Cloud, the EMA, and price action for confirmation of a potential trend shift.


    Final Words about GBP vs USD
    In summary, the GBPUSD pair remains a focal point for traders given its high sensitivity to economic data and monetary policy signals from both the UK and the US. Recent fundamental releases have introduced mixed sentiment, with stronger-than-expected U.S. retail figures contrasting with softer UK wage growth. Technically, the pair is at a critical juncture, hovering near a key support level that could determine its next directional move. With bearish momentum gradually building and central bank communication on the horizon, the coming sessions may prove pivotal. Traders should remain alert to both macroeconomic developments and technical signals, as GBPUSD navigates this crucial inflection point.


    07.16.2025

Page 7 of 8 FirstFirst ... 5 6 7 8 LastLast

Bookmarks

Posting Permissions

  • You may not post new threads
  • You may not post replies
  • You may not post attachments
  • You may not edit your posts
  •