Page 5 of 5 FirstFirst ... 3 4 5
Results 41 to 48 of 48
Like Tree1Likes

Daily Market Analysis and Overview by Unitedpips

This is a discussion on Daily Market Analysis and Overview by Unitedpips within the Analytics and News forums, part of the Trading Forum category; USD/CAD Daily Technical and Fundamental Analysis Introduction to USD/CAD The USD/CAD pair, also known as the "Loonie," represents the exchange ...


  1. #41
    Junior Member
    Join Date
    Oct 2024
    Posts
    48
    USD/CAD Daily Technical and Fundamental Analysis


    Introduction to USD/CAD
    The USD/CAD pair, also known as the "Loonie," represents the exchange rate between the US Dollar (USD) and the Canadian Dollar (CAD). This currency pair is highly influenced by oil prices, economic policies, and trade relationships between the United States and Canada. As one of the most liquid pairs in the forex market, USDCAD offers ample opportunities for traders, especially during high-impact economic events. Today’s trading action is closely tied to developments from the Bank of Canada (BoC) and key US economic data.


    USDCAD Market Overview
    The USD/CAD pair is in focus as traders brace for significant events influencing both currencies. The Bank of Canada is expected to announce its monetary policy decision today, with the overnight rate anticipated to remain unchanged at 3.00%. Alongside the rate decision, the BoC Monetary Policy Report and subsequent press conference will provide key insights into the central bank's outlook on inflation and economic growth. Meanwhile, the US is set to release Durable Goods Orders, Consumer Confidence data, and the Richmond Manufacturing Index. These releases could provide critical clues about the health of the US economy.
    The pair recently experienced bullish momentum, fueled by strong US economic data and weaker oil prices, which often weigh on the CAD. However, with the BoC's decision and US releases on tap, volatility is expected to remain elevated in the near term. Tomorrow's data flow and potential developments in crude oil prices will also play a significant role in determining the pair's direction.


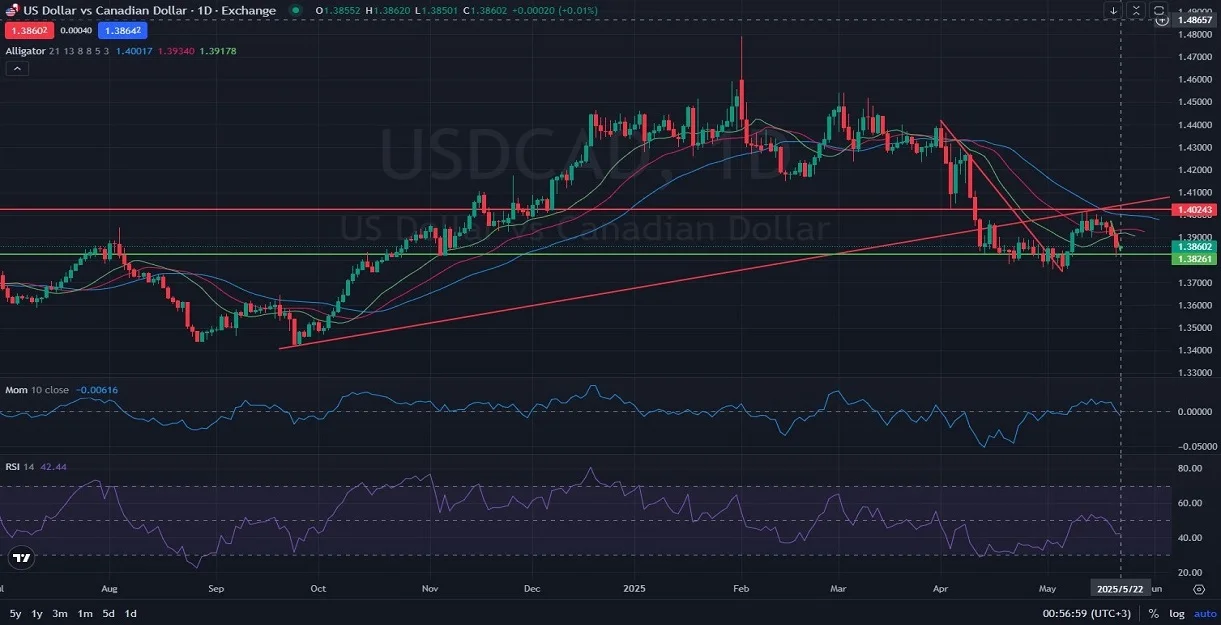
    USD CAD Technical Analysis
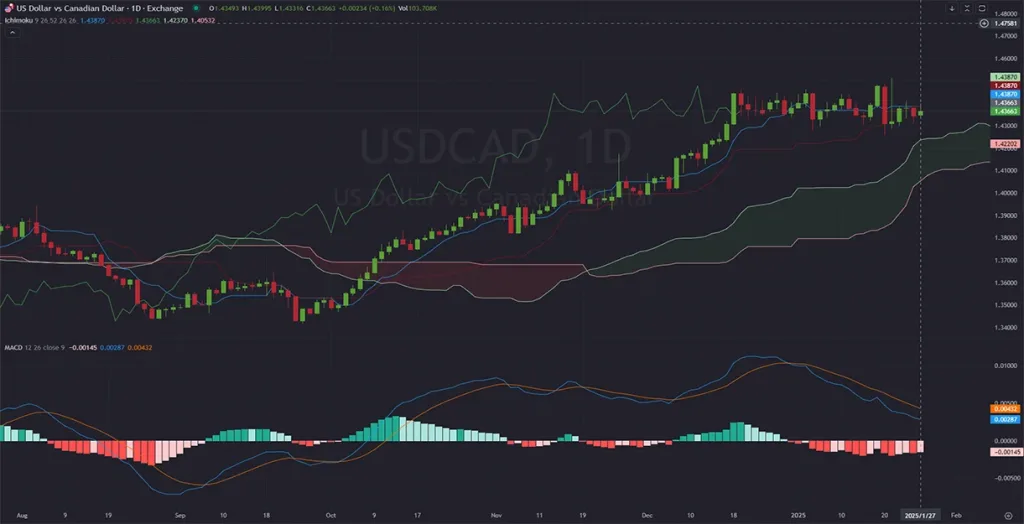
    The USD/CAD daily chart shows that the pair has been in a bullish phase but is beginning to lose strength. Price action remains above the Ichimoku cloud, signaling that the bulls are still in control, but the momentum is weakening. The MACD indicator is showing signs of a potential bearish wave, with the histogram declining and the MACD line approaching the signal line for a possible crossover. Key resistance levels are located at 1.3450, 1.3500, and 1.3550, where recent price action has stalled. On the downside, immediate support levels are seen at 1.3375, 1.3320, and 1.3280, which align with previous consolidation zones. The weakening bullish momentum, combined with bearish signals from the MACD, suggests a potential correction phase for USD/CAD. Traders should watch for a break below support levels to confirm a shift in trend.


    Final Words on USD vs CAD
    The USD/CAD pair is at a pivotal moment, with significant events on both sides of the border influencing price action. While recent bullish momentum has dominated the pair, weakening technical indicators and looming central bank decisions point to increased volatility. Traders should monitor the Bank of Canada's rate statement and press conference for guidance on CAD movement, as well as US economic releases for insight into USD strength.
    Although the pair remains above key support levels, the potential for a bearish correction is growing, especially if the BoC takes a more hawkish tone or if US data disappoints. Risk management is crucial, as USD CAD is likely to experience sharp moves during these high-impact events. Keeping an eye on oil prices, which are closely correlated with the CAD, will also provide additional context for trading decisions.


    01.28.2025

  2. #42
    Junior Member
    Join Date
    Oct 2024
    Posts
    48
    XRP/USD Daily Analysis: Ripple Faces Bearish Pressure Amid US Economic Data


    Introduction to XRP/USD
    The XRP-USD pair, commonly referred to as "Ripple vs US Dollar," is a critical cryptocurrency trading pair illustrating Ripple's XRP token's value relative to the US dollar. XRP, known for its swift and cost-efficient international payments, is popular among traders for its volatility and potential profits. Monitoring XRPUSD daily trends helps investors gauge market sentiment and potential trading opportunities.


    XRPUSD Market Overview
    XRP-USD is currently experiencing bearish pressure, primarily driven by recent US economic news and announcements. The US dollar has strengthened due to President Trump's unexpected press conference regarding auto tariffs, prompting market volatility and shifting sentiment toward traditional safe-haven assets. Additionally, GDP and unemployment claims data released by the Bureau of Economic Analysis and Department of Labor respectively have reinforced the dollar's stability, further pressuring XRP. Upcoming releases, including trade balance and housing market indicators, are likely to influence the pair's near-term volatility. Traders should closely monitor President Trump's forthcoming statements and the next set of economic indicators for guidance.

    XRP-USD Technical Analysis
    On the daily timeframe, XRPUSD shows clear signs of a potential downtrend, supported by recent price action breaking critical trend support levels. The formation of lower highs against a descending resistance trendline suggests bearish momentum building in the market. Recent candles, including a bearish pin bar followed by a gap-down red candle, further reinforce the downward bias, with the lower band of the current trading channel acting as a potential price target. The Relative Strength Index (RSI) at 47.46 indicates neutral momentum, but leaning bearish as it dips below the midpoint level. Meanwhile, the Awesome Oscillator (AO) is slightly positive but diminishing, hinting at weakening bullish momentum.


    Final Words on XRP vs USD
    Given the current technical and fundamental landscape, XRP/USD appears primed for a potential continuation of the bearish movement. Traders should remain cautious, watching for price reactions at key support and resistance levels, particularly around the lower boundary of the existing channel. Upcoming US economic announcements will be critical in influencing market direction, possibly intensifying the bearish trend if positive economic data further strengthens the USD. Maintaining disciplined risk management strategies is crucial due to XRP's inherent volatility.


    03.27.2025

  3. #43
    Junior Member
    Join Date
    Oct 2024
    Posts
    48
    Daily Technical Outlook for USD/CHF Pair


    Introduction to USD/CHF
    The USD/CHF currency pair, often referred to by traders as the “Swissie,” represents the exchange rate between the US Dollar and the Swiss Franc. It is one of the most liquid and stable forex pairs, heavily influenced by geopolitical risk sentiment and economic differentials between the US and Switzerland. The pair is popular among traders seeking safe-haven hedges, especially during uncertain global conditions. Due to Switzerland’s strong banking sector and the USD’s reserve currency status, USD/CHF remains a vital barometer of global risk appetite.


    USD-CHF Market Overview
    The USD/CHF pair continues to hover near key support levels amid mixed economic signals from both economies. On April 2nd, the US economy showed a stronger-than-expected ADP Non-Farm Employment Change figure at 118K (vs. 77K forecast), suggesting resilience in the labor market. However, Factory Orders declined to 0.5% from the previous 1.7%, and Crude Oil Inventories fell less than expected at -0.4M (vs. -3.3M), signaling weakening demand. Market attention later shifted to speeches from President Trump and FOMC member Kugler, which may further influence USD volatility. On April 3rd, Swiss CPI data came in at 0.1%, missing the 0.6% forecast, indicating weaker inflationary pressure. Traders will closely watch remarks from SNB Board Member Tschudin for policy clues, which could directly affect CHF sentiment.

    USD/CHF Technical Analysis
    On the daily (D1) timeframe, USD/CHF appears to be in a crucial correction phase. Price action has consolidated around a strong static support zone near 0.8800, a level previously tested in late 2024. The Relative Strength Index (RSI) is showing early signs of a bullish reversal, currently reading 45.25, with a clear positive divergence forming. Ichimoku Cloud analysis reveals that price is trading below the cloud, suggesting continued bearish pressure, but with the cloud acting as dynamic resistance. If USD/CHF can decisively break above the 0.8845–0.8890 zone and the Kumo cloud, it may signal a trend reversal and trigger bullish momentum toward the psychological 0.9000 handle.


    Final Words about USD vs CHF
    On the daily (D1) timeframe, USD/CHF appears to be in a crucial correction phase. Price action has consolidated around a strong static support zone near 0.8800, a level previously tested in late 2024. The Relative Strength Index (RSI) is showing early signs of a bullish reversal, currently reading 45.25, with a clear positive divergence forming. Ichimoku Cloud analysis reveals that price is trading below the cloud, suggesting continued bearish pressure, but with the cloud acting as dynamic resistance. If USD/CHF can decisively break above the 0.8845–0.8890 zone and the Kumo cloud, it may signal a trend reversal and trigger bullish momentum toward the psychological 0.9000 handle.


    04.02.2025

  4. #44
    Junior Member
    Join Date
    Oct 2024
    Posts
    48
    AUD/USD Poised for a Potential Short-Term Bounce


    Introduction to AUD/USD
    AUD/USD, commonly referred to as the “Aussie,” represents how many US dollars one Australian dollar can buy. This currency pair is popular among traders because it often reacts strongly to both US and Australian economic news. Its volatility can offer significant trading opportunities, especially around major releases such as interest rate decisions and employment data.


    AUDUSD Market Overview
    Over the past couple of days, AUD USD has shown substantial volatility, partly in response to multiple high-impact releases from the US Bureau of Labor Statistics and the Federal Reserve. Inflation data (both core and general CPI) remain key focal points, with the next release scheduled for May 13, 2025, potentially influencing the US dollar’s strength. Meanwhile, upcoming comments from several Federal Reserve officials are keeping traders on edge, as each speech may hint at future monetary policy shifts. On the Australian side, the Melbourne Institute’s consumer inflation expectations and an upcoming speech by RBA Governor Michele Bullock are drawing attention to inflation outlooks and interest rate decisions. These combined factors have left the Aussie under pressure, but with occasional rebounds fueled by market optimism and repositioning.

    AUD-USD Technical Analysis
    On the daily (D1) chart, the Alligator indicator shows the blue jaw at the top, followed by the red teeth and green lips—signifying that the broader trend has been bearish. However, the latest bullish candlestick indicates a corrective bounce, partially retracing recent losses. The Williams %R has edged upward from oversold territory, suggesting a short-term rebound may continue. The MACD histogram is still negative but appears to be losing downward momentum, hinting that a bullish crossover could develop if buying pressure persists. Key resistance levels to watch lie around 0.6200, while immediate support is near the recent swing low around 0.5900.


    Final Words about AUD vs USD
    Given the current technical backdrop, a near-term rebound for AUD vs USD seems possible, especially if the market perceives any upcoming US data or Fed official remarks as less hawkish. Nonetheless, traders should remain cautious, as any stronger-than-expected US inflation data could reignite dollar strength and pressure the Aussie further. On the Australian side, a hawkish tone from RBA Governor Michele Bullock might bolster the AUD, offsetting some downward risks. Keeping track of both nations’ economic calendars remains essential for timely decision-making. Overall, the pair retains a slightly bearish tilt, but short-term recoveries cannot be ruled out.


    04.10.2025

  5. #45
    Junior Member
    Join Date
    Oct 2024
    Posts
    48
    Understanding ETHUSD Daily Price Action


    Introduction to ETH/USD
    ETH-USD, commonly known as Ethereum versus the US Dollar, represents the trading pair of Ethereum, one of the largest and most influential cryptocurrencies, against the globally dominant fiat currency, the US dollar. Traders and investors frequently monitor ETH/USD to gauge market sentiment toward Ethereum and broader cryptocurrency trends. Known for its volatility and active market movements, this pairing provides crucial insights for making informed trading decisions.


    ETHUSD Market Overview
    Currently, ETH/USD is experiencing a notable shift in market sentiment, transitioning from a bearish to a bullish outlook in the short term. This change has been primarily influenced by recent U.S. economic data and broader cryptocurrency market optimism. Upcoming releases such as the U.S. Goods Trade Balance, Wholesale Inventories, and the Housing Price Index will likely impact the strength of the US dollar, subsequently influencing ETH/USD. Recent improvements in housing market indicators and stable job market data in the US hint towards economic stability, potentially bolstering the USD and introducing volatility in the ETH/USD pair. Traders should closely monitor these economic indicators, especially the Job Openings and Labor Turnover Survey (JOLTS), as stronger-than-expected results can enhance USD strength, pressuring ETH in the short run.


    ETH-USD Technical Analysis
    Analyzing the daily chart, ETH/USD has recently broken a significant downward trendline, indicating a potential shift towards an upward trajectory. The pair successfully breached the middle Bollinger Band, which signals bullish momentum, with the upper Bollinger Band serving as the immediate target around the price range of $1,900. A subsequent target could be the critical resistance level at approximately $2,336.90. The Awesome Oscillator shows a diminishing bearish momentum and is trending towards neutral, suggesting a potential bullish crossover soon. Concurrently, the Stochastic oscillator indicates an overbought condition; however, maintaining these high levels may imply continued buying pressure and strength in the bullish trend for ETH/USD.


    Final Words about ETH vs USD
    Given the current technical breakout and supportive economic context, ETH/USD demonstrates promising short-term bullish potential. Traders should cautiously monitor the resistance levels at $1,900 and $2,336.90 for possible pullbacks or continuations of bullish strength. Moreover, upcoming US economic releases may induce significant market volatility, influencing price movements substantially. Investors must employ disciplined risk management practices due to the inherent volatility in cryptocurrency markets. Staying updated on both technical developments and economic data releases will be critical in navigating the ETH/USD market dynamics effectively.


    04.29.2025

  6. #46
    Junior Member
    Join Date
    Oct 2024
    Posts
    48
    EUR/USD Daily Analysis: Technical Indicators Signal Potential Correction


    Introduction to EUR-USD
    EURUSD, commonly known among traders as "Fiber," is one of the most actively traded currency pairs globally. It represents the exchange rate between the Euro (EUR) and the U.S. Dollar (USD), providing insights into the economic health of both Europe and the United States. Traders closely watch this pair due to its liquidity and responsiveness to global economic events.


    EURUSD Market Overview
    The EUR-USD is currently experiencing volatility amid mixed economic signals from both Europe and the U.S. Recent data from the French Treasury Agency indicated a potentially positive budget outcome, suggesting fiscal strength in the Eurozone. Additionally, manufacturing PMI reports from S&P Global showed indications of industry conditions, influencing trader sentiment positively or negatively based on the actual outcomes versus forecasts. Upcoming Eurostat releases, including CPI and unemployment data, will likely shape the near-term outlook by clarifying the economic trajectory of the Eurozone. Meanwhile, in the U.S., recent employment data from the Bureau of Labor Statistics suggests robust job growth and labor market resilience, potentially strengthening the USD. Traders should remain attentive to the upcoming U.S. Non-Farm Payroll (NFP) report and manufacturing orders data, as these could further influence the EUR/USD direction in the coming days.


    EUR/USD Technical Analysis
    On the daily timeframe, EUR USD is trading within an ascending trend channel, currently testing crucial support at the lower boundary of the Alligator indicator. The ongoing price correction appears supported by the Alligator's jaw line, potentially indicating a temporary pullback before resuming its upward trend. Traders should watch for support near the current channel line around 1.1174, coinciding with the Alligator indicator's support zone. Resistance remains at previous highs around 1.1555, providing potential target areas for bullish price action once the correction is complete. The Fisher oscillator suggests potential downward momentum in the short term, aligning with signals from the Awesome Oscillator, which also indicates weakening bullish momentum.


    Final Words about EUR vs USD
    Given current technical and fundamental indicators, EUR/USD may experience further short-term corrective movement, testing key support levels before potentially resuming its upward trajectory. Traders should closely monitor support around 1.1174 and resistance at 1.1555 to determine market entry or exit points. Economic releases from both the Eurozone and the U.S. will be critical in influencing market sentiment and future price action. Maintaining vigilant risk management strategies remains essential due to ongoing economic uncertainty and potential volatility within the EUR/USD market.


    05.02.2025

  7. #47
    Junior Member
    Join Date
    Oct 2024
    Posts
    48
    NZD/USD Daily Analysis: Bulls Attempt to Retake Control


    Introduction to NZD/USD
    The NZD USD, commonly known as the "Kiwi," represents the exchange rate between the New Zealand Dollar and the US Dollar. Traders closely monitor this currency pair due to New Zealand's significant commodity exports and the USD's role as the global reserve currency. Movements in NZD/USD provide critical insights into market sentiment regarding risk appetite, commodity price trends, and economic outlooks.


    NZDUSD Market Overview
    Currently, the NZD/USD shows a bullish sentiment driven by recent favorable economic data from New Zealand. Commodity prices released by ANZ showed a positive trend, providing strength to the New Zealand Dollar. Additionally, the latest GlobalDairyTrade (GDT) auction reported an improvement in dairy prices, further supporting NZD demand. On the USD side, markets are carefully watching the US trade balance report from the Bureau of Economic Analysis and consumer sentiment data from RealClearMarkets, both expected to influence USD strength and market dynamics significantly. Investors are also cautiously observing upcoming Treasury auctions and API inventory reports, influencing the USD outlook for the near term.


    NZD-USD Technical Analysis
    Technical indicators on the daily NZD USD chart suggest cautious optimism. Currently, the price is supported by the middle Bollinger Band, indicating potential upward momentum. However, the Kiwi remains vulnerable to declines should this dynamic support fail. A breach below the Bollinger Band's midline could initially target the former resistance, now turned support, at 0.58750, and further downside could extend to 0.57929. Bollinger Bands are widening, hinting at increasing market volatility. The Awesome Oscillator signals modest bullish momentum, while the Fisher indicator confirms potential bullish continuation if current levels hold.


    Final Words about NZD vs USD
    Considering both technical indicators and recent economic news, NZD/USD appears poised for a cautious upward move, albeit with notable risks. Traders should closely monitor price behavior around critical support levels, especially at the Bollinger Band midline. Upcoming economic releases from the US and commodity data from New Zealand will likely dictate the short-term direction. Risk management remains crucial due to the potential for heightened volatility, emphasizing the need for vigilance in response to shifting market conditions.


    05.06.2025

  8. #48
    Junior Member
    Join Date
    Oct 2024
    Posts
    48
    EUR/USD Technicals Show Uptrend With Possible Pullback


    Introduction to EUR/USD
    The EUR/USD currency pair, often referred to as “Fiber,” is the most traded forex pair in the world, representing the exchange rate between the Euro and the United States Dollar. As a major pair, it reflects the economic relationship between the Eurozone and the United States and is heavily influenced by macroeconomic data, geopolitical events, and central bank decisions. Traders closely monitor this pair due to its liquidity and strong correlation with broader market trends. Understanding EUR-USD price movement is essential for informed forex trading decisions.


    EURUSD Market Overview
    The EURUSD pair has shown mixed performance in recent sessions as investors digest fresh economic data from both the Eurozone and the U.S. On the U.S. side, jobless claims rose modestly, indicating slight weakness in the labor market, while productivity and labor cost reports pointed to rising inflationary pressure, potentially supporting a hawkish Fed stance. Meanwhile, from Europe, stronger-than-expected industrial production and a positive trade balance are providing some support for the Euro. However, market liquidity may remain thinner due to the Victory Day bank holiday in France, potentially causing choppy price action. With key data from the U.S. scheduled in the coming days, particularly around inflation and employment, traders are positioning themselves cautiously on the EUR USD front.


    EUR/USD Technical Analysis
    On the daily timeframe, the EUR/USD pair is currently exhibiting a bullish structure, with price action consolidating between the 0.786 (around 1.1248) and 1.0 Fibonacci levels. This zone is acting as both a support and resistance range in the near term. The Alligator indicator lines show a typical bullish alignment: the green lips are above the red teeth, and the red teeth are above the blue jaw, confirming the uptrend. Price candles are still moving along the green Alligator lips, suggesting continued upward momentum, although the last few daily candles have been bearish, indicating a possible pullback or short-term correction. The Aroon indicator shows weakening bullish strength (upper Aroon at 14.29%, lower Aroon at 71.43%), while the Fisher Transform remains in bearish territory, pointing to potential exhaustion of the upward move unless bulls regain control soon.


    Final Words About EUR vs USD
    The current EUR/USD technical and fundamental setup suggests a market in consolidation within an overall bullish trend. Despite recent bearish candles and a slight weakening in momentum indicators, the pair remains supported above key Fibonacci and Alligator levels. Eurozone economic data is showing signs of resilience, while the U.S. faces mixed labor and inflation signals, making the next set of U.S. data crucial for directional confirmation. Traders should monitor price action around the 1.1248 and 1.1309 levels for potential breakouts or pullbacks. Cautious optimism may dominate trading strategies, with attention to key economic events scheduled for next week.


    05.08.2025

Page 5 of 5 FirstFirst ... 3 4 5

Bookmarks

Posting Permissions

  • You may not post new threads
  • You may not post replies
  • You may not post attachments
  • You may not edit your posts
  •