
 2Likes
 LinkBack URL
 About LinkBacks


EUR/GBP H4 Technical and Fundamental Analysis for 07.04.2025
Time Zone: GMT +3
Time Frame: 4 Hours (H4)
Fundamental Analysis:
The EUR/GBP currency pair represents the exchange rate between the Euro and the British Pound. The pair is influenced by economic data and policy decisions from both the Eurozone and the United Kingdom. Today's market activity is expected to be impacted by the release of significant data. For the GBP, the focus will be on the Purchasing Managers' Index (PMI) for the construction sector, as well as updates from the Bank of England regarding economic conditions and monetary policy. Stronger-than-expected data would likely support the British Pound. On the Eurozone side, industrial orders, production data, and retail sales will provide insight into the economic strength of the region. With both currencies seeing key updates, EURGBP could experience volatility depending on the direction these data points take.
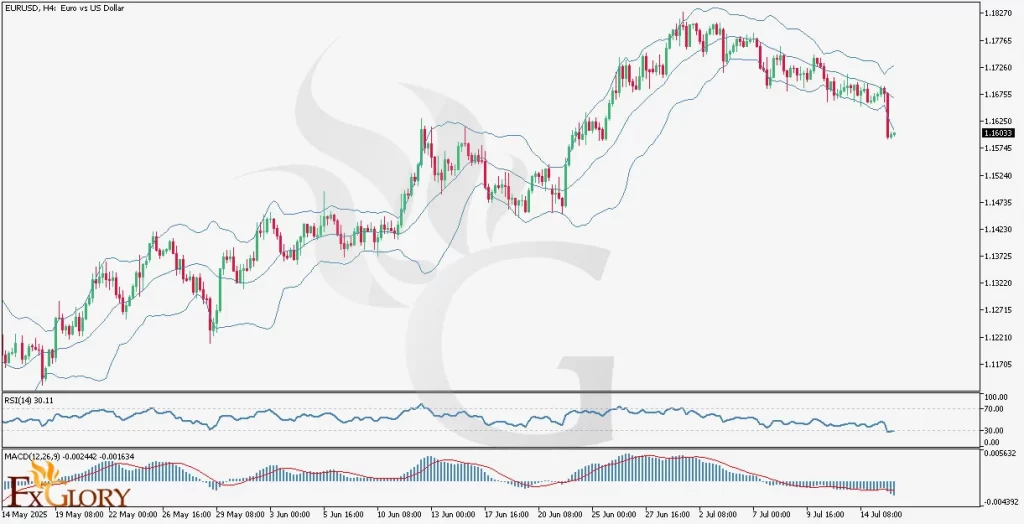
Price Action:
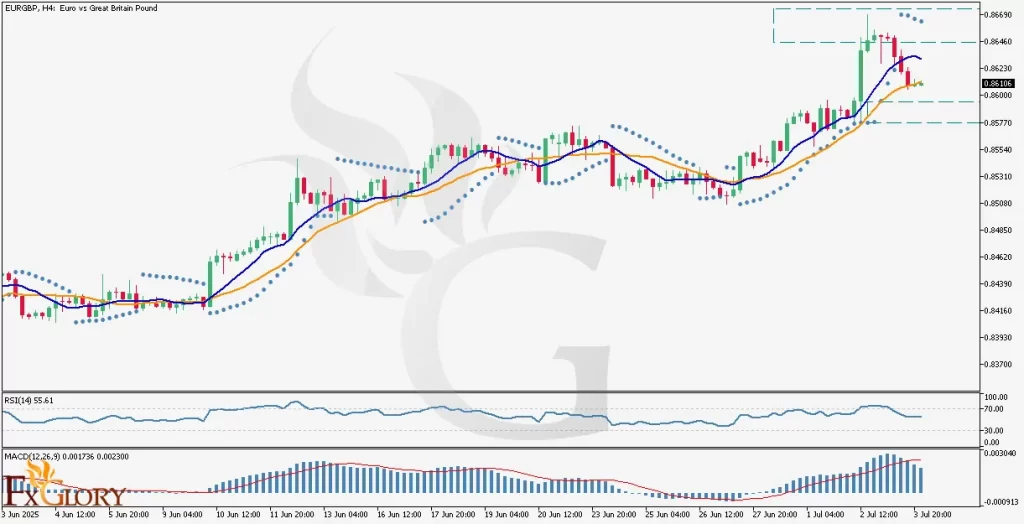
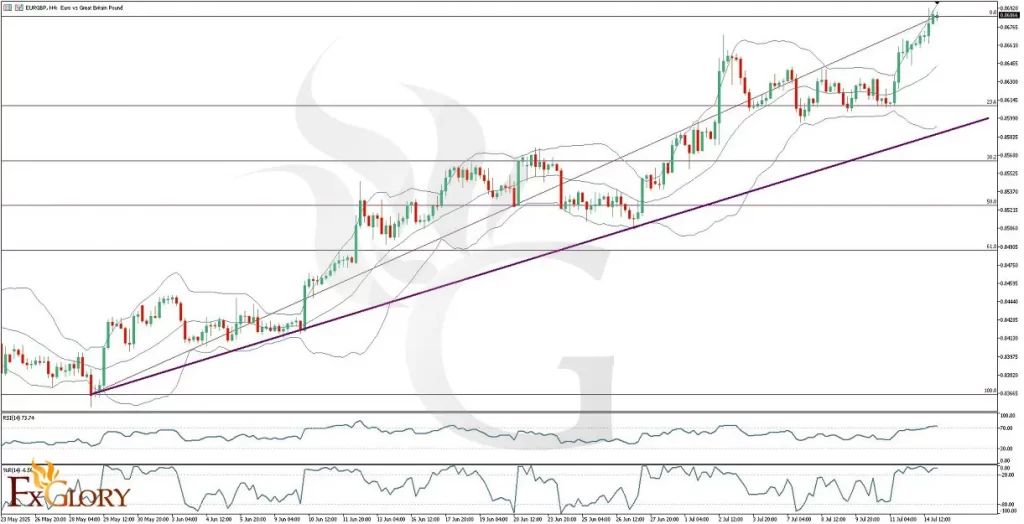
The EUR/GBP chart on the H4 timeframe indicates that the price has been on a bullish trend recently, but it is now facing resistance at higher levels, as indicated in the chart. After the bullish movement, the price has encountered a resistance zone, which has prevented it from moving further upward. The last four Parabolic SAR dots have appeared above the candles, signaling a potential change in trend or consolidation. The short-term moving average (blue line) has crossed above the long-term moving average (orange line), but it seems to be turning downward towards the orange line, which might indicate weakening momentum. Despite this, the last two candles are green and positive, suggesting a possible continuation of upward momentum if the price can hold above key levels.
Key Technical Indicators:
Parabolic SAR (Stop and Reverse): The Parabolic SAR dots have shifted above the price candles, which typically signals a potential reversal or a pause in the current trend. This indicator suggests caution, as the bullish momentum may be weakening, and a shift to a consolidation phase or a bearish trend could be approaching.
Moving Averages (MA): The short-term moving average (blue) has crossed above the long-term moving average (orange), indicating a bullish trend. However, the short-term MA appears to be moving downward towards the long-term MA, suggesting that upward momentum may be slowing. The positioning of these two MAs and the fact that the candles are now below the blue line points to a potential pause or correction in the trend.
RSI (Relative Strength Index): The RSI is currently at 55.61, indicating that the market is neither overbought nor oversold. This neutral position suggests that there is still room for the price to move in either direction, and the market is not showing signs of an immediate reversal or exhaustion.
MACD (Moving Average Convergence Divergence): The MACD line is above the signal line, and the histogram is positive, showing that there is still some bullish momentum. However, the MACD histogram is starting to lose momentum, which could signal a slowdown in the current bullish trend. Traders should monitor the MACD for any potential bearish crossovers in the near future.
Support and Resistance:
Support: The support level is around 0.8580, as indicated by the price action on the chart. If the price drops to this level, it could find support and potentially bounce higher.
Resistance: The resistance level is near 0.8650, which has been an area where the price has faced difficulty breaking above. A failure to breach this resistance could lead to a pullback or consolidation.
Conclusion and Consideration:
The EUR/GBP chart shows a bullish trend, but recent price action suggests that the pair may be struggling to break through key resistance levels. While the Parabolic SAR and moving averages indicate a potential slowdown in the bullish momentum, the green candles suggest that there is still a chance for further upward movement if key support levels hold. However, traders should be cautious due to the weakening momentum in the MACD and the possible resistance at higher levels. With the upcoming news releases from both the UK and the Eurozone, volatility may increase, and its crucial to watch the data for any surprises that could shift market sentiment.
Disclaimer: The analysis provided for EUR/GBP is for informational purposes only and does not constitute investment advice. Traders are encouraged to perform their own analysis and research before making any trading decisions on EURGBP. Market conditions can change quickly, so staying informed with the latest data is essential.
FXGlory
07.04.2025


 Reply With Quote


Bookmarks