Page 26 of 26 FirstFirst ... 16 24 25 26
Results 251 to 254 of 254
Like Tree2Likes

Daily Forex Analysis By FXGlory

This is a discussion on Daily Forex Analysis By FXGlory within the Analytics and News forums, part of the Trading Forum category; USD/JPY Daily Technical and Fundamental Analysis for 05.27.2025 Time Zone: GMT +3 Time Frame: 4 Hours (H4) Fundamental Analysis: Today's ...


  1. #251
    Senior Member FXGlory Ltd's Avatar
    Join Date
    Mar 2024
    Posts
    255

    Visit FXGlory Ltd's Youtube Channel
    USD/JPY Daily Technical and Fundamental Analysis for 05.27.2025


    Time Zone: GMT +3
    Time Frame: 4 Hours (H4)


    Fundamental Analysis:
    Today's fundamental landscape is marked by crucial events impacting both the USD and JPY. On the JPY front, traders are closely monitoring the Services Producer Price Index (SPPI) and the speech by BOJ Governor Kazuo Ueda. Any unexpected hawkishness in Governor Ueda's remarks could strengthen the Yen significantly. For USD, attention centers around Minneapolis Fed President Neel Kashkari's participation in a monetary policy panel and the latest figures on Durable Goods Orders. Hawkish signals or positive economic data from the U.S. are likely to support the Dollar.


    Price Action:
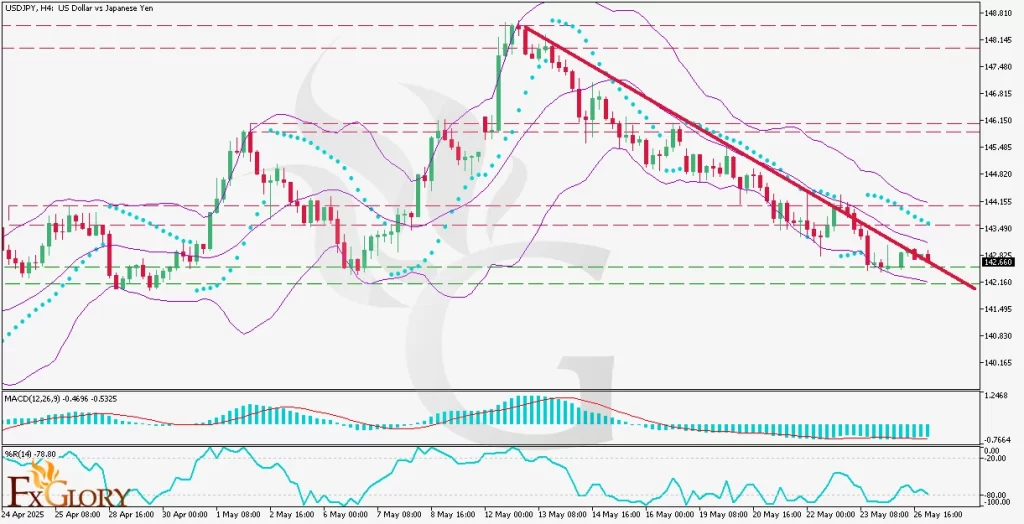
    The USD-JPY pair on the H4 timeframe currently demonstrates a critical retest of the prevailing downtrend line, following a successful bounce from a clear support zone. The current price action suggests a pivotal moment; if the price convincingly breaks the downtrend line, subsequent bullish momentum could drive the price toward previously identified resistance zones marked clearly in red above the current level.


    Key Technical Indicators:
    Parabolic SAR: The indicator currently signals a bearish market sentiment, positioned above the recent candles. However, the approaching retest and potential breakout could signal a reversal of sentiment if the Parabolic SAR dots shift beneath the price candles.
    Bollinger Bands: Bollinger Bands are moderately expanded, indicating sustained volatility. The price is interacting closely with the lower band, which may signal potential oversold conditions and an impending bullish reversal if the trend line is successfully breached.
    MACD: The MACD histogram shows consistent negative bars, signaling ongoing bearish momentum. However, the narrowing bars indicate declining selling pressure, suggesting potential weakening bearish sentiment and an upcoming momentum shift toward bullish territory upon a successful breakout.
    %R (Williams Percent Range): The %R indicator is deeply oversold at approximately -78.80. This significantly oversold condition suggests a potential bullish correction or reversal, especially if the price breaks the descending trend line resistance.


    Support and Resistance:
    Support: Immediate and significant support is clearly established at approximately 142.160. A break below this could see further bearish momentum.
    Resistance: Immediate resistance is situated at approximately 143.155, with subsequent higher resistances at approximately 144.820 and 146.150.


    Conclusion and Consideration:
    The USDJPY H4 technical and fundamental analysis suggests cautious optimism for potential bullish developments, contingent on breaking the prevailing downtrend line. Traders must closely monitor today's economic releases and central bank speeches as they hold significant potential to drive volatility. Due to critical technical points and fundamental events today, risk management should be diligently applied to navigate potential sharp market movements.


    Disclaimer: The analysis provided for USD /JPY is for informational purposes only and does not constitute investment advice. Traders are encouraged to perform their own analysis and research before making any trading decisions on USDJPY. Market conditions can change quickly, so staying informed with the latest data is essential.


    FXGlory
    05.27.2025

  2. #252
    Senior Member FXGlory Ltd's Avatar
    Join Date
    Mar 2024
    Posts
    255

    Visit FXGlory Ltd's Youtube Channel
    AUD/USD Daily Technical and Fundamental Analysis for 05.28.2025


    Time Zone: GMT +3
    Time Frame: 4 Hours (H4)


    Fundamental Analysis:
    Today's fundamental landscape is shaped by key economic releases and central bank developments influencing both the AUD and USD. For the Australian Dollar, focus is on the year-over-year Consumer Price Index (CPI), which came in at 2.3%, slightly below the forecast of 2.4%, potentially softening inflation expectations and reducing pressure on the RBA to tighten policy further. Construction Work Done matched expectations at 0.5% q/q, offering little surprise to the market. On the USD side, traders are eyeing several important events, including the Richmond Manufacturing Index, which printed at -9 versus the prior -13, indicating slight improvement but still signaling contraction. The release of the FOMC Meeting Minutes later in the day will be closely scrutinized for any hawkish tilt, while the API Weekly Statistical Bulletin could impact market sentiment, especially in energy-related sectors. Stronger-than-expected signals from the Fed could provide support for the U.S. Dollar.


    Price Action:
    The AUD-USD pair on the H4 timeframe is currently consolidating within a rising channel, bounded by clearly defined red trendlines. Price action shows a recent rejection near the upper boundary, followed by a retreat toward the midline of the Ichimoku cloud, which is now acting as potential dynamic support. The RSI is hovering around 42.80, indicating mild bearish momentum but not yet oversold. Notably, the price remains above the long-term ascending trendline, suggesting the broader bullish structure is intact. A decisive move below the Ichimoku cloud and channel support could signal a bearish reversal, while a bounce from this level may open the path for another test of the upper resistance line.


    Key Technical Indicators:
    Ichimoku Cloud: Price is testing the top of the cloud after falling below the Tenkan-sen and Kijun-sen, signaling short-term bearish pressure. A break below the cloud could confirm a bearish shift, while a bounce may revive bullish momentum.
    RSI: RSI sits at 42.80, showing mild bearish momentum but not oversold. A rebound from this level could hint at a potential bullish reversal if supported by price action


    Support and Resistance:
    Support: The first key support is located at approximately 0.64080, near the ascending channel's lower boundary. A deeper support level lies around 0.63650, which has previously acted as a price floor.
    Resistance: Immediate resistance is seen at approximately 0.64950, near recent highs. A higher resistance level is positioned around 0.65400, marking the upper boundary of the rising channel.


    Conclusion and Consideration:
    The AUD-USD pair remains at a critical juncture, with price action consolidating within a rising channel and key support levels being tested. While fundamentals suggest mixed sentiment—soft Australian inflation data versus potentially hawkish U.S. signals—the technical outlook remains cautiously bullish as long as the price holds above 0.64080. Traders should closely monitor the reaction to upcoming U.S. events and watch for a decisive move either below the Ichimoku cloud for a bearish confirmation or a rebound toward resistance levels for a continuation of the upward trend.


    Disclaimer: The analysis provided for AUD /USD is for informational purposes only and does not constitute investment advice. Traders are encouraged to perform their own analysis and research before making any trading decisions on AUDUSD. Market conditions can change quickly, so staying informed with the latest data is essential.


    FXGlory
    05.28.2025

  3. #253
    Senior Member FXGlory Ltd's Avatar
    Join Date
    Mar 2024
    Posts
    255

    Visit FXGlory Ltd's Youtube Channel
    GBPUSD Daily Technical and Fundamental Analysis for 05.29.2025


    Time Zone: GMT +3
    Time Frame: 4 Hours (H4)


    Fundamental Analysis:
    Today's GBPUSD pair is expected to see heightened volatility due to key events in both the UK and US. GBP is likely to react significantly to speeches by BOE Governor Andrew Bailey and BOE Deputy Governor Sarah Breeden, who may offer clues about future interest rate decisions. Meanwhile, the USD faces multiple key economic releases, including GDP data, initial jobless claims, and speeches by Federal Reserve members Austan Goolsbee and Adriana Kugler, which could heavily influence USD valuation through shifts in monetary policy expectations and economic outlook.


    Price Action:
    On the GBPUSD H4 chart, the pair maintains a bullish long-term trend but has recently retraced after touching the upper Bollinger Band, now approaching the lower band. Current candlestick formations suggest short-term bearish momentum, reinforced by the Parabolic SAR dots positioned above the candles, indicating selling pressure. Traders should watch closely for potential reversals near key support levels.


    Key Technical Indicators:
    Bollinger Bands:
    GBP/USD recently touched the upper band and has swiftly reversed to test the lower band, signaling possible short-term bearish consolidation. Traders might anticipate volatility and potential rebounds from the lower Bollinger Band.
    Parabolic SAR: The Parabolic SAR dots are currently placed above the candles, clearly signaling a bearish sentiment in the short term. Traders should consider this indication for potential continuation of downward momentum until a reversal occurs.
    MACD (Moving Average Convergence Divergence): The MACD histogram is declining, indicating waning bullish momentum and a potential bearish crossover. This suggests that the selling pressure may increase in the near term, prompting traders to prepare for potential downward moves.
    Williams %R: Currently at -87.17, Williams %R indicates an oversold condition. This oversold level typically hints at a potential upcoming reversal or at least a temporary bullish correction, advising caution for short traders.


    Support and Resistance:
    Support:
    Immediate support for GBP USD is located around the 1.3430 area, coinciding with the lower Bollinger Band and ascending trendline.
    Resistance: The nearest resistance is observed at approximately 1.3485, aligning with recent price highs and the previous breakout level.


    Conclusion and Consideration:
    Technical indicators on the GBP-USD H4 chart currently reflect short-term bearish sentiment within a broader bullish trend. The market's response to today's key economic announcements and central bank speeches will be critical in determining the pair's next directional move. Traders should exercise caution due to expected volatility around the announcements.


    Disclaimer: The analysis provided for GBP/USD is for informational purposes only and does not constitute investment advice. Traders are encouraged to perform their own analysis and research before making any trading decisions on GBPUSD. Market conditions can change quickly, so staying informed with the latest data is essential.


    FXGlory
    05.29.2025

  4. #254
    Senior Member FXGlory Ltd's Avatar
    Join Date
    Mar 2024
    Posts
    255

    Visit FXGlory Ltd's Youtube Channel
    EUR/USD Daily Technical and Fundamental Analysis for 05.30.2025


    Time Zone: GMT +3
    Time Frame: 4 Hours (H4)


    Fundamental Analysis:
    The EURUSD currency pair reflects market dynamics between the Euro (EUR) and the US Dollar (USD). Today, notable volatility is expected due to key economic data and speeches impacting both currencies. For the USD, significant events include speeches from FOMC members Mary Daly, Lorie Logan, and Raphael Bostic, along with critical economic releases like Core PCE Price Index, Personal Income, and the University of Michigan Consumer Sentiment report. For EUR, traders will closely monitor German and Eurozone CPI data and Retail Sales reports, which are essential indicators influencing monetary policy and inflation expectations.


    Price Action:
    EUR-USD price action analysis on the H4 timeframe shows bullish momentum. Recently, the EURUSD broke and successfully retested a crucial resistance level, now acting as support, signaling bullish continuation potential. Currently, the price is heading towards the next resistance level at 1.14052. If this resistance is breached convincingly, the price action may target the upper resistance trend line, enhancing bullish sentiment further.


    Key Technical Indicators:
    Bollinger Bands:
    Bollinger Bands show expanding volatility with the price currently trading near the upper band, indicating strong bullish momentum. Continued trading near the upper band suggests potential upward continuation but also calls for vigilance for potential short-term corrections.
    Parabolic SAR: The Parabolic SAR indicator is below the price bars, confirming the bullish trend. It indicates continued bullish sentiment until the dots reverse position above the price.
    RSI (Relative Strength Index): The RSI indicator is at 58.22, suggesting moderate bullish momentum without being in the overbought territory. There is room for further upside movement, supporting a potential rise toward resistance.
    MACD (Moving Average Convergence Divergence): MACD histogram is positive and recently crossed above the signal line, confirming bullish momentum. This indicator suggests increased buying pressure, reinforcing bullish sentiment in the short term.
    Awesome Oscillator: The Awesome Oscillator has recently shifted to a small positive value, highlighting a bullish reversal from previous bearish momentum. The oscillator supports current bullish price action, though continued monitoring is essential for confirmation.


    Support and Resistance:
    Support:
    Immediate support is located at 1.11849, which aligns with the recently retested significant support.
    Resistance: The nearest resistance level is at 1.14052, which coincides with key horizontal resistance and recent price action highs.


    Conclusion and Consideration:
    The EURUSD H4 analysis indicates a bullish bias supported by technical indicators and confirmed by recent price action. Traders should monitor closely upcoming US and EU economic data and speeches, which could significantly affect volatility and the EURUSD pair’s trajectory. A break above 1.14052 may trigger further bullish momentum, aiming towards the upper resistance trend line. Traders should manage risk carefully due to potential volatility from today's news events.


    Disclaimer: The analysis provided for EUR/USD is for informational purposes only and does not constitute investment advice. Traders are encouraged to perform their own analysis and research before making any trading decisions on EURUSD. Market conditions can change quickly, so staying informed with the latest data is essential.


    FXGlory
    05.30.2025

Page 26 of 26 FirstFirst ... 16 24 25 26

Bookmarks

Posting Permissions

  • You may not post new threads
  • You may not post replies
  • You may not post attachments
  • You may not edit your posts
  •