Page 25 of 25 FirstFirst ... 15 23 24 25
Results 241 to 246 of 246
Like Tree1Likes

Daily Forex Analysis By FXGlory

This is a discussion on Daily Forex Analysis By FXGlory within the Analytics and News forums, part of the Trading Forum category; GBP/USD H4 Technical and Fundamental Analysis for 05.08.2025 Time Zone: GMT +3 Time Frame: 4 Hours (H4) Fundamental Analysis: The ...


  1. #241
    Senior Member FXGlory Ltd's Avatar
    Join Date
    Mar 2024
    Posts
    247

    Visit FXGlory Ltd's Youtube Channel
    GBP/USD H4 Technical and Fundamental Analysis for 05.08.2025


    Time Zone: GMT +3
    Time Frame: 4 Hours (H4)


    Fundamental Analysis:
    The GBPUSD pair today is impacted by several key economic releases. For the GBP, significant data such as the RICS House Price Balance and HBOS House Price Index could lead to notable volatility, as higher-than-expected readings generally strengthen the Pound. Moreover, the recent Bank of England Monetary Policy Report, Monetary Policy Summary, and Interest Rate decision further shape traders' expectations about future monetary policy. On the USD side, upcoming releases such as Initial Jobless Claims and Wholesale Inventories can impact the USD valuation; a lower number of jobless claims would typically bolster the US dollar, reflecting a healthier labor market.


    Price Action:
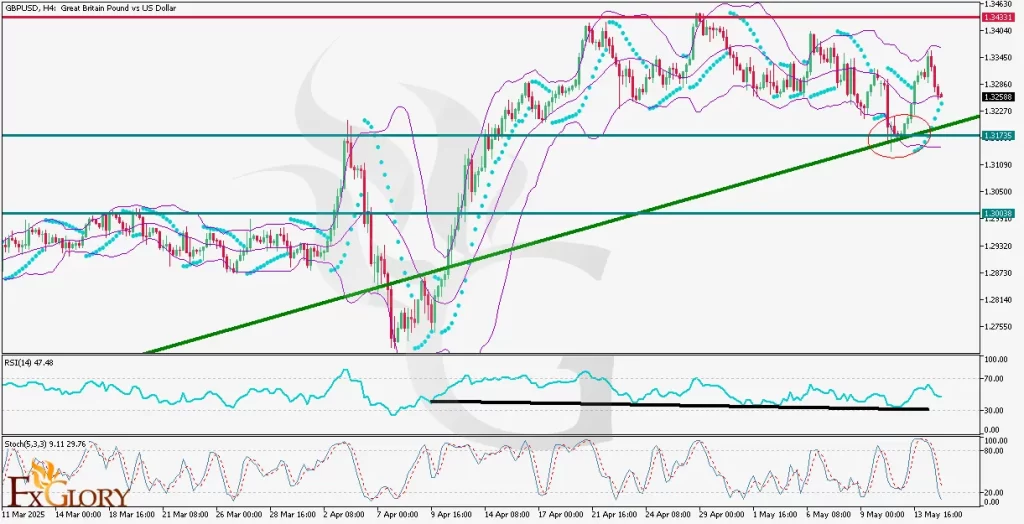
    Analyzing the GBP-USD H4 chart, the price has been consolidating sideways within a clear support zone. Currently, a new green bullish candle indicates a reaction from the support zone around 1.3257. If the upper boundary of this zone fails to sustain price, a move downward toward the previously broken resistance line around 1.3220 could provide stronger support. However, given the distance from the existing upward trend line, the overall bullish trend remains intact.


    Key Technical Indicators:
    Parabolic SAR:
    Currently above the candles, indicating short-term bearish momentum. A shift below the candles would confirm a renewed bullish stance.
    RSI (Relative Strength Index): The RSI reading is at 45.17, signaling neutral momentum. There's room for price movements in both directions, without imminent overbought or oversold conditions.
    MACD (Moving Average Convergence Divergence): The MACD histogram is slightly negative but approaching the zero line, indicating weakening bearish momentum and a potential bullish crossover soon, suggesting buyers may regain strength.
    Stochastic Oscillator: Stochastics at 20.58 (main line) and 32.13 (signal line) indicate oversold conditions, suggesting a potential bullish reversal may occur soon.


    Support and Resistance:
    Support:
    Immediate support lies at 1.3257, with a stronger support zone at 1.3220, coinciding with previous resistance turned support.
    Resistance: Immediate resistance is near the recent swing high at 1.3385, providing the first significant barrier for bullish continuation.


    Conclusion and Consideration:
    The GBP/USD technical and fundamental daily chart analysis indicates the pair is consolidating within a robust support area. The potential for a bullish reversal from current support is bolstered by oversold Stochastics and a weakening bearish MACD signal. However, traders must closely monitor today's GBP and USD economic releases for increased volatility and directional clarity. Caution is advised due to the mixed signals from technical indicators, highlighting the importance of waiting for confirmed price action signals.


    Disclaimer: The analysis provided for GBP/USD is for informational purposes only and does not constitute investment advice. Traders are encouraged to perform their own analysis and research before making any trading decisions on GBPUSD Market conditions can change quickly, so staying informed with the latest data is essential.


    FXGlory
    05.08.2025

  2. #242
    Senior Member FXGlory Ltd's Avatar
    Join Date
    Mar 2024
    Posts
    247

    Visit FXGlory Ltd's Youtube Channel
    USD/CAD Technical and Fundamental Analysis for 05.09.2025


    Time Zone: GMT +3
    Time Frame: 4 Hours (H4)


    Fundamental Analysis:
    The USD-CAD currency pair today is likely to experience significant volatility due to key economic news releases from both Canada and the United States. Canadian employment data, specifically the change in employment figures and the unemployment rate, is expected to strongly influence CAD strength. Better-than-expected job creation or a decline in the unemployment rate could strengthen the CAD against the USD. Conversely, several influential members of the US Federal Reserve, including Thomas Barkin, John Williams, Austan Goolsbee, Christopher Waller, Michael Barr, and Adriana Kugler, will deliver speeches today. Their commentary on future monetary policy directions and interest rates could cause fluctuations in the USD, especially if their tones are notably hawkish.


    Price Action:
    The USDCAD pair on the H4 chart has broken through the horizontal resistance at approximately 1.3882, potentially turning this level into new support upon any retest. The recent bullish candles show clear upward momentum; however, the price is currently extended significantly towards the upper Bollinger Band, suggesting a potential corrective pullback soon. Importantly, the break of the descending trend line indicates a potential shift from bearish to bullish sentiment, with recent bullish divergence observed on RSI further reinforcing this view.


    Key Technical Indicators:
    Bollinger Bands: The price has touched and exceeded the upper Bollinger Band, indicating it may be overextended and due for a correction or sideways consolidation to return within a normal trading range.
    RSI: Currently, the RSI shows bullish momentum but is nearing the overbought territory. Recent bullish divergence at previous lows suggests the bullish trend might still have underlying strength, though traders should anticipate corrective movements.
    Stochastic Oscillator: The Stochastic oscillator is deeply in overbought territory (above 90), signaling a possible short-term reversal or consolidation ahead. Caution is advised, as the price could initiate a short-term corrective phase.
    Volume: Volume analysis shows relatively moderate to high trading activity during the breakout, confirming strong market participation. However, watch for volume spikes during potential corrective moves for clues about strength and continuation.


    Support and Resistance:
    Support: The newly established support at 1.3882 will be crucial in validating the breakout. Another significant support lies around 1.3800.
    Resistance: Immediate resistance is at 1.3920 (current recent high), with the next major resistance located around the psychological level of 1.4000.


    Conclusion and Consideration:
    The USDCAD pair on the H4 timeframe displays bullish tendencies, strongly supported by price action and technical indicators like the Bollinger Bands, RSI, and Stochastic. However, due to the substantial bullish extension, traders should anticipate possible corrective moves toward support levels before resuming upward momentum. Today's significant economic releases from Canada and influential speeches from US Federal Reserve members may lead to increased volatility; hence, traders should exercise caution and consider risk management strategies closely.


    Disclaimer: The analysis provided for USD/CAD is for informational purposes only and does not constitute investment advice. Traders are encouraged to perform their own analysis and research before making any trading decisions on USDCAD Market conditions can change quickly, so staying informed with the latest data is essential.


    FXGlory
    05.09.2025

  3. #243
    Senior Member FXGlory Ltd's Avatar
    Join Date
    Mar 2024
    Posts
    247

    Visit FXGlory Ltd's Youtube Channel
    BTC/USD Technical and Fundamental Analysis for 05.13.2025


    Time Zone: GMT +3
    Time Frame: 4 Hours (H4)


    Fundamental Analysis:
    Today, BTCUSD's price action is closely influenced by upcoming economic releases from the United States, including the NFIB Small Business Index and Core CPI data. A higher-than-expected NFIB Small Business Index could strengthen the USD, placing downward pressure on BTCUSD. Meanwhile, market participants keenly await the Consumer Price Index (CPI) data, given its critical impact on inflation expectations and potential Federal Reserve actions. A higher CPI reading may boost USD strength, potentially pressuring BTC downward.


    Price Action:
    BTC-USD analysis on the H4 timeframe continues to display an uptrend, currently undergoing a correction phase. Recently, BTCUSD reached a strong support zone evidenced by a confluence of the horizontal support level and ascending trend line. The formation of a doji candle at this support zone indicates market indecision, highlighting the critical nature of this technical level. Traders should closely monitor subsequent candles to confirm price direction.


    Key Technical Indicators:
    Volume:
    Volume indicators suggest moderate trading activity. While volume decreased slightly during the latest corrective candles, a spike in buying volume near current support would significantly reinforce bullish sentiment, confirming potential reversal points.
    Parabolic SAR: Currently, the Parabolic SAR dots are positioned above the price action, suggesting short-term bearish pressure. However, their proximity to price action hints that a reversal may be imminent should the price stabilize and rise from the support zone.
    MFI (Money Flow Index): The MFI currently stands at 55.77, indicating balanced market participation with room for further buying or selling pressure. It suggests neither overbought nor oversold conditions, supporting the potential for price stabilization and subsequent bullish momentum from the current support zone.
    MACD (Moving Average Convergence Divergence): The MACD histogram shows a diminishing bullish momentum, indicating a weakening uptrend in the short term. Traders should watch for a bullish crossover of the MACD and signal line to validate potential upward continuation.


    Support and Resistance:
    Support:
    Immediate support is identified at $10142.09–$10279.95, strengthened by a historical consolidation area and the ascending trend line.
    Resistance: The immediate resistance levels to watch are around the recent high near $105786.14, with further resistance observed at historical peaks above this area.


    Conclusion and Consideration:
    BTCUSD on the H4 chart currently shows a corrective phase within an overall bullish trend, supported by key indicators like Volume, Parabolic SAR, MFI, and MACD. Today's significant economic data releases from the U.S. pose potential volatility, likely affecting BTC USD movements sharply. Traders should cautiously observe the critical support zone at current levels for potential reversal signals, while maintaining awareness of U.S. economic indicators which could heavily influence the BTCUSD pair.


    Disclaimer: The analysis provided for BTC/USD is for informational purposes only and does not constitute investment advice. Traders are encouraged to perform their own analysis and research before making any trading decisions on BTCUSD Market conditions can change quickly, so staying informed with the latest data is essential.


    FXGlory
    05.13.2025

  4. #244
    Senior Member FXGlory Ltd's Avatar
    Join Date
    Mar 2024
    Posts
    247

    Visit FXGlory Ltd's Youtube Channel
    GBP/AUD H4 Technical and Fundamental Analysis for 05.14.2025


    Time Zone: GMT +3
    Time Frame: 4 Hours (H4)


    Fundamental Analysis:
    GBPAUD is in focus today as markets react to significant economic releases from both the UK and Australia. From the GBP perspective, preliminary GDP figures came in stronger than expected at 0.6% quarter-on-quarter, outperforming forecasts of 0.1%. Manufacturing production and industrial output, however, missed expectations, declining by 0.8% and 0.6%, respectively. Despite a slightly wider goods trade deficit of -£19.7B, improvements in construction output and services index provided mixed signals for the UK economy. On the Australian side, employment data showed robust job growth, adding 20.9K positions against an anticipated 32.2K, with the unemployment rate holding steady at 4.1%. Traders will closely monitor how these mixed data points influence GBPAUD's direction, watching for potential shifts in sentiment or confirmation of the pair’s near-term momentum.


    Price Action:
    The GBPAUD pair on the H4 timeframe has recently shifted to a bearish structure, evidenced by the clear break and sustained movement below the 200-period moving average. The recent series of strong bearish candles highlights increased selling pressure, suggesting market sentiment has turned negative. This downward move follows an extended phase of consolidation around the moving average, indicating that sellers have gained decisive control. If the price continues to sustain this bearish momentum and clearly breaks below recent support levels, it could lead to further declines and solidify the bearish trend.


    Key Technical Indicators:
    100-period Moving Average (MA100): The GBPAUD price is currently trading below the 100-period moving average (blue line), confirming that the overall market sentiment remains bearish. This moving average has acted consistently as dynamic resistance, suppressing bullish attempts and reinforcing downward momentum. A sustained break above this moving average would signal a weakening of bearish control and potentially mark the beginning of a bullish reversal.
    MACD Indicator: The MACD histogram remains below the zero line, signaling ongoing bearish momentum. However, the histogram bars have begun to shorten, indicating a possible weakening in bearish strength and hinting at the potential for a bullish crossover. Traders should closely watch the MACD line for any bullish crossover above the signal line, as this could further validate a potential reversal scenario.


    Support and Resistance:
    Support: The nearest resistance lies near 2.06880, aligned with the 100-period moving average, which continues to act as a dynamic ceiling. A clear break above this could lead the price toward the next key resistance zone around 2.07600.
    Resistance: The nearest resistance lies near 2.06880, aligned with the 100-period moving average, which continues to act as a dynamic ceiling. A clear break above this could lead the price toward the next key resistance zone around 2.07600.


    Conclusion and Consideration:
    In conclusion, the GBPAUD pair is currently facing bearish pressure both technically and fundamentally. Despite better-than-expected UK GDP figures, mixed economic signals and robust employment data from Australia create uncertainty regarding future direction. Technically, price action confirms increased selling momentum with key moving averages acting as resistance, and MACD indicating potential for bearish momentum to weaken. Traders should closely monitor the pair’s reaction near critical support at 2.05650 and resistance around 2.06880 for clear directional cues, which could either confirm a continuation of the bearish trend or signal a possible bullish reversal.


    Disclaimer: The analysis provided for GBP/AUD is for informational purposes only and does not constitute investment advice. Traders are encouraged to perform their own analysis and research before making any trading decisions on GBPAUD Market conditions can change quickly, so staying informed with the latest data is essential.


    FXGlory
    05.14.2025

  5. #245
    Senior Member FXGlory Ltd's Avatar
    Join Date
    Mar 2024
    Posts
    247

    Visit FXGlory Ltd's Youtube Channel
    GBP/USD Technical and Fundamental Analysis for 05.15.2025


    Time Zone: GMT +3
    Time Frame: 4 Hours (H4)


    Fundamental Analysis:
    The GBPUSD currency pair will experience heightened volatility today due to significant economic events from both the UK and the US. Traders will closely monitor the UK's GDP release, Manufacturing Production, and Trade Balance figures, which will reflect the overall health of the UK economy and may influence GBP strength. For the US, numerous crucial indicators such as PPI, Retail Sales, Initial Jobless Claims, and speeches by Fed officials Mary Daly and Jerome Powell could provide significant insights into future US monetary policy. More hawkish tones from these speeches or stronger-than-expected economic data would likely boost the USD, potentially placing downward pressure on the GBPUSD pair.


    Price Action:
    The GBP-USD pair on the H4 chart recently pulled back from the upper Bollinger Band, retreating to test the middle Bollinger Band. This mid-band area acts as critical immediate support, and a failure here might see the pair challenging the ascending trendline near the 1.31735 level. Should this key trendline fail to hold, a deeper correction towards the psychological support at 1.30038 might be seen. Conversely, bullish recovery above the mid-band may drive the price to retest the major resistance at 1.34331.


    Key Technical Indicators:
    Bollinger Bands: The Bollinger Bands for GBP/USD are currently converging, indicating reduced volatility and a potential upcoming breakout. The price reacted from the upper band and is testing support at the middle band. A decisive break below the middle band could signal increased bearish momentum.
    Parabolic SAR: The Parabolic SAR dots have recently switched below the price, signaling a potential bullish reversal on this timeframe. However, traders should remain cautious and confirm this bullish signal with price action.
    RSI (Relative Strength Index): A divergence between price action and RSI is evident, with RSI making lower highs while the price recently made higher highs, suggesting weakening bullish momentum and potential bearish reversal ahead.
    Stochastic Oscillator: The stochastic oscillator is approaching oversold conditions, currently at 9.11 and 29.76. This suggests that a short-term bounce might occur soon if the price finds support, potentially limiting immediate downside risk.


    Support and Resistance:
    Support: Immediate support is located at 1.31735, aligning with the ascending trendline and previous price action area. The next significant support lies at the psychological level of 1.30038, historically significant for price reversals.
    Resistance: Immediate resistance stands at the recent swing high at 1.34331, representing a critical barrier for bulls to overcome for continued upward momentum.


    Conclusion and Consideration:
    The GBP-USD H4 technical and fundamental daily chart analysis reveals a critical juncture for the pair. Current indicators suggest mixed signals, indicating caution in both directions. Traders should pay close attention to today's economic events and news releases, as significant volatility is anticipated. Proper risk management and close monitoring of price action around key levels and economic announcements are strongly recommended.


    Disclaimer: The analysis provided for GBP/USD is for informational purposes only and does not constitute investment advice. Traders are encouraged to perform their own analysis and research before making any trading decisions on GBPUSD Market conditions can change quickly, so staying informed with the latest data is essential.


    FXGlory
    05.15.2025

  6. #246
    Senior Member FXGlory Ltd's Avatar
    Join Date
    Mar 2024
    Posts
    247

    Visit FXGlory Ltd's Youtube Channel
    NZDUSD Daily Technical and Fundamental Analysis for 05.16.2025


    Time Zone: GMT +3
    Time Frame: 4 Hours (H4)


    Fundamental Analysis:
    Today's fundamental outlook for NZDUSD is marked by critical economic data from both New Zealand and the United States. On the USD side, traders will closely monitor the release of Residential Building Permits and Housing Starts, indicators that reflect the health of the U.S. housing market. Additionally, the Import Price Index will provide early inflation insights, while the University of Michigan’s Consumer Sentiment and Inflation Expectations data may affect market sentiment toward the USD. Moreover, Richmond Fed President Thomas Barkin’s speech will be scrutinized for insights into future Fed monetary policy. In New Zealand, traders will pay attention to BusinessNZ’s Performance of Manufacturing Index (PMI), which could indicate economic expansion or contraction and influence the NZD’s strength.


    Price Action:
    Analyzing the NZD/USD pair on the H4 timeframe indicates a clear bearish trend through recent price action. The market has consistently formed lower highs and lower lows, confirming ongoing selling pressure. The most recent candles display bearish momentum, with price action struggling to break above moving average resistances, and continuously testing support near recent lows. The candlestick patterns suggest the bears remain in control, albeit with some hesitance approaching the immediate support area.


    Key Technical Indicators:
    Parabolic SAR: The Parabolic SAR indicator distinctly illustrates the bearish sentiment as its last 8 dots have consistently been placed above the price candles. This alignment signals continuing downward pressure and indicates that sellers are maintaining their dominance, suggesting further bearish continuation is likely unless a bullish reversal is clearly established.
    Moving Averages (MA 9 & MA 17): The moving averages confirm the bearish scenario; the short-term MA (9, blue line) recently crossed below the longer-term MA (17, orange line), a classic bearish crossover indicating continued selling pressure. As the price remains below both MAs, bearish momentum remains strong and intact.
    Volumes: The Volumes indicator is showing decreased buying activity with slightly increasing volume on bearish candles, signifying stronger selling pressure at current price levels. This suggests that bearish sentiment persists, with market participants leaning towards further downside movements.
    OsMA (Moving Average of Oscillator): The OsMA indicator currently shows bars below the zero line and increasing in negative magnitude, reflecting growing bearish momentum. Such negative divergence reinforces the potential for further downward movement, indicating sellers are likely to maintain control in the short term.
    RSI (Relative Strength Index): The RSI is currently at 39.41, trending downward but not yet in oversold territory. This signifies that while the bearish sentiment is clearly strong, the pair still has room to continue falling before becoming oversold, which would signal caution for potential reversals or consolidation.


    Support and Resistance:
    Support:
    Immediate support is identified at the 0.58585-0.58710 zone, a critical area where recent lows have formed.
    Resistance: The nearest resistance levels are at 0.59350 and subsequently at 0.59750, where previous swing highs and consolidation phases occurred.


    Conclusion and Consideration:
    The NZD USD H4 chart analysis continues to reflect a bearish trend, supported strongly by the Parabolic SAR, moving averages crossover, and negative OsMA. Traders should consider short positions, particularly if the immediate support at 0.58585 is breached with conviction. However, caution is advised ahead of significant fundamental news today from both NZD and USD, as these events could trigger increased volatility and potential reversals or corrective moves.


    Disclaimer: The analysis provided for USD/NZD is for informational purposes only and does not constitute investment advice. Traders are encouraged to perform their own analysis and research before making any trading decisions on USDNZD. Market conditions can change quickly, so staying informed with the latest data is essential.


    FXGlory
    05.16.2025

Page 25 of 25 FirstFirst ... 15 23 24 25

Bookmarks

Posting Permissions

  • You may not post new threads
  • You may not post replies
  • You may not post attachments
  • You may not edit your posts
  •