Page 24 of 24 FirstFirst ... 14 22 23 24
Results 231 to 238 of 238
Like Tree1Likes

Daily Forex Analysis By FXGlory

This is a discussion on Daily Forex Analysis By FXGlory within the Analytics and News forums, part of the Trading Forum category; BTC/USD H4 Daily Technical and Fundamental Analysis for 04.24.2025 Time Zone: GMT +3 Time Frame: 4 Hours (H4) Fundamental Analysis: ...


  1. #231
    Senior Member FXGlory Ltd's Avatar
    Join Date
    Mar 2024
    Posts
    239

    Visit FXGlory Ltd's Youtube Channel
    BTC/USD H4 Daily Technical and Fundamental Analysis for 04.24.2025


    Time Zone: GMT +3
    Time Frame: 4 Hours (H4)


    Fundamental Analysis:
    BTC-USD trading today may be significantly impacted by several USD economic events. The speech from Federal Reserve Bank of Cleveland President Beth Hammack may provide critical insight into future monetary policy, particularly regarding the Federal Reserve's balance sheet management, affecting USD strength. Additionally, key economic releases such as Initial Jobless Claims, Durable Goods Orders, and Existing Home Sales are expected to create volatility in the USD. BTC traders should closely monitor these USD developments as they may indirectly influence cryptocurrency market sentiment and BTCUSD volatility.


    Price Action:
    BTCUSD has recently broken its previous downward trend and initiated a bullish trajectory on the H4 chart. After a notable upward move, BTC/USD is currently undergoing a corrective phase, pulling back toward a critical technical support area at the intersection of two trendlines. Recent candlestick patterns with extended upper and lower wicks indicate considerable price instability and indecision among traders, signaling potential volatility ahead.


    Key Technical Indicators:
    Parabolic SAR:
    The Parabolic SAR dots are placed below the BTCUSD candlesticks, indicating ongoing bullish momentum. However, the decreasing spacing between dots suggests the momentum could be weakening, hinting at a potential trend reversal if price continues correcting.
    RSI (Relative Strength Index): RSI currently stands at 82.12, clearly within overbought territory. This implies that BTCUSD could be vulnerable to short-term corrections as buyers might begin to lose momentum, potentially providing entry points for traders anticipating pullbacks.
    MACD (Moving Average Convergence Divergence): The MACD histogram remains positive but shows declining momentum as the bars gradually decrease. This signals diminishing bullish sentiment, and traders should watch for a possible bearish crossover that might indicate further downside risk.
    %R (Williams Percent Range): The %R indicator is at -10.17, which is in the overbought region. This aligns with RSI, further indicating that BTCUSD may experience a corrective pullback or sideways consolidation in the near term.


    Support and Resistance:
    Support:
    Immediate BTCUSD support is identified near the critical cross-point of two trendlines around the $92,000 area, closely followed by a psychological support at $90,000.
    Resistance: Key resistance for BTCUSD is observed near the recent high of approximately $94,500, beyond which further bullish acceleration might target the significant psychological level of $95,000.


    Conclusion and Consideration:
    The BTC-USD H4 chart currently maintains bullish momentum, supported by technical indicators such as the Parabolic SAR and MACD. However, the price action coupled with RSI and %R in overbought territory strongly suggests that a short-term correction or consolidation could occur before any further significant bullish continuation. Traders should remain vigilant of upcoming USD economic news events today, as they may significantly influence BTCUSD market sentiment and volatility.


    Disclaimer: The analysis provided for BTC/USD is for informational purposes only and does not constitute investment advice. Traders are encouraged to perform their own analysis and research before making any trading decisions on BTCUSD. Market conditions can change quickly, so staying informed with the latest data is essential.


    FXGlory
    04.24.2025

  2. #232
    Senior Member FXGlory Ltd's Avatar
    Join Date
    Mar 2024
    Posts
    239

    Visit FXGlory Ltd's Youtube Channel
    USDCAD Daily Technical and Fundamental Analysis for 04.25.2025


    Time Zone: GMT +3
    Time Frame: 4 Hours (H4)


    Fundamental Analysis:
    Today, the US Dollar (USD) and Canadian Dollar (CAD) face significant economic events that could impact the USD-CAD currency pair. From the USD perspective, attention will be on Federal Reserve member Neel Kashkari's discussion at the University of Minnesota, consumer sentiment data from the University of Michigan, and IMF discussions on global economic stability. Stronger-than-expected data and a hawkish stance by Kashkari could bolster USD strength. For the CAD, traders await core retail sales and total retail sales reports, alongside participation in IMF discussions. Positive retail sales numbers would strengthen the CAD, potentially impacting USD/CAD negatively.


    Price Action:
    Analyzing USDCAD price action on the H4 chart, we observe a persistent bearish trend line, currently acting as a dynamic resistance. Price has approached this descending trend line and is presently trapped within the Ichimoku cloud. The price action indicates indecision and consolidation, signaling caution. Given the current momentum, a breakout above the trend line at the first attempt seems less likely, and traders should monitor price closely for further confirmation.


    Key Technical Indicators:
    Ichimoku Cloud:
    The price is currently stuck within the Ichimoku cloud, highlighting a neutral bias in the short term. The cloud's thickness implies substantial resistance, making an immediate bullish breakout challenging. Traders should await a clear breakout above or rejection from the cloud for decisive trading signals.
    Stochastic Oscillator: The Stochastic indicator currently shows values around 37, indicating neutral market conditions. The oscillator is neither oversold nor overbought, suggesting the market could continue to consolidate near the trend line resistance. Traders should watch for a decisive turn upwards or downwards in the Stoch as an early sign of potential momentum shift.


    Support and Resistance Levels:
    Support:
    Immediate support is located at 1.3850, marked by recent price consolidation lows.
    Resistance: Critical resistance stands at the descending trend line around the 1.3900 level, coinciding with the Ichimoku cloud top.


    Conclusion and Consideration:
    The USD CAD H4 technical analysis highlights ongoing bearish bias with strong resistance at the descending trend line and Ichimoku cloud. Fundamental events today could significantly influence market direction, with USD and CAD news providing volatility and clearer price action signals. Traders should closely observe the fundamental releases and wait for confirmed breakouts or rejections from key technical levels before entering trades.


    Disclaimer: The analysis provided for USD/CAD is for informational purposes only and does not constitute investment advice. Traders are encouraged to perform their own analysis and research before making any trading decisions on USDCAD. Market conditions can change quickly, so staying informed with the latest data is essential.


    FXGlory
    04.25.2025

  3. #233
    Senior Member FXGlory Ltd's Avatar
    Join Date
    Mar 2024
    Posts
    239

    Visit FXGlory Ltd's Youtube Channel
    EURGBP Daily Technical and Fundamental Analysis for 04.28.2025


    Time Zone: GMT +3
    Time Frame: 4 Hours (H4)


    Fundamental Analysis:
    The EUR-GBP currency pair is facing mixed fundamental drivers today. For the British Pound (GBP), the Confederation of British Industry (CBI) is set to release its Distributive Trades Survey, a leading indicator of consumer spending. A stronger-than-expected result could boost GBP strength. Meanwhile, the Euro (EUR) is influenced by the quarterly Unemployment Rate released by the National Statistics Institute. A lower-than-forecast unemployment figure would support the EUR. Traders must remain cautious, as both indicators could inject notable volatility into the EURGBP pair, impacting short-term market sentiment.


    Price Action:
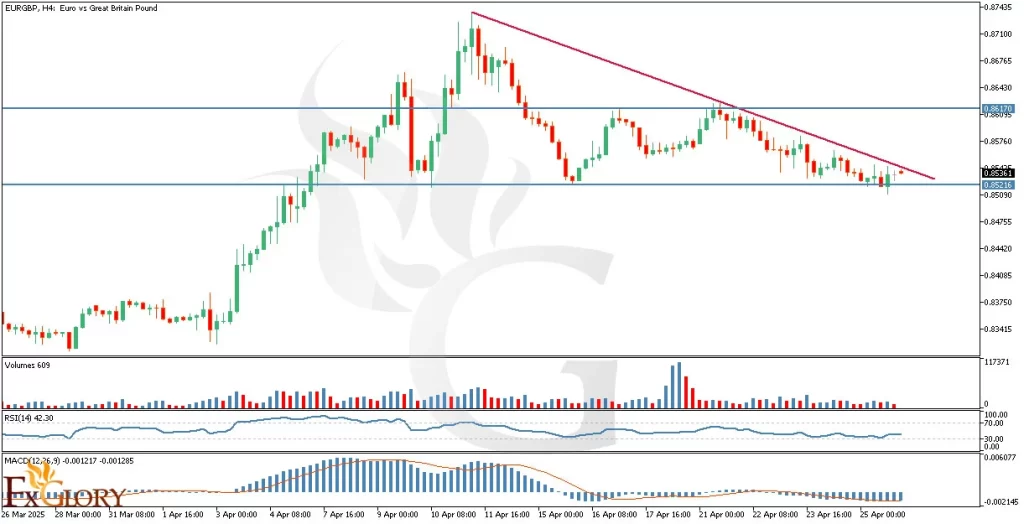
    On the EURGBP H4 chart, price action analysis shows that the pair is moving in a consistent bearish trend, forming lower highs as seen from the descending trendline. Despite a recent small bullish reaction from the support zone, the overall momentum remains to the downside. The price is struggling to break above the downward trendline resistance, suggesting sellers are still dominant. The last candles are showing indecision, indicating that a breakout or further rejection may soon define the next directional move.


    Key Technical Indicators:
    Volumes:
    Volume activity has recently decreased, which signals a lack of strong conviction from either buyers or sellers. This low volume environment often precedes a potential breakout, suggesting traders should watch for any volume spikes to confirm future direction.
    RSI (Relative Strength Index): The RSI for EUR/GBP on H4 stands at 42.30, reflecting bearish momentum but not yet reaching the oversold territory. This suggests that the pair still has room to fall before becoming technically oversold, in line with the current bearish trend.
    MACD (Moving Average Convergence Divergence): The MACD histogram remains slightly negative, and both MACD and signal lines are moving sideways below the zero line. This indicates ongoing bearish momentum but with a possible early sign of weakening selling pressure, hinting at a potential consolidation phase.


    Support and Resistance:
    Support:
    Immediate support is established around 0.85216, a level that previously acted as a strong floor and recently triggered a small bounce.
    Resistance: The nearest resistance is aligned with 0.86170, coinciding with previous highs and the descending trendline, acting as a critical barrier for bullish attempts.


    Conclusion and Consideration:
    The EUR GBP H4 technical and fundamental chart daily analysis suggests a bearish bias remains dominant for the short term. Volumes are low, MACD is showing slight bearish momentum, and RSI indicates more downside room. However, traders should stay alert to potential changes in price action, especially considering today's scheduled economic releases for EUR and GBP. Fundamental surprises could trigger sharp movements outside of the current technical setup. Until a confirmed breakout above the descending trendline occurs, the bias favors selling rallies near resistance levels.


    Disclaimer: The analysis provided for EUR/GBP is for informational purposes only and does not constitute investment advice. Traders are encouraged to perform their own analysis and research before making any trading decisions on EURGBP. Market conditions can change quickly, so staying informed with the latest data is essential.


    FXGlory
    04.28.2025
    Last edited by FXGlory Ltd; 04-28-2025 at 12:43 AM.

  4. #234
    Senior Member FXGlory Ltd's Avatar
    Join Date
    Mar 2024
    Posts
    239

    Visit FXGlory Ltd's Youtube Channel
    EURUSD Daily Technical and Fundamental Analysis for 04.29.2025


    Time Zone: GMT +3
    Time Frame: 4 Hours (H4)


    Fundamental Analysis:
    Today's fundamental landscape is focused on significant economic indicators for both the Euro and the US Dollar. The Euro faces important consumer sentiment data from NIQ, providing insights into the financial confidence of European consumers. Traders will closely monitor this release, as increased consumer confidence typically strengthens the EUR. The USD, meanwhile, awaits trade balance figures and housing market updates. Positive US trade data and robust housing prices could bolster the USD, influencing EURUSD volatility significantly.


    Price Action:
    The EUR/USD price action analysis on the H4 chart indicates a possible end to the corrective phase. Previously, EUR-USD broke the initial ascending trend line, subsequently finding solid support at a second trend line. Currently, the price has rebounded upward, penetrating into the Ichimoku cloud (Kumo). The ongoing bullish candle formation suggests an attempt to retest the previously broken trend line resistance, potentially signaling a continuation of the broader bullish trend.


    Key Technical Indicators:
    Ichimoku Cloud: EUR USD price is currently trading inside the Kumo cloud, suggesting indecision or a transitional phase in the market. However, its upward direction within the cloud indicates bullish strength attempting a trend resumption. Traders should watch closely for a definitive breakout above the cloud for confirmation.
    RSI (Relative Strength Index): RSI is at 55.09, reflecting neutral market conditions. This position implies that EURUSD has sufficient room to extend its bullish movement without reaching overbought conditions. The indicator supports bullish sentiment but remains neutral enough to accommodate further upward moves.
    MACD (Moving Average Convergence Divergence): The MACD histogram is narrowing, signaling diminishing bearish momentum. A potential bullish crossover is likely, which would reinforce the bullish momentum and support a positive outlook for EUR-USD in the near term.


    Support and Resistance:
    Support: Immediate support is firmly established at 1.1310, corresponding to recent lows and the second trend line support.
    Resistance: Immediate resistance is at the previously broken ascending trend line, around 1.1425. A breakout above this could push EURUSD towards the next resistance at 1.1465, marking recent swing highs.


    Conclusion and Consideration:
    EUR/USD analysis on the H4 timeframe highlights renewed bullish sentiment, reinforced by technical indicators such as Ichimoku Cloud, RSI, and MACD. Given today's significant economic data releases for both the Euro and the USD, traders should remain cautious of heightened volatility. Confirmation above the Ichimoku cloud and the broken ascending trend line resistance will likely strengthen bullish confidence significantly. However, any negative surprise in the consumer sentiment or US economic releases might bring the price back to test the established support levels.


    Disclaimer: The analysis provided for EUR/USD is for informational purposes only and does not constitute investment advice. Traders are encouraged to perform their own analysis and research before making any trading decisions on EURUSD Market conditions can change quickly, so staying informed with the latest data is essential.


    FXGlory
    04.29.2025

  5. #235
    Senior Member FXGlory Ltd's Avatar
    Join Date
    Mar 2024
    Posts
    239

    Visit FXGlory Ltd's Youtube Channel
    GBPUSD Daily Technical and Fundamental Analysis for 04.30.2025


    Time Zone: GMT +2
    Time Frame: 4 Hours (H4)


    Fundamental Analysis:
    The GBP/USD currency pair reflects the exchange rate between the British Pound (GBP) and the US Dollar (USD). GBPUSD today experienced significant movements influenced by fundamental factors. The US dollar weakened to its lowest level of the year, primarily due to shifting expectations around US tariffs, which pressured the currency and led to a rally in GBP futures towards the 1.3 level. Conversely, the British pound demonstrated strength, with GBP/USD on the cusp of testing the 2024 high of 1.3434, as it broke out of the range-bound price action observed at the end of the previous week. This upward momentum in the pound was further supported by bullish sentiment in the market, as traders anticipated favorable economic conditions in the UK. Overall, the interplay between a weakening US dollar and a strengthening British pound contributed to the dynamic movements observed in the GBP/USD pair on this day.


    Price Action:
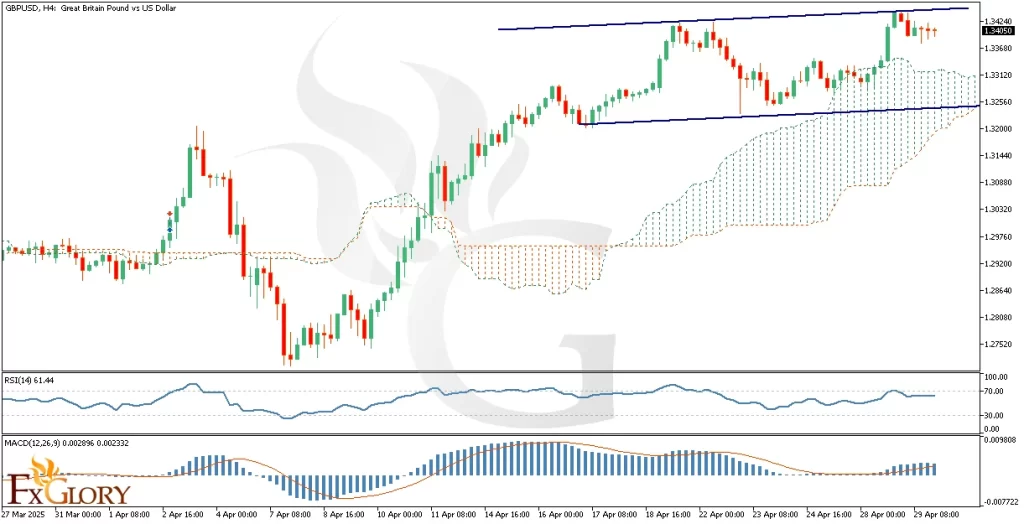
    The GBP/USD currency pair reflects the exchange rate between the British Pound (GBP) and the US Dollar (USD). As of April 30, 2025, technical indicators and price action reveal a bullish outlook within a clear flag pattern on the 4-hour chart. The pair is consolidating near the upper boundary of the flag, just below the resistance at approximately 1.3424, indicating potential continuation if this resistance level is breached. The Ichimoku Cloud reinforces the bullish sentiment, with the price trading well above the cloud, suggesting sustained upward momentum. RSI stands at 61.44, indicating the pair remains in bullish territory without being overbought, while the MACD histogram shows a reduction in bullish momentum, hinting at potential short-term consolidation or retracement. Overall, technical signals align with a cautiously bullish scenario, pending a breakout above the current resistance to confirm further upward movement.


    Key Technical Indicators:
    Ichimoku Cloud: The price is trading notably above the Ichimoku Cloud on the H4 chart, clearly indicating a bullish sentiment and suggesting buyers have dominant control. The cloud itself is ascending and widening, reinforcing the strength of the ongoing bullish momentum. A sustained position above the cloud typically serves as confirmation of upward direction, making it a critical area to watch for potential bullish continuation in GBP/USD.
    Relative Strength Index (RSI): The RSI currently stands at 61.44, comfortably above the neutral 50 level but still below the overbought threshold of 70. This reading confirms the bullish momentum without signaling immediate exhaustion, implying that the GBP/USD pair still has potential room to extend gains.
    MACD (Moving Average Convergence Divergence): The MACD histogram bars have begun to contract slightly, indicating a mild reduction in bullish momentum. Although the MACD line remains above the signal line, which confirms an overall bullish bias, the narrowing histogram suggests caution in the short term.


    Support and Resistance:
    Support: Immediate support levels are identified at 1.32700, followed by 1.32300 and 1.32000. These levels represent key zones where buyers may re-enter on price dips, offering potential points of bullish entry or re-entry.
    Resistance: Resistance levels stand prominently at 1.34200, with further resistance observed at 1.34500 and 1.35000. A sustained breakout above 1.34200 would reinforce bullish momentum, targeting subsequent resistance levels for potential upward continuation.


    Conclusion and Consideration:
    The GBPUSD H4 technical analysis reveals sustained bullish momentum, confirmed by the bullish positioning above the Ichimoku Cloud, supportive RSI at 61.44, and MACD remaining bullish but showing signs of short-term consolidation. Immediate support zones at 1.32700, 1.32300, and 1.32000 may provide attractive entry points if the price retraces for a healthy retest before continuing higher. On the upside, clear resistances at 1.34200, 1.34500, and notably at 1.35000 represent critical hurdles; a decisive breakout above these levels would reinforce bullish continuation. However, traders should remain cautious amid today's fundamental drivers, including shifting sentiment related to US tariff policy and positive market expectations for UK economic conditions. Heightened volatility is anticipated, emphasizing the importance of prudent risk management in this GBPUSD H4 forex analysis..


    Disclaimer: The analysis provided here is for informational purposes only and should not be considered financial advice. Market conditions can change rapidly, and traders should perform their own research and analysis before making trading decisions. Past performance is not indicative of future results. Always trade responsibly.


    FXGlory
    04.30.2025

  6. #236
    Senior Member FXGlory Ltd's Avatar
    Join Date
    Mar 2024
    Posts
    239

    Visit FXGlory Ltd's Youtube Channel
    USD/JPY Daily Technical and Fundamental Analysis for 05.01.2025


    Time Zone: GMT +3
    Time Frame: 4 Hours (H4)


    Fundamental Analysis:
    Today, the USD-JPY is influenced by several high-impact economic releases and events. The US Dollar (USD) may experience increased volatility due to remarks by US President Donald Trump at the Cuomo Town Hall event, alongside key economic indicators such as Jobless Claims, Manufacturing PMI, and ISM Manufacturing data. Positive readings from these indicators, indicating stronger economic conditions, may support USD strength. On the Japanese Yen (JPY) side, market participants will monitor the Bank of Japan's interest rate statement and Governor's press conference closely. A more hawkish-than-expected stance could strengthen the Yen significantly.


    Price Action:
    Analyzing the USDJPY H4 chart, we observe a clear price breakout from a downtrend, followed by a successful pullback and retest of the breakout level. Currently, the price has begun forming an ascending trend supported by a bullish trendline, signaling the start of potential bullish momentum. The first key target for price movement upwards is set at the recent high.


    Key Technical Indicators:
    Parabolic SAR:
    The Parabolic SAR dots are currently positioned below the candles, confirming the bullish momentum in the short term. As long as these dots remain below price action, bullish sentiment will prevail.
    EMA21: The 21-period Exponential Moving Average (EMA) currently acts as a dynamic support, with the price trading just above it. This alignment indicates a short-term bullish bias and may guide traders towards buying opportunities as long as price sustains above the EMA21.
    MACD: The MACD indicator has shown a bullish crossover, with the MACD line above the signal line and histogram bars moving upwards, indicating strengthening bullish momentum. Continued bullish MACD signals support further upward movement.
    Stochastics: The Stochastic oscillator is approaching overbought levels, currently around 71.94, signaling strong buying pressure. While the price may see slight retracements, continued momentum in this region supports ongoing bullish sentiment.


    Support and Resistance Levels:
    Support:
    Immediate dynamic support lies at the bullish trendline near 142.30, followed by a stronger static support at the previous breakout area around 141.50.
    Resistance: The nearest resistance is seen at the recent swing high around 143.85, followed by psychological resistance at 145.00.


    Conclusion and Consideration:
    The USD-JPY H4 technical analysis suggests ongoing bullish sentiment, supported by key indicators like Parabolic SAR, EMA21, MACD, and Stochastics. Fundamental events today could create volatility and significant directional movements. Traders should closely monitor USD news releases and BOJ statements for potential shifts in market dynamics. It is prudent to manage risk effectively, considering potential increased volatility.


    Disclaimer: The analysis provided for USD/JPY is for informational purposes only and does not constitute investment advice. Traders are encouraged to perform their own analysis and research before making any trading decisions on USDJPY Market conditions can change quickly, so staying informed with the latest data is essential.


    FXGlory
    05.01.2025

  7. #237
    Senior Member FXGlory Ltd's Avatar
    Join Date
    Mar 2024
    Posts
    239

    Visit FXGlory Ltd's Youtube Channel
    AUD/USD Technical and Fundamental Analysis for 05.02.2025


    Time Zone: GMT +3
    Time Frame: 4 Hours (H4)


    Fundamental Analysis:
    The AUD-USD currency pair faces increased volatility due to significant economic news releases for both the US and Australian economies. The US Dollar will be influenced by crucial labor market data, including Non-Farm Payrolls (NFP), the unemployment rate, and labor cost reports. Stronger-than-expected results typically strengthen the USD, impacting AUDUSD negatively. Conversely, Australian Dollar movements hinge on the upcoming retail sales figures and Producer Price Index (PPI) data. Positive Australian retail sales data could bolster AUD strength. Additionally, AUD is exposed to political uncertainty due to imminent parliamentary elections, potentially triggering increased volatility.


    Price Action:
    AUD USD analysis in the H4 timeframe reveals that price action has recently broken the downtrend line, successfully retesting it, and subsequently transitioned into an ascending trend before entering a sideways consolidation channel. Currently, the price is approaching the bottom boundary of this horizontal channel. Historically, this lower boundary has provided robust support, indicating a crucial pivot point. If the lower channel boundary holds, a bullish continuation towards the upper boundary is highly probable.


    Key Technical Indicators:
    Parabolic SAR:
    The Parabolic SAR dots currently appear above the price bars, indicating a bearish pressure. This suggests caution, as bears currently exert control, albeit within the context of the broader sideways market.
    Bollinger Bands: Bollinger Bands are narrowing, indicative of decreasing volatility and potential preparation for a significant breakout. The price is currently near the lower Bollinger Band, typically signaling potential upward movement upon successful support confirmation.
    RSI (Relative Strength Index): The RSI indicator at 47.03 remains neutral and suggests balanced buying and selling pressures. The neutral stance indicates there is ample room for significant movements in either direction depending on forthcoming market triggers.
    MACD (Moving Average Convergence Divergence): The MACD line is marginally below the signal line, with a modest bearish histogram. This slight bearish sentiment indicates waning bullish momentum within the current consolidation phase, reinforcing the need for caution until clearer signals emerge.


    Support and Resistance:
    Support:
    The key immediate support level is located at 0.6340, coinciding with the lower boundary of the horizontal channel and recent support area.
    Resistance: Immediate resistance is at 0.6440, aligned with the upper boundary of the horizontal consolidation channel and recent highs.


    Conclusion and Consideration:
    The AUD-USD pair on the H4 timeframe is currently consolidating within a well-defined horizontal channel following a bullish breakout from a previous downtrend line. Given the fundamental catalysts, including pivotal USD labor data and AUD retail sales figures, traders should brace for heightened volatility. Technically, a sustained hold above the support line at 0.6340 may trigger a bullish push toward resistance at 0.6440. However, traders should carefully monitor news events and technical confirmations before positioning.


    Disclaimer: The analysis provided for AUD/USD is for informational purposes only and does not constitute investment advice. Traders are encouraged to perform their own analysis and research before making any trading decisions on AUDUSD Market conditions can change quickly, so staying informed with the latest data is essential.


    FXGlory
    05.02.2025

  8. #238
    Senior Member FXGlory Ltd's Avatar
    Join Date
    Mar 2024
    Posts
    239

    Visit FXGlory Ltd's Youtube Channel
    USDCHF H4 Daily Technical and Fundamental Analysis for 05.05.2025


    Time Zone: GMT +3
    Time Frame: 4 Hours (H4)


    Fundamental Analysis:
    The USDCHF pair today faces volatility due to key economic data releases. USD traders should pay close attention to the Purchasing Managers' Index (PMI) data from S&P Global and ISM. These indices offer critical insights into the economic health of the US services sector. Positive PMI figures above 50.0 generally support a bullish outlook for the USD, increasing investor confidence. Conversely, the CHF is influenced today by Switzerland's latest Consumer Price Index (CPI) figures, a crucial indicator for inflation expectations. Any CPI results significantly deviating from forecasts can induce volatility in CHF, impacting USD CHF price movements.


    Price Action:
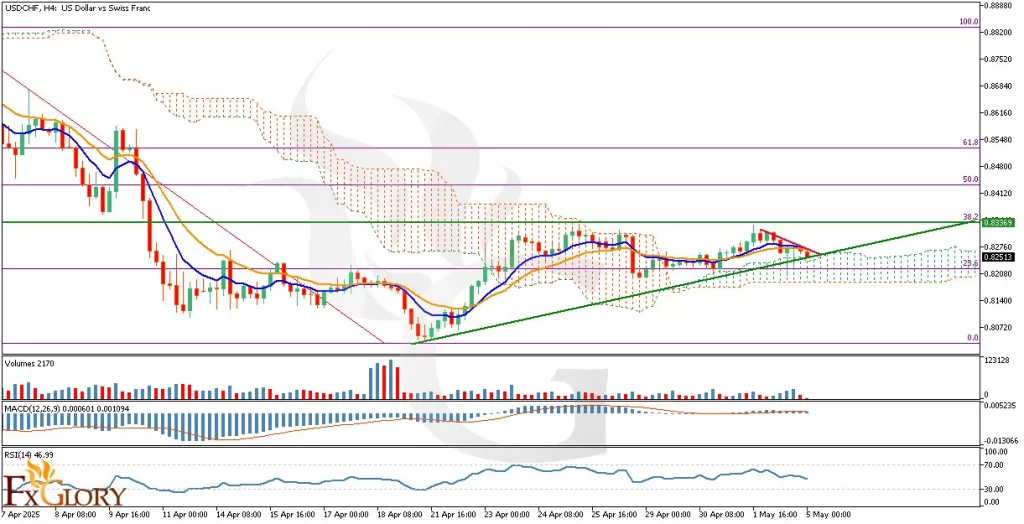
    Analyzing USDCHF price action on the H4 chart, we notice the pair has been slightly bullish recently. However, in the last candles before market close, bearish momentum emerged, pushing prices towards the Ichimoku Cloud's upper band, which currently acts as immediate support. If prices breach and penetrate into the cloud, a bearish continuation is plausible. Meanwhile, the short-term moving average (9 MA, blue) and the longer-term average (17 MA, orange) have converged closely, with the 9 MA slightly dipping towards the 17 MA, signaling a potential bearish crossover and trend reversal if this continues.


    Key Technical Indicators:
    Ichimoku Cloud:
    The Ichimoku indicator reveals price currently positioned just above the cloud's upper boundary, suggesting immediate support. Entering the cloud would strengthen bearish sentiment and indicate potential downward momentum.
    Moving Averages (MA 9 and MA 17): The 9-period MA is declining slightly toward the 17-period MA, with both lines converging closely. A confirmed bearish crossover could signal a stronger bearish outlook.
    Volumes: The last two volume bars are declining and red, signifying weakening bullish participation and strengthening the bearish scenario if volume continues to diminish.
    MACD: The MACD histogram shows decreasing bullish momentum, implying weakening buying pressure and an impending bearish divergence. Traders should watch closely for the MACD line crossing below the signal line as a confirmation of bearish momentum.
    RSI (Relative Strength Index): RSI is currently around 46.99, indicating a neutral momentum scenario with room for price movement in either direction. It highlights indecision in the current market context, urging caution.


    Support and Resistance:
    Support:
    Immediate support lies near the Ichimoku Cloud upper band around 0.8230; a significant break below could extend losses towards the psychological level of 0.8200.
    Resistance: Key resistance is clearly identified at the recent high near 0.8336, serving as a barrier to bullish attempts.


    Conclusion and Consideration:
    The USD/CHF H4 chart analysis suggests a cautious bearish bias due to the weakening bullish momentum evident in key technical indicators like MACD and MA convergence. Traders should closely monitor today's crucial economic releases for USD and CHF, as outcomes will significantly influence the USD-CHF pair's volatility. A breach of the immediate Ichimoku support could intensify bearish sentiments. Conversely, positive US data could reignite bullish momentum.


    Disclaimer: The analysis provided for USD/CHF is for informational purposes only and does not constitute investment advice. Traders are encouraged to perform their own analysis and research before making any trading decisions on USDCHF Market conditions can change quickly, so staying informed with the latest data is essential.


    FXGlory
    05.05.2025

Page 24 of 24 FirstFirst ... 14 22 23 24

Bookmarks

Posting Permissions

  • You may not post new threads
  • You may not post replies
  • You may not post attachments
  • You may not edit your posts
  •