
 1Likes
 LinkBack URL
 About LinkBacks


BTCUSD H4 Technical and Fundamental Analysis for 03.03.2025
Time Zone: GMT +2
Time Frame: 4 Hours (H4)
Fundamental Analysis:
Bitcoin (BTC) remains sensitive to broad macroeconomic factors and investor sentiment, as the cryptocurrency market shows steady institutional and retail interest. In todays session, the focus will be on the USD side of the BTCUSD pair, with multiple economic releases such as the ISM Manufacturing PMI, Construction Spending, and the Wards Auto data. Positive US data can strengthen the dollar, potentially pressuring BTC if risk appetite wanes. Meanwhile, Bitcoins fundamental drivers include ongoing discussions about its upcoming halving cycle and overall adoption trends, which continue to shape the long-term outlook for the cryptocurrency.
Price Action:
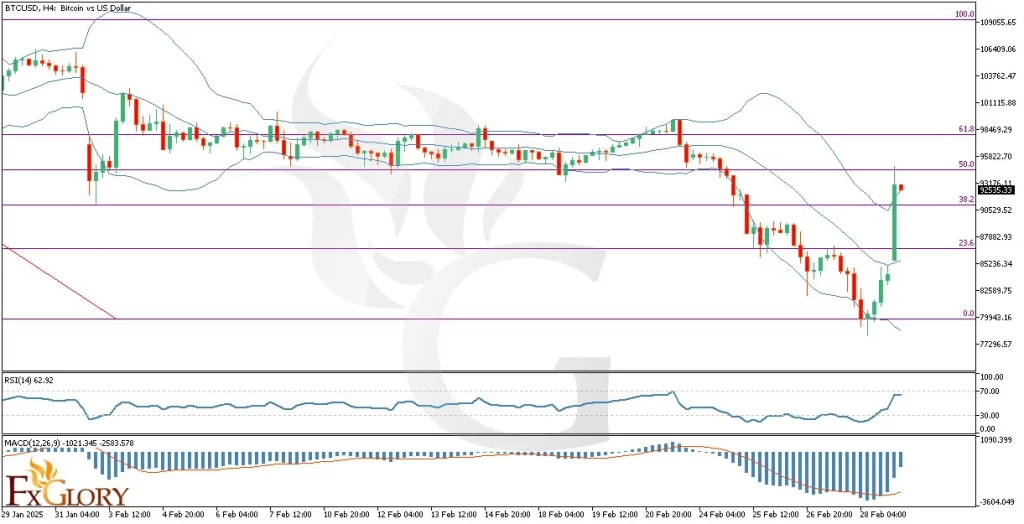
Over the weekend, BTCUSD showed a notable correction, moving from 78k to 92k on the H4 chart but failing to break above the 50% Fibonacci retracement level. This inability to push higher suggests that bullish momentum may be pausing, and the pair could revisit the 38.2% or 23.6% Fib levels if downside pressure intensifies. Price action has temporarily stalled near the upper Bollinger Band, indicating that immediate upside might be capped. Traders are watching closely for any bearish follow-through that could send the price back toward the 0% Fib level in the coming sessions.
Key Technical Indicators:
Bollinger Bands: The Bollinger Bands on the BTCUSD H4 chart show that the price has recently touched the upper band, signaling a potential overextension. Historically, price retracements often follow upper band touches, especially if accompanied by lower volume or weakening momentum. A break back toward the middle band would indicate a corrective phase, aligning with the possibility of retesting lower Fibonacci levels. Should volatility increase, a close outside the bands could confirm a more decisive breakout or breakdown.
RSI (Relative Strength Index): The RSI appears to be hovering near the upper threshold of neutral territory, reflecting neither extreme overbought nor oversold conditions. This position suggests that while bullish momentum was strong enough to push BTCUSD to 92k, it did not hit a level typically associated with a clear reversal. A downturn in the RSI below the midpoint would reinforce a potential bearish pullback. Conversely, a sustained move above 70 would indicate strong bullish pressure and might invalidate the short-term corrective bias.
MACD (Moving Average Convergence Divergence): The MACD histogram is currently positive, showing that the MACD line remains above the signal line, indicative of ongoing bullish momentum. However, the histogram bars have started to shorten, suggesting a possible slowdown in buying pressure. If the MACD line crosses below the signal line, it would be an early sign of bearish momentum gaining traction. Traders should monitor this indicator closely for confirmation of any trend shift on the H4 timeframe.
Support and Resistance:
Support: Immediate support is aligned with the 38.2% Fibonacci retracement level, offering the first defense for the bulls. A deeper support can be found near the 0% Fib level, which could become a target if selling pressure intensifies.
Resistance: The nearest resistance lies just above the 50% Fibonacci retracement level around the 92k region. A break above this zone may expose further resistance near the 95k handle, a region of previous price consolidation.
Conclusion and Consideration:
In this technical and fundamental chart daily analysis for BTCUSD H4, the current price action suggests a cautious stance is warranted. While the bullish momentum brought Bitcoins price from 78k to 92k, the failure to clear the 50% Fib level points to a potential pullback. Key economic data from the US could drive volatility for BTCUSD, as shifts in risk sentiment often impact the cryptocurrency market. Traders should keep a close eye on the Bollinger Bands, RSI, and MACD for clearer directional cues, alongside upcoming US economic releases that may influence the dollar side of the pair.
Disclaimer: The analysis provided for BTC/USD is for informational purposes only and does not constitute investment advice. Traders are encouraged to perform their own analysis and research before making any trading decisions on BTCUSD. Market conditions can change quickly, so staying informed with the latest data is essential.
FXGlory
03.03.2025


 Reply With Quote


Bookmarks