Page 20 of 20 FirstFirst ... 10 18 19 20
Results 191 to 200 of 200
Like Tree1Likes

Daily Forex Analysis By FXGlory

This is a discussion on Daily Forex Analysis By FXGlory within the Analytics and News forums, part of the Trading Forum category; USDCAD H4 Technical and Fundamental Analysis for 02.06.2025 Time Zone: GMT +2 Time Frame: 4 Hours (H4) Fundamental Analysis The ...


  1. #191
    Senior Member FXGlory Ltd's Avatar
    Join Date
    Mar 2024
    Posts
    201

    Visit FXGlory Ltd's Youtube Channel
    USDCAD H4 Technical and Fundamental Analysis for 02.06.2025


    Time Zone: GMT +2
    Time Frame: 4 Hours (H4)


    Fundamental Analysis
    The USDCAD currency pair is experiencing volatility due to key economic events today. The US Dollar (USD) is impacted by multiple speeches from FOMC members Michelle Bowman, Philip Jefferson, and Christopher Waller, which may provide monetary policy signals affecting market sentiment. If their comments are hawkish, the USD could strengthen, while dovish remarks may lead to USD weakness. Additionally, Initial Jobless Claims, Challenger Job Cuts, and Productivity Reports will offer insights into the US labor market, potentially adding further USD volatility. On the Canadian Dollar (CAD) side, the Ivey PMI report is crucial; a higher-than-expected reading could strengthen CAD, driving USDCAD lower, while a weak reading could weaken CAD, pushing USD CAD higher.


    Price Action Analysis
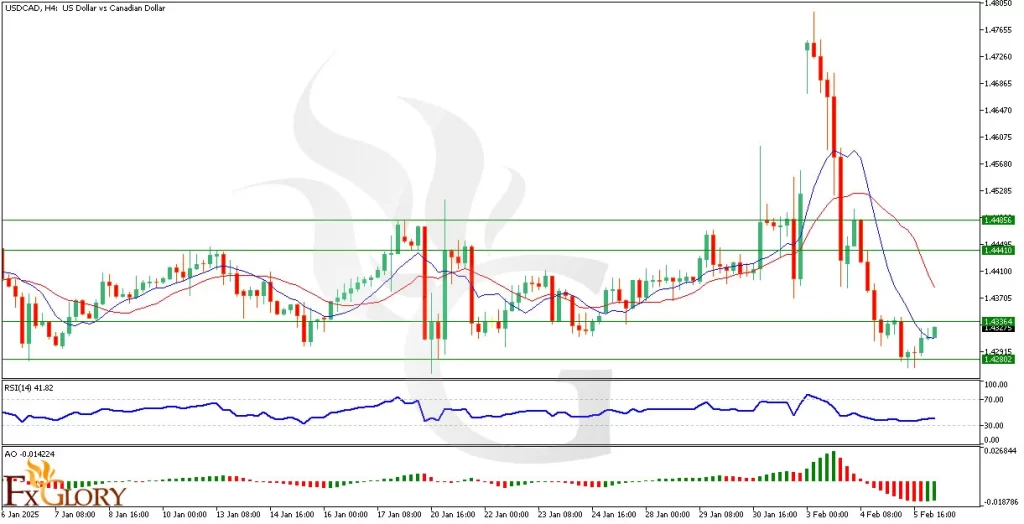
    The USDCAD H4 chart shows a sharp bearish trend, followed by a minor correction in the last five candles. Four of these candles are bullish but relatively small, indicating a weak recovery attempt. The USD/CAD Price has found support at 1.4280, leading to a slight bounce, but the lack of strong bullish momentum suggests that this is likely a temporary consolidation rather than a reversal. The downtrend remains intact, and unless buyers push above key resistance levels, further bearish pressure could emerge.


    Key Technical Indicators
    Moving Averages (MA 9 - Blue & MA 17 - Red): The short-term MA (9) has crossed below the long-term MA (17), forming a bearish crossover, confirming a downtrend continuation signal. The moving averages are both sloping downward, reinforcing selling pressure. Despite the recent small bullish candles, the USD CAD price remains below both moving averages, meaning the bearish trend is still dominant unless price reclaims the moving averages.
    Relative Strength Index (RSI 14): The RSI is at 41.82, signaling bearish sentiment but not yet oversold conditions. This suggests there is still room for further downside before the market reaches oversold territory. If the RSI remains below 50, bears remain in control, and a drop below 30 would indicate oversold conditions, potentially leading to a short-term reversal or consolidation.
    Awesome Oscillator (AO): The AO is at -0.014, confirming that negative momentum is still dominant, although the histogram bars are shrinking, indicating a possible slowdown in bearish momentum. If AO turns positive, it could suggest a trend shift, but for now, the bearish trend remains intact.


    Support and Resistance
    Support: Immediate support is located at 1.4280, which has acted as a bounce level in recent price action, and if broken, it could push the USD/CAD price further down.
    Resistance: The first resistance level is 1.4385, which aligns with recent price rejections and the 9-period moving average, while the next major resistance level is 1.4440, corresponding to the previous breakdown zone. A break above this level would challenge the bearish scenario and indicate potential bullish momentum.


    Conclusion and Considerations
    The USDCAD H4 technical analysis suggests a bearish trend continuation, with the bearish moving average crossover, RSI below 50, and AO still negative reinforcing the downside bias. The recent minor bullish correction lacks strong momentum, indicating a possible continuation of the downtrend unless buyers push above key resistance levels. Upcoming fundamental news events, including Ivey PMI for CAD and FOMC speeches, could drive volatility, making it crucial to monitor USDCAD price reactions. Traders should watch for a breakout or rejection at resistance levels, while a break below 1.4280 could trigger further bearish movement. Proper risk management is crucial, given the upcoming news releases that may cause sharp price fluctuations.


    Disclaimer: The analysis provided for USD/CAD is for informational purposes only and does not constitute investment advice. Traders are encouraged to perform their own analysis and research before making any trading decisions on USDCAD. Market conditions can change quickly, so staying informed with the latest data is essential.


    FXGlory
    02.06.2025

  2. #192
    Senior Member FXGlory Ltd's Avatar
    Join Date
    Mar 2024
    Posts
    201

    Visit FXGlory Ltd's Youtube Channel
    GOLDUSD H4 Technical and Fundamental Analysis for 02.10.2025


    Time Zone: GMT +2
    Time Frame: 4 Hours (H4)


    Fundamental Analysis
    The price of Gold (XAU/USD) remains highly sensitive to macroeconomic conditions and upcoming fundamental data releases. Today, the market is closely watching the Survey of Firms' Inflation Expectations from the Federal Reserve Bank of Cleveland. If inflation expectations rise, it could signal potential hawkish monetary policy from the Fed, strengthening the USD and pressuring Gold prices. Conversely, lower inflation expectations may support Gold as an inflation hedge. Additionally, broader market sentiment around interest rate decisions and geopolitical risks could drive gold price action. Investors will also monitor the US Dollar Index (DXY) for signs of strength or weakness, influencing Gold’s movement.


    Price Action
    Gold has been in a strong uptrend, continuously making new all-time highs over the past few weeks. However, after failing to break the previous ATH, the price action has formed a double-top reversal pattern, suggesting potential downside correction before a continuation of the bullish move. The last red candlestick with a long lower wick indicates strong rejection at the ATH level, reinforcing a temporary pullback. The first support level is the ascending trendline (green), and if the correction continues, the second support level lies around 2830. If the price finds strong demand at these levels, the bullish structure may resume, aiming for new all-time highs.


    Key Technical Indicators
    Parabolic SAR:
    The last three Parabolic SAR dots are positioned below the price, confirming that the bullish trend remains intact. However, a shift in position above the price would indicate a potential trend reversal.
    Bollinger Bands: Gold is currently supported by the middle Bollinger Band (20-period moving average). If the price continues to correct lower, it may test the lower Bollinger Band, acting as dynamic support. If the price rebounds from the middle band, the uptrend remains valid.
    RSI (Relative Strength Index): The RSI is currently at 62.48, still below the overbought threshold (70). This indicates that Gold has room for further upside, but a break below 50 could suggest increasing bearish momentum.
    MACD (Moving Average Convergence Divergence): The MACD line is above the signal line, indicating a bullish momentum; however, the histogram shows weakening bullish strength, suggesting a potential consolidation or correction before another upward movement.
    %R (Williams %R): The %R indicator is currently at -37.17, which is close to the overbought zone but still within neutral territory. If the value moves further downward, it may indicate a potential short-term correction.


    Support and Resistance Levels
    support:
    Immediate support is located at 2854 (green ascending trendline). If broken, the next key level is at 2830, a recent demand zone.
    Resistance: Major resistance remains at 2871, which aligns with the last all-time high. A breakout above this level could lead to new record highs, pushing Gold towards 2900 and beyond.


    Conclusion and Considerations
    Gold’s overall trend remains bullish, but the formation of a double-top pattern suggests that a short-term pullback is likely before another leg higher. Traders should watch the key support zones at 2854 and 2830, as a bounce from these areas could indicate a continuation of the uptrend. Meanwhile, breaking below these levels might trigger further correction. The RSI, MACD, and Parabolic SAR confirm that bullish momentum is still present, but some caution is warranted due to weakening momentum signals. The upcoming Survey of Firms' Inflation Expectations could influence the USD, thereby impacting Gold prices. If the report suggests higher inflation expectations, USD strength could push Gold lower, whereas weaker expectations could support Gold’s rally.


    Disclaimer: The analysis provided for XAU/USD is for informational purposes only and does not constitute investment advice. Traders are encouraged to perform their own analysis and research before making any trading decisions on XAUUSD. Market conditions can change quickly, so staying informed with the latest data is essential.


    FXGlory
    02.10.2025

  3. #193
    Senior Member FXGlory Ltd's Avatar
    Join Date
    Mar 2024
    Posts
    201

    Visit FXGlory Ltd's Youtube Channel
    USDJPY H4 Technical and Fundamental Analysis for 02.11.2025


    Time Zone: GMT +2
    Time Frame: 4 Hours (H4)


    Fundamental Analysis:
    The USD/JPY currency pair is influenced by the current market sentiment, economic data, and central bank policies. Today, the Japanese Yen (JPY) is expected to have low liquidity due to a Bank Holiday in Japan. This could lead to reduced volatility in the early session. However, significant movement is anticipated later due to multiple speeches from U.S. Federal Reserve (Fed) officials, including Fed Chair Jerome Powell's testimony at 5:00 PM GMT+2. PowellÂ’s comments will likely provide insights into future interest rate decisions, which could lead to increased volatility in USD-related pairs. Additionally, FOMC Members Hammack, Bowman, and Williams will speak later, adding to potential market fluctuations. Traders should closely monitor these events, as any hawkish or dovish remarks could drive significant price action in USDJPY.


    Price Action:
    The USDJPY H4 chart shows a bearish trend over the past several days. The pair recently started a weak correction phase, attempting to retrace some of its losses. The USD JPY price today is hovering near the lower Bollinger Band, indicating that selling pressure is still strong but also hinting at a possible short-term rebound. If the correction gains momentum, a test of key resistance levels is possible. However, a failure to hold recent gains could see the USD JPY pair continue its downtrend.


    Key Technical Indicators:
    Bollinger Bands: The price is near the lower Bollinger Band, signaling that the market is in a bearish trend but also suggesting a potential short-term correction. If the USD/JPY price fails to break above the middle band, the downtrend is likely to resume.
    Volume Indicator: The volume is also in a bearish trend, confirming that selling pressure remains dominant. However, there are signs that the volume may be decreasing, indicating a potential end to the correction phase soon.
    Relative Strength Index (RSI): The RSI is currently at 42.00, which means the USD-JPY is not yet in the oversold zone (below 30). This suggests that there is still room for further downside, but a potential reversal could be near if RSI moves lower and approaches oversold conditions.


    Support and Resistance:
    Support:
    Immediate support levels are identified at 150.000, 149.300, and148.500. These levels could be considered as targets for the upcoming bearish wave.
    Resistance: Resistance levels are located at 152.500, 153.000, and 153.800. Any sustained break above these levels would invalidate the bearish scenario.


    Conclusion and Consideration:
    The USDJPY H4 analysis suggests that the pair is still in a bearish phase, but a short-term correction is underway. The Bollinger Bands, RSI, and Volume indicators indicate that while selling pressure remains strong, a temporary rebound is possible. However, todayÂ’s Fed Chair PowellÂ’s speech at 5:00 PM GMT+2 and other FOMC membersÂ’ speeches could significantly impact the USD, leading to sharp price movements. Given the low liquidity from the JPY side due to the Bank Holiday, traders should be cautious of sudden volatility spikes. Traders should monitor key support and resistance levels closely and adjust their trading strategies based on upcoming Fed comments. A break below 150.750 could extend the downtrend, while a push above 152.500 might signal a stronger recovery.


    Disclaimer: The analysis provided for USD/JPY is for informational purposes only and does not constitute investment advice. Traders are encouraged to perform their own analysis and research before making any trading decisions on USDJPY. Market conditions can change quickly, so staying informed with the latest data is essential.


    FXGlory
    02.11.2025

  4. #194
    Senior Member FXGlory Ltd's Avatar
    Join Date
    Mar 2024
    Posts
    201

    Visit FXGlory Ltd's Youtube Channel
    USDCAD H4 Technical and Fundamental Chart Daily Analysis for 02.12.2025


    Time Zone: GMT +2
    Time Frame: 4 Hours (H4)


    Fundamental Analysis:
    The USDCAD currency pair may see heightened volatility today and in the coming sessions due to a series of scheduled US and Canadian economic events. On the US side, traders will look closely at upcoming Consumer Price Index (CPI) releases on March 12, 2025, as well as comments from Federal Reserve Chair Jerome Powell and other FOMC members, which can offer critical clues on the US interest rate path. Meanwhile, the Canadian Dollar (CAD) could react significantly to the Bank of Canada (BOC) Minutes release set for March 26, 2025, and crude oil inventory reports given Canada’s sizable energy sector. These factors, combined with ongoing market sentiment around inflation and economic growth, may create a catalyst for a new price direction on the USD-CAD H4 chart.


    Price Action:
    The USD/CAD chart shows that the pair has been stuck for quite some time in a range channel (as indicated by the two blue horizontal lines). A recent breakout attempt above the channel failed, and price action has since retested the lower boundary twice, hinting at building downside pressure. The red cycle line visible on the chart suggests the timing for a new directional move may be near, and the formation of consecutive bearish candles signals a rising possibility of a sustained break below the channel support. Traders should monitor how the pair behaves around this critical zone, as a confirmed break could trigger a fresh downward trend.


    Key Technical Indicators:
    Bollinger Bands: The three Bollinger Bands on the USD-CAD chart (the moving average center line, plus the upper and lower standard deviation lines) have converged closer together, indicating a period of lower volatility. Such tightening bands frequently precede a breakout move, highlighting the potential for a strong price action shift once volatility returns. The price has gravitated near the lower Band in recent sessions, reflecting a growing bearish bias. This contraction phase can end abruptly if the pair breaks convincingly below the channel support.
    Parabolic SAR: The last three Parabolic SAR dots have formed above the most recent candles, illustrating that downside momentum is beginning to dominate. When the dots remain above price bars, it typically suggests a short-term downtrend. A continuation of this pattern will reinforce bearish sentiment and further align with the notion of a pending channel breakdown. Traders often look for price and Parabolic SAR alignment to confirm momentum direction.
    RSI (Relative Strength Index): The RSI reading near 39 indicates that momentum is leaning to the downside without having reached oversold territory yet. An RSI below 50 generally reflects a bearish outlook, though there is still room for additional selling pressure before oversold conditions emerge. If RSI continues to drop, it could validate increased bearish control. Conversely, a move back above 50 might signal a swing in momentum favoring buyers.


    Support and Resistance:
    Support: Immediate support rests around the 1.4230 level, the lower boundary of the established price channel. A decisive close below this threshold could open the door toward the 1.4100 mark, which stands as the next notable support.
    Resistance: Key resistance is observed near 1.4450, aligning with the channel’s upper boundary. An additional resistance hurdle waits around 1.4700, which coincides with prior swing highs and could test bullish commitments if price surges upward.


    Conclusion and Consideration:
    The USD Vs. CAD pair appears poised for a potential breakout from its prolonged consolidation, and current technical indicators skew bearish. While a downside break remains likely given the failed attempt to breach the channel top and repeated tests of the lower boundary, major fundamental releases—such as US CPI and BOC Minutes—could inject sudden volatility and shift momentum. Traders conducting a technical and fundamental chart daily analysis for USDCAD should monitor both the market’s reaction to upcoming news and the price action around critical support and resistance levels. Caution and diligent risk management remain key, especially if a definitive channel break to the downside materializes.


    Disclaimer: The analysis provided for USD/CAD is for informational purposes only and does not constitute investment advice. Traders are encouraged to perform their own analysis and research before making any trading decisions on USDCAD. Market conditions can change quickly, so staying informed with the latest data is essential.


    FXGlory
    02.12.2025

  5. #195
    Senior Member FXGlory Ltd's Avatar
    Join Date
    Mar 2024
    Posts
    201

    Visit FXGlory Ltd's Youtube Channel
    GBPUSD H4 Technical and Fundamental Analysis for 02.13.2025


    Time Zone: GMT +2
    Time Frame: 4 Hours (H4)


    Fundamental Analysis:
    The GBPUSD pair is poised for volatility due to several key economic releases today. For the British Pound (GBP), the RICS Housing Price Balance report could influence market sentiment as it serves as an early indicator of housing inflation trends. Additionally, upcoming GDP, Construction Output, Trade Balance, and Industrial Production reports in the following days will further shape market expectations regarding the UK economy.
    On the US Dollar (USD) side, a press conference by US President Donald Trump and a speech by Federal Reserve Governor Christopher Waller about stablecoins could introduce significant market movement. Additionally, US Producer Price Index (PPI) data is scheduled, serving as a leading indicator of inflation. The combination of UK economic reports and US policy discussions may drive volatility in the GBPUSD pair, making price action highly reactive to today’s scheduled events.


    Price Action:
    On the GBPUSD H4 chart, the price has been fluctuating between Fibonacci retracement levels, indicating a mix of bullish and bearish pressure. Recently, a bullish recovery has been observed as the GBP/USD price approaches a key resistance level. The market sentiment suggests buyers are attempting to push the price higher, though a strong breakout is required to confirm further upside momentum. Candlestick formations suggest increased volatility, with recent wicks showing both buying and selling pressure.


    Key Technical Indicators:
    Bollinger Bands: The price recently touched the upper Bollinger Band and pulled back slightly, suggesting resistance at this level. Currently, the price is once again moving closer to the upper band, indicating a potential continuation of the bullish momentum. If the GBP USD price breaks above the band with high volume, it could signal an expansion in volatility and further upside movement.
    Parabolic SAR: The Parabolic SAR dots (aqua-colored) are positioned below the candles, indicating an ongoing bullish trend. The consecutive SAR dots below price action provide confirmation that buyers are in control. However, if the dots shift above the GBP-USD price, it may signal a reversal or a period of consolidation.
    MACD (Moving Average Convergence Divergence): The MACD histogram is currently positive, indicating bullish momentum. The MACD line is above the signal line, suggesting continued upward pressure. However, the momentum appears moderate, meaning traders should monitor for any signs of divergence or a bearish crossover that could indicate a potential reversal.


    Support and Resistance Levels:
    Support: The nearest support level is at 1.2340, aligning with the 61.8% Fibonacci retracement level, which has acted as a strong demand zone.
    Resistance:The key resistance level is at 1.2490, where the price has faced rejection multiple times. A breakout above this level could open the door for further upside movement.


    Conclusion and Consideration:
    The GBPUSD H4 analysis suggests bullish momentum, supported by Bollinger Bands, Parabolic SAR, and MACD indicators. However, resistance at 1.2490 remains a key hurdle for further price appreciation. With important UK and US economic data releases today, traders should expect increased volatility. A break above resistance could confirm further bullish momentum, while failure to do so may result in a pullback towards key support levels.


    Disclaimer: The analysis provided for GBP/USD is for informational purposes only and does not constitute investment advice. Traders are encouraged to perform their own analysis and research before making any trading decisions on GBPUSD. Market conditions can change quickly, so staying informed with the latest data is essential.


    FXGlory
    02.13.2025

  6. #196
    Senior Member FXGlory Ltd's Avatar
    Join Date
    Mar 2024
    Posts
    201

    Visit FXGlory Ltd's Youtube Channel
    BTCUSD H4 Technical and Fundamental Analysis for 02.17.2025


    Time Zone: GMT +2
    Time Frame: 4 Hours (H4)


    Fundamental Analysis:
    Bitcoin (BTC) is currently experiencing potential volatility due to USD-related events. The U.S. market will have low liquidity today as banks remain closed for Presidents' Day, which typically results in irregular volatility as institutional traders step aside, leaving room for speculative price swings. Additionally, speeches from Federal Reserve officials Patrick Harker and Michelle Bowman could provide insights into future U.S. monetary policy. A hawkish stance may strengthen the USD, adding bearish pressure on BTC USD, while a dovish tone could support risk assets like Bitcoin. Traders should remain cautious as thin liquidity can lead to unexpected price spikes or rapid moves in either direction.


    Price Action:
    BTCUSD on the H4 timeframe is currently experiencing a bearish move after facing resistance at the 50% Fibonacci retracement level, leading to a sharp decline that has already broken below the 61.8% Fibonacci level. The price has moved from the upper Bollinger Band to the middle band and is now trending downward toward the lower band, signaling increased bearish pressure. If the price fails to hold above key support levels, further downside movement toward the lower Bollinger Band and the next Fibonacci support zones is likely.


    Key Technical Indicators:
    Bollinger Bands: The Bollinger Bands indicate that BTCUSD has moved downward from the upper band toward the middle band and is now attempting to break lower. This suggests that selling pressure is increasing, with a potential test of the lower Bollinger Band in the coming sessions. A confirmed break below the lower band could signal further bearish continuation, while a bounce from this area might indicate temporary consolidation before the next move.
    MACD (Moving Average Convergence Divergence): The MACD histogram is showing strong bearish momentum, with the MACD line below the signal line, confirming a downside bias. The increasing separation between the MACD and signal lines suggests that selling pressure is still dominant. If the bearish momentum continues to grow, Bitcoin may extend losses toward key support levels. However, a weakening histogram could indicate that the downside move is slowing, signaling possible consolidation or reversal.
    RSI (Relative Strength Index):The RSI is currently at 45.76, reflecting bearish sentiment but not yet reaching oversold conditions. This indicates that BTC/USD still has room to move lower before a potential reversal. If the RSI drops below 30, it would signal an oversold scenario, potentially triggering a short-term price correction. Until then, the bearish outlook remains intact, with a downward trend likely to persist in the near term.


    Support and Resistance:
    Support: The nearest support level is at $94,877, with a stronger support zone at $94,177, aligning with previous key price action areas.
    Resistance: The immediate resistance level is at $97,183, with the next major resistance at $98,866, near the 50% Fibonacci retracement level.


    Conclusion and Consideration:
    BTCUSD on the H4 chart is currently in a bearish phase, as indicated by the break below the 61.8% Fibonacci level, declining MACD momentum, and RSI trending lower. The price movement from the upper Bollinger Band toward the lower band confirms the increasing selling pressure, with a high probability of further downside unless key support levels hold. With low liquidity due to the U.S. bank holiday, traders should be prepared for irregular volatility and possible sharp movements. Additionally, the upcoming speeches from Federal Reserve officials could provide unexpected market catalysts, influencing Bitcoin’s price action in correlation with USD movements. Caution is advised, and traders should employ proper risk management strategies while monitoring key levels for potential trade setups.


    Disclaimer: The analysis provided for BTC/USD is for informational purposes only and does not constitute investment advice. Traders are encouraged to perform their own analysis and research before making any trading decisions on BTCUSD. Market conditions can change quickly, so staying informed with the latest data is essential.


    FXGlory
    02.17.2025

  7. #197
    Senior Member FXGlory Ltd's Avatar
    Join Date
    Mar 2024
    Posts
    201

    Visit FXGlory Ltd's Youtube Channel
    AUDUSD H4 Technical and Fundamental Analysis for 02.19.2025


    Time Zone: GMT +2
    Time Frame: 4 Hours (H4)


    Fundamental Analysis:
    The AUD/USD currency pair is currently influenced by several key fundamental factors. The US Dollar's strength remains in focus as traders await the latest Building Permits and Housing Starts data from the US Census Bureau, which serve as leading indicators for economic activity and construction demand. A stronger-than-expected release could support the USD and apply downward pressure on AUD/USD. Meanwhile, Australia’s economic outlook is shaped by the Melbourne Institute Leading Index and the Wage Price Index, which provide insight into economic growth and inflation trends. If these indicators reflect economic resilience, the AUD could find support. Additionally, market participants will be closely monitoring RBNZ Governor Adrian Orr’s testimony, as any hawkish tone on interest rates could impact risk sentiment and commodity-linked currencies like the AUD.


    Price Action:
    On the H4 chart, AUD-USD has been in an uptrend following a Morning Star candlestick pattern at the ascending trendline support. The price has reached a key resistance level and is now undergoing a correction. This pullback could extend to Zone 1, where buyers may re-enter the market before the next upward move. The presence of higher highs and higher lows suggests that the overall trend remains bullish unless there is a confirmed break below key support.


    Key Technical Indicators:
    RSI (Relative Strength Index): The RSI is currently around 57.17, showing a possible divergence. This suggests a weakening bullish momentum, although it has not yet entered overbought conditions. A drop below 50 could indicate further downside correction.
    MACD (Moving Average Convergence Divergence): The MACD histogram is declining, and the signal line is showing signs of a potential bearish crossover. This indicates that while the bullish trend is still intact, buying momentum is decreasing, and further correction could be expected before a continuation of the uptrend.
    Stochastic Oscillator: The stochastic is currently at 38.17, pointing downward. This suggests that the price could continue to correct in the short term before finding renewed buying interest at key support levels.


    Support and Resistance:
    Support: Immediate support is located at 0.6280, which aligns with the lower boundary of the ascending trendline and a key demand zone. Another support level is found at 0.6350, marking a previous breakout zone and price consolidation area.
    Resistance: The nearest resistance level is at 0.6370, where the price is currently consolidating. If bullish momentum persists, the next major resistance level is at 0.6400, which coincides with recent highs and an important psychological barrier.


    Conclusion and Consideration:
    The AUD/USD pair on the H4 chart continues to maintain its bullish structure but faces a short-term correction phase. Traders should monitor Zone 1 for potential bullish re-entry opportunities. A break below 0.6350 could trigger further downside movement, while a breakout above 0.6370 would confirm the continuation of the uptrend. Given upcoming economic releases, volatility is expected. Traders should watch for USD strength or weakness following the US Building Permits and Housing Starts data, as well as Australian economic reports that may influence the AUD.


    Disclaimer: The analysis provided for AUDUSD is for informational purposes only and does not constitute investment advice. Traders are encouraged to perform their own analysis and research before making any trading decisions on AUD/USD. Market conditions can change quickly, so staying informed with the latest data is essential.


    FXGlory
    02.19.2025

  8. #198
    Senior Member FXGlory Ltd's Avatar
    Join Date
    Mar 2024
    Posts
    201

    Visit FXGlory Ltd's Youtube Channel
    GOLDUSD H4 Technical and Fundamental Analysis for 02.20.2025


    Time Zone: GMT +2
    Time Frame: 4 Hours (H4)


    Fundamental Analysis:
    Gold (XAU/USD) is trading near all-time highs as global market sentiment remains cautious. Today, several high-impact USD news events could influence gold prices. US President Donald Trump’s speech at the FII Priority Summit in Miami may provide insights into economic policies that could impact the dollar’s strength. Additionally, Federal Reserve Governor Philip Jefferson's speech on household balance sheets and initial jobless claims data will shape expectations for future interest rate decisions. If the Federal Reserve adopts a hawkish tone, gold could face downward pressure due to a stronger USD. Conversely, weaker jobless claims or a dovish Fed stance could support gold prices as investors seek safe-haven assets. Traders should also monitor the Philadelphia Fed Business Outlook Survey, which may offer clues about US economic conditions, further impacting gold's direction.


    Price Action:
    The GOLDUSD H4 chart exhibits a strong bullish trend, with prices moving within the upper half of the Bollinger Bands. Despite minor retracements, the price remains within an upward structure, suggesting ongoing buyer dominance. A key observation is that the recent pullback has been shallow, indicating that bulls still control the market. If the price sustains above the middle Bollinger Band, further upside movement is likely. However, a breakdown below this level may trigger a deeper correction.


    Key Technical Indicators:
    Bollinger Bands: The price is currently moving between the middle and upper bands, attempting to reach the upper band again. The overall trend remains bullish, with gold maintaining its strength after breaking multiple all-time highs (ATHs) in recent months.
    RSI (Relative Strength Index): The RSI is hovering near 59, suggesting that the market remains in bullish territory but is not yet overbought. This indicates that there is still room for further price appreciation before reaching extreme levels.
    MACD (Moving Average Convergence Divergence): The MACD histogram is expanding, with the MACD line positioned above the signal line. This suggests increasing bullish momentum, reinforcing the strength of the uptrend. However, traders should watch for potential divergence, which could indicate a slowdown in momentum.
    Stochastic Oscillator: The Stochastic indicator is currently around 42-44, moving out of the oversold region. If the %K line crosses above the %D line, it could confirm a bullish continuation, supporting a move toward higher resistance levels.


    Support and Resistance Levels:
    Support: The first key support level is at $2,920, aligning with the middle Bollinger Band and a recent price consolidation area. A break below this level could see further downside toward $2,880.
    Resistance: The immediate resistance is at $2,950, which represents the recent high and upper Bollinger Band. A breakout above this level could lead to further gains toward $2,970 and beyond.


    Conclusion and Consideration:
    Gold remains in a strong uptrend, supported by bullish technical indicators and fundamental factors. With key USD news events today, traders should expect high volatility in the gold market. If the Federal Reserve signals a hawkish stance, gold could face some selling pressure due to a stronger USD. However, if economic concerns arise or jobless claims come in weaker than expected, gold may continue its bullish rally. Traders should closely monitor XAUUSD’s price action around the $2,920 support and $2,950 resistance levels for potential breakouts or pullbacks.


    Disclaimer: The analysis provided for XAU/USD is for informational purposes only and does not constitute investment advice. Traders are encouraged to perform their own analysis and research before making any trading decisions on XAUUSD. Market conditions can change quickly, so staying informed with the latest data is essential.


    FXGlory
    02.20.2025

  9. #199
    Senior Member FXGlory Ltd's Avatar
    Join Date
    Mar 2024
    Posts
    201

    Visit FXGlory Ltd's Youtube Channel
    EURNZD H4 Technical and Fundamental Analysis for 02.24.2025


    Time Zone: GMT +2
    Time Frame: 4 Hours (H4)


    Fundamental Analysis:
    The EURNZD pair is experiencing market volatility as traders react to key economic data from both the Eurozone and New Zealand. The IFO Business Climate Index from Germany, a leading indicator of economic sentiment, is expected to provide insights into the strength of the European economy. A better-than-expected reading could boost the Euro (EUR), while a weaker-than-expected outcome may pressure the currency. Additionally, the upcoming Core CPI and CPI reports from the Eurozone will significantly impact inflation expectations and influence the European Central Bank's (ECB) monetary policy outlook.
    On the New Zealand dollar (NZD) side, recent Retail Sales and Core Retail Sales reports reflect consumer spending trends. Since these are lagging indicators, their impact may be limited unless there is a significant deviation from expectations. The Reserve Bank of New Zealand (RBNZ) continues to monitor inflationary pressures, and upcoming credit card spending data will provide further clues on consumer activity. If the data signals a robust retail environment, the NZD may gain strength.


    Price Action:
    The EURNZD pair has been in a downward channel since reaching a peak in mid-February. However, the last four candles have been bullish, indicating a potential short-term reversal or correction. The price has swiftly moved from the lower Bollinger Band to the upper band, breaking through the middle band in a single strong bullish move. Additionally, the EUR NZD price is currently testing the 50% Fibonacci retracement level, which serves as a key decision point for traders. If buyers maintain momentum, the next resistance level could be challenged. Conversely, if selling pressure resumes, the downtrend may continue.


    Key Technical Indicators:
    Bollinger Bands: The EURNZD price has moved from the lower Bollinger Band to the upper band, signaling increased volatility and a potential breakout from the bearish channel. Despite the overall downtrend, this sudden price spike suggests that bulls are regaining some control. If the price holds above the middle band, further bullish movement could be expected.
    Stochastic Oscillator (Stoch 5,3,3): The Stochastic Oscillator is currently near the 75-80 zone, indicating that momentum has shifted towards the bulls. This suggests that the EUR/NZD pair might enter overbought territory soon. However, if the %K and %D lines cross downwards from these levels, a potential pullback may occur.
    Awesome Oscillator (AO): The AO histogram has transitioned from deep red to light blue, indicating weakening bearish momentum. While the histogram remains negative, the current trend suggests that bullish pressure is increasing. If the AO crosses above the zero line, it would confirm a stronger upside move.


    Support and Resistance Levels:
    Support: The nearest support level is at 1.8180, aligning with the 23.6% Fibonacci retracement level and recent lows. If the EURNZD price breaks below this level, further downside movement could follow.
    Resistance: The immediate resistance is at 1.8290, corresponding to the 50% Fibonacci retracement level. A successful breakout above this level could lead to a test of 1.8330 (61.8% Fibonacci level).


    Conclusion and Consideration:
    The EURNZD H4 chart analysis suggests a potential short-term bullish correction within a broader downtrend channel. The recent bullish momentum, reflected in Bollinger Bands, Stochastic Oscillator, and AO, highlights a possible upside continuation if resistance levels are broken. However, traders should remain cautious as the overall trend remains bearish unless a significant breakout occurs. Key fundamental factors, including IFO Business Climate Index, CPI data from the Eurozone, and New Zealand’s retail sales, could drive volatility in the EUR-NZD pair. Traders should closely monitor these reports, as unexpected economic data could shift market sentiment rapidly.


    Disclaimer: The analysis provided for EUR/NZD is for informational purposes only and does not constitute investment advice. Traders are encouraged to perform their own analysis and research before making any trading decisions on EURNZD. Market conditions can change quickly, so staying informed with the latest data is essential.


    FXGlory
    02.24.2025

  10. #200
    Senior Member FXGlory Ltd's Avatar
    Join Date
    Mar 2024
    Posts
    201

    Visit FXGlory Ltd's Youtube Channel
    USDJPY H4 Technical and Fundamental Analysis for 02.25.2025


    Time Zone: GMT +2
    Time Frame: 4 Hours (H4)


    Fundamental Analysis:
    The USD/JPY pair is expected to experience volatility today due to multiple speeches from Federal Reserve (FOMC) officials. Chicago Fed President Austan Goolsbee and Dallas Fed President Lorie Logan will speak on economic conditions, potentially providing insights into future monetary policy. If their tone is hawkish, the USD could strengthen, putting upward pressure on the USD-JPY pair. Additionally, key US data, including housing prices and consumer confidence figures, could influence market sentiment. On the Japanese Yen side, the Bank of Japan (BoJ) has released the Corporate Services Price Index (CSPI), an important inflation indicator. Stronger-than-expected data may lead to JPY appreciation, reinforcing the bearish trend in USD vs JPY. However, if the data is weak, expectations of continued BoJ dovish policy could weaken the yen. Traders should remain cautious as market volatility is likely to increase throughout the session.


    Price Action:
    The USDJPY pair continues to trade within a strong downtrend. The price is currently testing a key support zone at 149.300 - 148.800, which has historically provided significant buying interest. The recent price action suggests an attempt at a bounce, but Resistance Line 1 (150.500 - 150.800) is capping the upside. If the price fails to break above Resistance Line 1, further downside pressure could push the pair below 148.800, confirming a continuation of the bearish trend. However, if buyers gain control and break through Resistance Line 1, the next key level to watch is Resistance Line 2 (152.800), which aligns with the long-term descending trendline. Should the price successfully breach both resistance levels, upside targets include FE 61.8% at 152.900 and FE 100% at 153.800. Until a confirmed breakout occurs, the trend remains bearish.


    Key Technical Indicators:
    Parabolic SAR: The last three dots are below the price, signaling a potential shift in momentum toward the upside. However, a break above Resistance Line 1 is necessary to confirm a reversal.
    Relative Strength Index (RSI): The RSI is currently at 39.93, indicating that the pair remains in bearish territory. Although it is not yet oversold, a move above 50 would suggest a weakening downtrend and potential bullish momentum.
    MACD (Moving Average Convergence Divergence): The MACD histogram remains negative, and the MACD line is below the signal line, confirming that bearish momentum is still in play. A bullish crossover is needed for signs of trend reversal.
    Stochastic Oscillator: The Stochastic Oscillator is at 81.27, placing it in the overbought zone. This suggests that the recent price bounce may be short-lived and that further selling pressure could emerge. A bearish crossover would reinforce the downtrend.


    Support and Resistance:
    Support: Immediate support is located at 149.300 - 148.800, which represents a significant historical level. If this zone fails to hold, the next key support is 148.315, potentially triggering further downside movement.
    Resistance: The nearest resistance level is at 150.500 - 150.800 (Resistance Line 1), a key short-term barrier. A break above this level would indicate bullish momentum. The next major resistance is at 152.800 (Resistance Line 2), which must be breached for a full trend reversal. Additional upside targets include FE 61.8% at 152.900 and FE 100% at 53.800.


    Conclusion and Consideration:
    The USD/JPY pair remains in a strong downtrend, currently testing a crucial support zone at 149.300 - 148.800. If the price fails to break above Resistance Line 1 (150.500 - 150.800), the bearish trend is likely to continue, potentially pushing the price below 148.800. However, if buyers manage to break above Resistance Line 1, a short-term recovery could be in play, with the next major test at Resistance Line 2 (152.800). With multiple FOMC speeches and key US economic releases scheduled today, traders should prepare for potential market volatility. A hawkish Fed stance could strengthen the USD, while strong JPY fundamentals could keep the pair under selling pressure. Monitoring RSI, MACD, and support/resistance levels will be crucial for confirming the next move.


    Disclaimer: The analysis provided for USD/JPY is for informational purposes only and does not constitute investment advice. Traders are encouraged to perform their own analysis and research before making any trading decisions on USDJPY. Market conditions can change quickly, so staying informed with the latest data is essential.


    FXGlory
    02.25.2025

Page 20 of 20 FirstFirst ... 10 18 19 20

Bookmarks

Posting Permissions

  • You may not post new threads
  • You may not post replies
  • You may not post attachments
  • You may not edit your posts
  •