 12Likes
 LinkBack URL
 About LinkBacks


Everything which is related to Guppy Moving Average please post here.

This is a discussion on Guppy Moving Average within the Trading tools forums, part of the Trading Forum category; Everything which is related to Guppy Moving Average please post here....
Everything which is related to Guppy Moving Average please post here.

THE GMMA BASIC APPLICATION
INDICATOR BUILDER
GUPPY MULTIPLE MOVING AVERAGES
These are two groups of exponential moving averages. The short term group is a 3, 5, 8, 10, 12 and 15 day moving averages. This is a proxy for the behaviour of short term traders and speculators in the market.
The long term group is made up of 30, 35, 40, 45, 50 and 60 day moving averages. This is a proxy for the long term investors in the market.
The relationship within each of these groups tells us when there is agreement on value - when they are close together - and when there is disagreement on value - when they are well spaced apart.
The relationship between the two groups tells the trader about the strength of the market action. A change in price direction that is well supported by both short and long term investors signals a strong trading opportunity. The crossover of the two groups of moving averages is not as important as the relationship between them.
When both groups compress at the same time it alerts the trader to increased price volatility and the potential for good trading opportunities.
==============
The Guppy Multiple Moving Average (GMMA) is an indicator that tracks the inferred activity of the two major groups in the market. These are investors and traders. Traders are always probing for a change in the trend. In a downtrend they will take a trade in anticipation of a new up trend developing. If it does not develop, then they get out of the trade quickly. If the trend does change, then they stay with the trade, but continue to use a short term management approach. No matter how long the up trend remains in place, the trader is always alert for a potential trend change. Often they use a volatility based indicator like the count back line, or a short term 10 day moving average, to help identify the exit conditions. The traders focus is on not losing money. This means he avoids losing trading capital when the trade first starts, and later he avoids losing too much of open profits as the trade moves into success.
We track their inferred activity by using a group of short term moving averages. These are 3, 5, 8, 10, 12 and 15 day exponentially calculated moving averages. We select this combination because three days is about half a trading week. Five days is one trading week. Eight days is about a week and a half.
The traders always lead the change in trend. Their buying pushes prices up in anticipation of a trend change. The only way the trend can survive is if other buyers also come into the market. Strong trends are supported by long term investors. These are the true gamblers in the market because they tend to have a great deal of faith in their analysis. They just know they are right, and it takes a lot to convince them otherwise. When they buy a stock they invest money, their emotions, their reputation and their ego. They simply do not like to admit to a mistake. This may sound overstated, but think for a moment about your investment in AMP or TLS. If purchased several years ago these are both losing investments yet they remain in many portfolios and perhaps in yours.
The investor takes more time to recognize the change in a trend. He follows the lead set by traders. We track the investors inferred activity by using a 30, 35, 40, 45, 50 and 60 day exponentially calculated moving average. Each average is increased by one week. We jump two weeks from 50 to 60 days in the final series because we originally used the 60 day average as a check point.
This reflects the original development of this indicator where our focus was on the way a moving average crossover delivered information about agreement on value and price over multiple time frames. Over the years we have moved beyond this interpretation and application of the indicator. In the notes over the coming weeks we will show how this has developed.
Our starting point was the lag that existed between the time of a genuine trend break and the time that a moving average cross over entry signal was generated. Our focus was on the change from a downtrend to an up trend. Our preferred early warning tool was the straight edge trend line which is simple to use and quite accurate. The problem with using a single straight edge trend line was that some breakouts were false. The straight edge trend line provided no way to separate the false from the genuine.
On the other hand, the moving average crossover based on a 10 and 30 day calculation, provided a higher level of certainty that the trend break was genuine. However the disadvantage was that the crossover signal might come many days after the initial trend break signal. This time lag was further extended because the signal was based on end of day prices. We see the exact cross over today, and if we were courageous, we could enter tomorrow. Generally traders waited for another day to verify that the crossover had actually taken place which delayed the entry until 2 days after the actual crossover. This time lag meant that price had often moved up considerably by the time the trade was opened.
The standard solution called for a combination of short term moving averages to move the crossover point further back in time so that it was closer to the breakout signaled by a close above the straight edge trend line. The drawback was that the shorter the moving average, the less reliable it became. In plotting multiple moving averages on a single chart display four significant features emerged.
They were:
- A repeated pattern of compression and expansion in a group of six short term averages.
- The behavior was fractally repeated across different time frames. These short and long term groups were useful in understanding the inferred behavior of traders and investors.
- The degree of separation within groups and between groups provides a method of understanding the nature of the trend and trend change.
- The synchronicity was independent of the length of the individual moving averages. That is, at major trend turning points compression occurred across both long and short term groups and this provided early validation of signals generated by the straight edge trend line.
- The relationship between moving averages and price was better understood as a relationship between value and price. The crossover of two moving averages represented an agreement on value over two different time frames. In a continuous open auction which is the mechanism of the market, agreement on price and value was transient and temporary. Such agreement often preceded substantial changes in the direction of the trend. The GMMA became a tool for identifying the probability of trend development.
These broad relationships, and the more advanced relationships used with the GMMA are summarized in the chart. Over the following series of articles we will examine the identification and application of each of these relationships.
This is the most straightforward application of the GMMA and it worked well with V shaped trend changes. It was not about taking the lag out of the moving average calculation. It is about validating a prior trend break signal by examining the relationship between price and value. Once the initial trend break signal is validated by the GMMA the trader is able to enter a breakout trade with a higher level of confidence.
The CBA chart shows the classic application of the GMMA. We start with the breakout above the straight edge trend line. The vertical line shows the decision point on the day of the breakout. We need to be sure that this breakout is for real and likely to continue upwards. After several months in a downtrend the initial breakout sometimes fails and develops as shown by the thick black line. This signals a change in the nature of the trend line from a resistance function prior to the breakout to a support function after the breakout.
The GMMA is used to assess the probability that the trend break shown by the straight edge trend line is genuine. We start by observing the activity of the short term group. This tells us how traders are thinking. In area A we see a compression of the averages. This suggests that traders have reached an agreement on price and value. The price of CBA has been driven so low that many traders now believe it is worth more than the current traded price. The only way they can take advantage of this cheap price is to buy stock. Unfortunately many other short term traders have reached the same conclusion. They also want to buy at this price. A bidding war erupts. Traders who believe they are missing out on the opportunity outbid their competitors to ensure they get a position in the stock at favorable prices.
The compression of these averages shows agreement about price and value. The expansion of the group shows that traders are excited about the future prospects of increased value even though prices are still rising. These traders buy in anticipation of a trend change. They are probing for a trend change.
We use the straight edge trend line to signal an increased probability of a trend change. When this signal is generated we observe this change in direction and separation in the short term group of averages. We know traders believe this stock has a future. We want confirmation that the long term investors are also buying this confidence.
The long term group of averages, at the decision point, is showing signs of compression and the beginning of a change in direction. Notice how quickly the compression starts and the decisive change in direction. This is despite the longest average of 60 days which we would normally expect to lag well behind any trend change. This compression in the long term group is evidence of the synchronicity relationship that makes the GMMA so useful.
This compression and change in direction tells us that there is an increased probability that the change in trend direction is for real it is sustainable. This encourages us to buy the stock soon after the decision point shown.
The GMMA picks up a seismic shift in the markets sentiment as it happens, even though we are using a 60 day moving average.. Later we will look at how this indicator is used to develop reliable advance signals of this change. This compression and eventual crossover within the long term group takes place in area B. The trend change is confirmed. The agreement amongst investors about price and value cannot last. Where there is agreement some people see opportunity. There are many investors who will have missed out on joining the trend change prior to area B. Now the change is confirmed they want to get part of the action. Generally investors move larger funds than traders. Their activity in the market has a larger impact.
The latecomers can only buy stock if they outbid their competitors. The stronger the initial trend, the more pressure there is to get an early position. This increased bidding supports the trend. This is shown by the way the long term group continue to move up, and by the way the long term group of averages separates. The wider the spread the more powerful the underlying trend.
Even the traders retain faith in this tend change. The sell off that takes place in area C is not very strong. The group of short term averages dips towards the long term group and then bounces away quickly. The long term group of averages show that investors take this opportunity to buy stock at temporarily wakened prices. Although the long term group falters out at this point, the degree of separation remains relatively constant and this confirms the strength of the emerging trend.
The temporary collapse of the short term group comes after a 12% appreciation in price. Short term traders exit the trade taking short term profits at this level of return and this is reflected by the compression and collapse of the short term group of averages. As long term investors step into the market and buy CBA at these weakened prices, traders sense that the trend is well supported. Their activity takes off, and the short term group of averages rebounds, separates, and then run parallel to the long term group as the trend continues.
The GMMA identifies a significant change in the markets opinion about CBA. The compression of the short term and long term groups validates the trend break signal generated by a close above the straight edge trend line. Using this basic application of the GMMA, the trader has the confidence necessary to buy CBA at, or just after the decision points shown on the chart extract.
Using this straightforward application of the GMMA also kept traders out of false breakouts. The straight edge trend line provides the first indication that a downtrend may be turning to an up trend. The CSL chart shows two examples of a false break from a straight edge trend line. We start with decision point A. The steep downtrend is clearly broken by a close above the trend line. If this is a genuine trend break then we have the opportunity to get in early well before any moving average crossover signal.
This trend break collapses quickly. If we had first observed this chart near decision point B then we may have chosen to plot the second trend line as shown. This plot takes advantage of the information on the chart. We know the first break was false, and by taking this into account we set the second trend line plot. Can this trend break be relied upon? If we are right we get to ride a new up trend. If we are wrong we stand to lose money if we stay with a continuation of the downtrend. The straight edge trend line by itself does not provide enough information to make a good decision.
When we apply the GMMA we get a getter idea of the probability of the trend line break actually being the start of a new up trend. The key relationship is the level of separation in the long term group of averages, and trend direction they are traveling. At both decision point A and decision point B the long term group is well separated. Investors do not like this stock. Every time there is a rise in prices they take advantage of this to sell. Their selling overwhelms the market and drives prices down so the downtrend continues.
The degree of separation between the two groups of moving averages also makes it more difficult for either of the rallies to successfully change the direction of the trend. The most likely outcome is a weak rally followed by a collapse and continuation of the down trend. This observation keeps the trader, and the investor, out of CSL.
Looking forward we do see a convergence between the short term group of averages and the long term group of averages. Additionally the long term group begins to narrow down, suggesting a developing level of agreement about price and value amongst investors in April and May. In late March the 10 day moving average closes above the 30 day moving average, generating a classic moving average buy signal.
Using the GMMA we ignore this signal and the other GMMA convergence relationships. This decision is based on a more advanced understanding of the relationships revealed by the GMMA and we will examine these strategies in
Last edited by TechnoMeter; 07-15-2013 at 06:58 PM.

THE GMMA – TRADING THE BREAKOUT
The Guppy Multiple Moving Average (GMMA) indicator was first mentioned in Trading Tactics in 1997. Since then the use and application of the indicator has been refined. In response to requests from readers, this series of notes brings together these modifications and improvements.
Aggressive traders attempt to identify a change in the downtrend – an up trend breakout – as soon as it happens, or even before it happens. This is aggressive trading because it carries a higher level of failure. Unless the trader has excellent trading discipline there is the danger of holding onto a stock as it continues to go down in the hope that it will eventually rebound.
A more common, and in some ways, safer approach, is to trade the trend breakout in the days or weeks after it has happened. This does reduce profits when compared with an earlier entry, but this reduction is counterbalanced by the increased probability that the trend break will develop into a sustainable new trend. Few traders are content with joining these trends at any price point. Most try to get the best entry possible, based on a pullback in price. If we understand the nature of the trend and the breakout using the techniques discussed last week, then we can take advantage of these points of price weakness because we are confident in our analysis of the developing trend.
The GMMA is applied in real time to assess the best entry opportunities after the breakout is confirmed. It
gives us an answer to the question: Is this price collapse part of a general new trend collapse, or an entry opportunity? This is a significant question because young trends are weak. There is a higher probability of trend collapse.
Breakouts come in two important formats. The most common is the “V” shaped breakout where a clear downtrend develops into a clear up trend. This is clear retrospectively, although at the time the process can be frightening and many traders delay the entry because they are worried about a trend collapse.
The less common is a breakout from a trading range, or a prolonged sideways movement. This is an important characteristic of bear market recoveries and it presented a common pattern in the first months of 2003. It also applied to stocks that have been locked in a downtrend for extended periods. These rarely bounce in a “V” recovery. Instead they drift sideways for months. When they do break out they can deliver very attractive profits. We start with this pattern.
In assessing the GMMA relationships in breakout trades we consider four relationships. The first two apply to the longer term group of averages, and the second group to the short term group of averages. We look for:
- Compression. Early in the breakout the long term group compresses as investors reach agreement on the value of the stock.
- Direction. Compression indicates agreement. The direction of the compression provides clues to the future development of the trend. We look for compression and an upwards bias.
- Collapse. It takes a lot of effort to break out of a downtrend. These rallies are short lived, and we expect them to collapse. The nature of the collapse in the short term group provides clues to the strength of trader activity.
- Rapid bounce. A fast bounce and recovery in the short term group confirms increased trading activity and this forces interested investors to bid higher to get stock.
The APE bar chart highlights the problems we face in many breakout trades. First, we probably missed the initial breakout. By the time it shows up on a once a week search of the database, the initial opportunity has passed. We leave it on our watch list to see how it behaves when prices collapse after the initial rally. At the decision point shown we need to decide on the probability of a bounce occurring. Get this correct and we can trade from around $5.40 to $6.10 or even higher if a full trend develops.
The GMMA indicator help us to make a better decision at the decision point shown by the vertical line. We start with the analysis of the long term group. No trend can survive without buying support from long term investors. We may intend to take a trading approach to this opportunity, but unless investors are there to lend a helping hand, we do not get the opportunity to join a prolonged trend.
Compression is an easy question to answer. Already the long term group is well separated. It shows no sign of compression in response to the drop in prices seen on the bar chart and shown here by the collapse of the short term group of averages.
The direction of the long term group is still upwards, even though the speed of the rise has slowed slightly. The compression and direction suggest this trend has strength so we can trade with increased confidence and take advantage of this temporary low in prices.
This analysis is confirmed when we turn our attention to the short term group. Trader activity always leads investor activity as traders probe for weakness in down trends, and test the strength of up trends. This has been a orderly collapse in prices. Traders are not panicked. It does not take long before new traders come into the market and start buying. They see the fall in prices as an opportunity rather than an alert signal to abandon a weak trend. The period of compression and agreement is short, and the expansion starts quickly.
If we choose to wait a few days, the rapid compression that precedes a rapid bounce is revealed. At this decision point many traders will buy APE in anticipation of this type of rebound because the first three factors – compression, direction and collapse – are consistent with a breakout developing into a longer term trend.
This conclusion does beg the question of how we decide that this is a real breakout from the sideways pattern. The answer comes from the comparison of area A and area B. We start with the pullback in the short term group. In area A this pullback never develops into a rebound. In area B, the degree of pullback is smaller, and the pullback quickly develops into a rebound that carries the short term group to new highs.
This is further confirmed by the long term group. In area A this group does not get a chance to separate. They do not expand. At the time of the pullback in the short term group, the long term group is just a thick red line. Compare this with the pullback relationship in area B. The long term group is well separated and clearly moving upwards.
This analysis confirms the breakout spike to $6.10 shown on the bar chart has a higher probability of becoming part of a broad up trend development rather than just a temporary rally or spike.
It is easier to apply GMMA analysis to the classic “V” shaped trend breakout where a downtrend quickly develops into a new up trend. The danger in these young trends is that the breakout may turn out to be just a short lived rally. Our fears are confirmed when the breakout falters and prices dip back from the initial highs. Is this a buy point, or an exit signal?
In a classic, text book example of the “V” shaped trend reversal this question does not arise. Price simply clearly change direction, and do not look back. There is no point in waiting for a price pullback, or a rally collapse so it is important to recognize these breakout characteristics early. We can reach some initial conclusions at the decision point shown. Wait a week or so, and the conclusions are clearly confirmed.
The key is the behavior of the long term group. They have gone from separated and down to compressed and up. The direction of the long term group has changed rapidly. Remember that the longest average in this group is a 60 day calculation. Yet by the time of the decision point all the long term group of averages have turned up. This is an early confirmation of the trend break and of the strength of the trend. You cannot get this type of information from any other indicator, and certainly not from just two moving averages using a crossover signal.
The long term group has also compressed and this tells us that the investors are in agreement about the value of the stock. They are not waiting for a pullback before taking action. They are worried they are going to miss out, so they are aggressively starting to outbid each other to establish a position.
Traders see this and they choose not to sell. Look at the character of the short term group of averages. They compress a few days before the decision point line, and then move upwards and spread out quickly. There is a lot of steady buying activity here. Compare this relationship with area C on the APE GMMA display. We are being aggressive at this decision point, but the nature of this expansion suggests strong trader and investor support. When traders come to sell, there are other traders who are prepared to buy at these prices. They are not waiting for a price pullback to get an entry. As a result there is no compression in the short term group. They quickly move into a parallel relationship. The circled area A is further confirmation of this. See this pattern and you know you have no choice but to take the current price if you want to join this robust trend.
Most time a trend breakout follows a series of attempted breakouts – the rally and retreat behavior discussed last week. When the breakout develops we see a pattern of rallies and retreats and rebounds. The FFL chart illustrates how these occur and shows how we apply GMMA analysis to make a better judgment about the advisability of an entry at decision point 1 and 2. Although we are cautious in applying the GMMA as a means of anticipating a trend break, the FFL display shows how this can be achieved.
The bar chart shows a downtrend defined by the straight edge trend line. Prices have consistently moved up to the line, and then dropped down. This pattern of rise and retreat has defined the downtrend so there is no obvious reason why we would be interested in decision point 1. There has been no break above the trend line. Decision point 2 which follows the collapse of the initial breakout rally is the more traditional application of the GMMA to breakout trading. Our concern is that if we buy in this area that prices may drop to the trend line, rebound, then retreat to the trend line again as shown by the thick red line. We use the GMMA to decide whether this is a likely outcome, or if prices are likely to rebound in a new up trend as shown by the thicker blue line.
The GMMA provides answers to both decision points. The key analysis that favors an entry at decision point one starts with the long term group of averages. Traders need investors, so we need to understand their behavior. We start with the compression and directional behavior shown in the area circled. The long term group is beginning to compress. Some investors are beginning to think that FFL has a brighter future. Compression tells us that investors are not taking advantage of temporarily higher prices to sell. It tells us they are beginning to buy as prices rise. Some of them are beginning to worry that they might miss out on an opportunity.
Their action is most likely driven by fundamental analysis. We do not need to read their analysis to know that it is bullish because the direction of the compression is upwards. This is a bullish signal in a downtrend from the most conservative market participants.
Shift our attention to the trader activity and it is the rally collapse and rebound behavior that attracts our interest. This is not a sharp rally. The collapse does not resemble that shown in area A. This is a slower decline. Traders are not in a rush to take profits.
The short term group does slip below the long term group, and then it rebounds as shown by the rapid compression. There is a lot of excitement here as traders jostle each other to buy stock. They believe FFL is going to lift.
And the investors also believe this. The long term group continues to compress and the direction is up, even after the minor stumble in late May. This is a very bullish environment. Aggressive traders have no hesitation in buying at decision point 1 because of the developing investor activity. Traders lead the way, but we only follow when investors are showing increased willingness to become buyers. This GMMA analysis signal leads the price break above the trend line by several days.
The FFL bar chart presents a different set of problems at decision point 2. We have the opportunity to join a developing trend at a point of price weakness. We have to know that this is not a point of trend weakness. The important relationship is shown by the long term group. The group is not compressed. The wide spread that developed at the top of this initial rise is largely maintained as the long term group begins to turn down slightly. This degree of spread is also maintained as we move beyond decision point 2.
The underlying feature of the GMMA is the compression and expansion relationship. Compression shows agreement. Expansion shows disagreement. If the long term group turned down, and began to compress we would infer that investors are selling. When the long term group slows, move sideways, or takes a slight dip and remains well separated then we infer that investors are still buying stock. They are not fools. They will not pay more than they have to, so as prices dip, driven by trader selling, the investors do not have to pay as much to buy. In unison, they lower their bid prices and we see a dip in the long term group but the averages remain parallel with each other.
It is the move towards compression which shows some investors are selling into the price rise, and selling into the price dip, that is a cause for concern. This does not happen at decision point 2.
The direction of the long term group is not down. This is certainly a pause, and a broad move sideways, but it is not a reversal. We can be confident this trend is intact, and strong.
Knowing the ground is firm underfoot. We can then turn to understanding how traders are reacting. The price collapse is sudden, but so is the rebound. There is a significant gap between the 3 and 5 day averages and the rest of the averages in the short term average group. Short term traders have sold down the stock aggressively, but those with a slightly longer time frame are not so eager to sell. The most aggressive sellers dip into the long term group of averages, but the least aggressive see the price dip as a buying opportunity. The rebound starts quickly as the shorter averages turn up in a scramble to buy back into the stock.
A successful breakout quickly drags the long term investors with it. This group separates rapidly and does not react significantly to the inevitable breakout rally collapse. It is this relationship that confirms that decision point 2 is a safe entry point and that there is a strong probability that this new up trend will continue.

Another Look at Multiple Moving Averages
Heres an example of Guppys Multiple Moving Averages (MMAs) in action. Below is the NASDAQ daily chart for the last 12 months. The long term group of MMAs is in orange and the short term group is green. Note how the short term group tends to bounce off of the long term group when the long term group is well spread. Its not until the long term group starts to converge that the short term group can slip under the long term group, like what happened in February and March. You can also see how proximity to the lower Bollinger Band (blue) was also a buy signal while the long term group was spread out.
One thing that I like about MMAs is that you can make the actual price chart invisible and still see whats going on:
That chart should really give you an idea of how the two groups play off of each other. You can also see how reversals in the short term group are marked by the shortest term average getting too far away from the rest of the group (Guppy calls those areas bubbles). Then the long term group tends to exert a gravitational pull of sorts.
As long as the long term group is showing a strong trend its generally pretty easy to find good reward/risk trades. You just wait for the short term group to try to push its way through the long term group, then trade in the direction of the long term group once the short term group begins to get repelled. Alternately, you could make trades against the long term trend once the short term group becomes bubblicious. Those bubble areas are also places to take and/or protect profits.

Two GUPPY indicators

CryoxMMA

Guppy MACD by cja (this is his website with some free indicators for example).
============
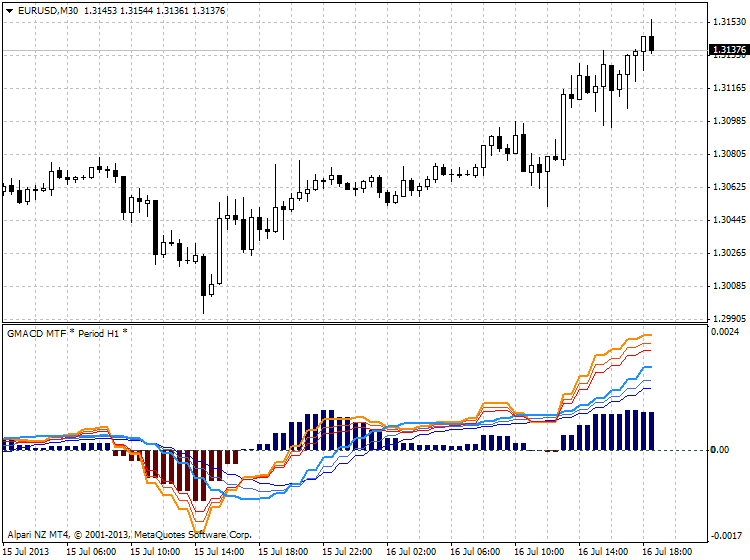
G#MACD MTF Alerts indicator :
G#MACD MTF Alerts v1 indicator :1st update for GMACD for some time, it is now MTF and has built in Alerts
This version Alerts on the Candle CLOSE
As requested by some of the traders using GMACD i have recoded the Alert to respond quicker.
This version Alerts the moment the Lines Cross however can be prone to more false signals

This is GMMA indicator for Metatrader 5 - go to MT5 CodeBase here to download
Daryl Guppy is a professional trader and author of "Trend Trading", "Trading Tactics" and "Better Stock Trading: Money and Risk Management". He leads seminars on trading in Australia, Asia, China and USA. Guppy Multiple Moving Average (GMMA) is an indicator based on the relationships between groups of moving averages. Each group of moving averages in GMMA indicator provides insight into the behavior of two dominant market groups - traders and investors. This indicator allows a trader to understand market relationships shown on the chart and thus choose the most appropriate trading methods and tools. GMMA indicator is designed to understand the nature of the trend movement on a daily or intraday basis.
Implied traders activity is tracked by using a group of short-term moving averages. Traders always start a trend change. Their actions push prices upwards in anticipation of a trend change from downward to upward one. Their activity is displayed in a group of 3-, 5-, 8-, 10-, 12- and 15-period exponential moving averages. The trend continues, only if other buyers also enter the market. Strong trends are supported by long-term investors. Investors require more time to recognize a trend change, but they always follow the traders. We track the implied investors activity, using a group of long-term moving averages. This group includes 30-, 35-, 40-, 45-, 50- and 60-period exponential moving averages.
GMMA indicator used in six trading situations:
- Standard trend breakouts;
- Joining the trend;
- Using price weakness;
- Rally and trend brekout;
- Choosing the best output;
- Trading bubbles.
Smoothing algorithms can be selected out of ten possible versions:
- SMA - simple moving average;
- EMA - exponential moving average;
- SMMA - smoothed moving average;
- LWMA - linear weighted moving average;
- JJMA - JMA adaptive average;
- JurX - ultralinear smoothing;
- ParMA - parabolic smoothing;
- T3 - Tillson's multiple exponential smoothing;
- VIDYA - smoothing with the use of Tushar Chande's algorithm;
- AMA - smoothing with the use of Perry Kaufman's algorithm.
Premium Trading Forum: subscription, public discussion and latest news
Trading Forum wiki || MQL5 channel for the forum
Trading blogs || My blog


I guess we can use the allaverages way to code a terrific GMMA indicator? I'm curious what's look like if we use a faster MA(such as HULL) for guppy fast MA group ,and use more stable MA for the guppy slow MA group. What do you think, ND + Igorad?
yes, may be ... if Igorad can do it so we can test
Premium Trading Forum: subscription, public discussion and latest news
Trading Forum wiki || MQL5 channel for the forum
Trading blogs || My blog


 Reply With Quote


Bookmarks