 27Likes
 LinkBack URL
 About LinkBacks
Hi,
Please take a look at the indicator PsyLevels_v2 which has ability to plot Bounce and Breakout signals with advanced sound box alerts.
Regards,
Igor

This is a discussion on Psychological Levels within the Trading tools forums, part of the Trading Forum category; Hi, Please take a look at the indicator PsyLevels_v2 which has ability to plot Bounce and Breakout signals with advanced ...

Hi,
Please take a look at the indicator PsyLevels_v2 which has ability to plot Bounce and Breakout signals with advanced sound box alerts.
Regards,
Igor

Thanks Igorad.
How those levels were calculated?
Definiton from Wikipedia:How those levels were calculated?
In finance, psychological level, is a price level in technical analysis that significantly affects the price of an underlying security, commodity or a derivative. Typically, the number is something that is "easy to remember," such as a rounded-off number. When a specific security, commodity, or derivative reaches such a price, financial market participants (traders, market makers, brokers, investors, etc.) tend to act on their positions (buy, sell or hold).
Thanks a lot. I updated this thread for new indicator trading forum wiki

Trading Psychological Whole Numbers :
There are many different ways of looking at support and resistance, with few as compelling as the study of ‘psychological whole numbers'.
If you’ve been trading on charts for long enough, you’ve surely noticed the odd behavior that prices will have a tendency to exhibit when a ‘round’ number (prices such as .9900 or .9800 on AUDUSD) is seen. Below is a picture of the Aussie-Dollar’s recent struggle to get over the ‘parity’ level.
As you may know, parity is the price of 1.0000 on AUDUSD; or to put it another way – this is when One Australian Dollar is worth One US Dollar.
Things get weird at this exchange rate.
As human beings, we have a tendency to value simplicity, and our own internal psychology plays a large role with the odd price behaviors that may be exhibited at these ‘psychological levels.’
Let’s walk through a simple example:
If someone were to ask you how much you spent on your computer, you’d likely respond with an amount rounded to the nearest hundred (‘ah, about $800,’ or ‘I paid $900.’) Sure, you can give an exact answer like Six-hundred-and-thirty-nine dollars and ninety-six cents; but that doesn’t really make any sense. If I had asked the question, I probably don’t care about the $39.96; I just wanted a ballpark idea for how much you paid for the computer.
Out of simplicity, most people (most of the time) will automatically round to the nearest whole number.
This happens in trading too.
Traders looking to sell the AUDUSD currency pair place a stop at an even 1.0000; not imagining that the price might come into play shortly thereafter.
What are the whole numbers?
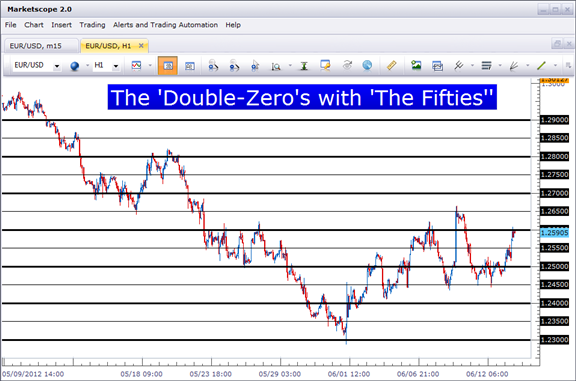
Traders will often call these whole number intervals ‘double-zeros,’ as these prices are at even numbers such as 1.31000 on EURUSD, 1.57000 on GBPUSD or 132.00 on GBPJPY. The chart below will identify the ‘Double-Zero’s’ on the current EURUSD chart.

Some traders will even take this a step further by looking at the number directly in the middle of these whole numbers or ‘the fifties.’ These levels, such as 1.31500 on EURUSD or 131.50 on GBPJPY can often come into play in the same manner as the ‘double-zeros.’
One look at any chart will notice that there will often be some element of congestion at these levels as prices move up or down. The chart below illustrates EURUSD with ‘double-zeros’ and ‘fifties’ denoted:
Notice that many of the price swings on the above chart take place around one of these levels. This is why we want to incorporate these levels into our support and resistance studies.
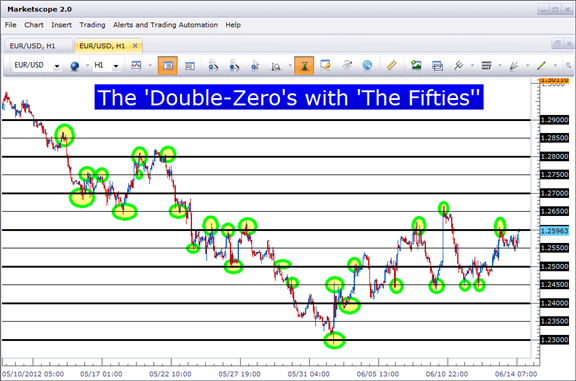
Now let’s look at the same chart, with some of these swings identified:
This is why these prices can work so well as support and resistance. Because people (traders) watch, and care about these prices. Not every one of these prices are going to function as support or resistance, but enough do that these levels warrant the trader’s attention.
Why do Psychological Levels Work?
Psychological Support and Resistance often works because of the very fact that we looked at to start this article. As human beings, we value simplicity; we think in whole numbers – and often, when placing stops or limits, we use these prices.
These stops and limits can massively alter order flow and price changes. Let’s use the EURUSD as a current example, as price recently made a large move down around the news and events of the European Debt Crisis. On the chart below, I’ve marked 3 strong inflections off of the 1.3000 neighborhood:
Each time price approached 1.3000, the currency pair bounced back up. This can be explained for a few reasons. Perhaps traders saw the price of 1.3000 and thought ‘whoa, that is way too cheap. I’m going to buy some Euro’s.’
Or, more likely, as traders were opening short positions, they set profit targets at an even 1.3000, so that when that price was hit – they had a pending order to ‘buy to cover.’ This profit target order to close their position created demand in the market (they were buying to cover, and this buying interest is considered ‘demand’).
After the first inflection, traders may not have been extremely bullish on the prospect of pushing price much lower than 1.3000. After all, this price has already been exhibited as support.
In many ways, untested ‘psychological’ levels can be looked at like pivot points. An area where there may be some element of support or resistance, but unfortunately it is impossible to tell until after the fact.
In general, round numbers such as 1.30000 on EURUSD or 1.0000 on AUDUSD or USDCAD will garner more attention than a more pedestrian level like 1.31000 on EURUSD; so many traders will often assign a higher degree of strength to the more rounded-intervals.
Where traders can really find value with these levels is when prices may have resisted or been supported there in the past. This tells the trader that others are noticing and acting on those prices, and the potential for the ‘self-fulfilling prophecy’ of technical analysis may potentially be considered with more strength.
--- Written by James B. Stanley

This is Scalping Psy Level Strategy found here. Author - Patrick Bourgeois (the text/description made by author). Indicators are attached.
Scalping Psy Level Strategy
This is a very powerful winning strategy!!! We only use psychological levels to enter our trades. One of the main rules is NEVER TRADE AGAINST THE H1 CANDLE COLOR. Levels are on the screen every 00, 25, 50, 75, 00.
Another rule is: If H1 and D1 candle color are the same get ready to make more pips. If the colors do not agree be aware that a lot of times you just can grab a few pips (be happy with 5). This is a scalping strategy.
You are not allowed to enter twice in 1 hour. This is to prevent you from overtrading. Remember you only need 2% a day to get rich in the future all the rest is fun but can be greedy.
For MT4 traders i insert my money management rules, the psychological indicator, the 1h candle color overlay and the multi candle color indicator. If you like to trade the 5min chart you can see on the same screen what is going on on the higher tmfs.
Here is a screenshot from the trading method. The above rules are very important to make it succeed so stick to it.
Premium Trading Forum: subscription, public discussion and latest news
Trading Forum wiki || MQL5 channel for the forum
Trading blogs || My blog

If we change psy level indicator (SweetSpots) to Igorad's indicator (to PsyLevels_v2 - see first post of the thread) so it may be good scalping system (see the chart and template)
Premium Trading Forum: subscription, public discussion and latest news
Trading Forum wiki || MQL5 channel for the forum
Trading blogs || My blog
I spoke with Igorad and he told me that it may be good scalping system. But I think - it may be difficult to trade/use it manually so he agrees to create scalping EA for this system on the future (that is why I uploaded it here).
Premium Trading Forum: subscription, public discussion and latest news
Trading Forum wiki || MQL5 channel for the forum
Trading blogs || My blog

Hi,
Please check out the Psylevels Dashboard_v1 indicator with ability to watch the breakout and/or bounce levels on any number of currency pairs. Plus you can watch the candle direction on any number of time frames. The dashboard also have the popup/email alerts when the breakout/bounce direction matches with all candle directions.
Code:extern string dbName = "PsyLevels Dashboard v1"; extern string symbolsArray = "EURUSD;USDCHF;GBPUSD;USDJPY;AUDUSD;USDCAD;EURGBP;EURCHF;EURJPY;GBPJPY"; extern string candleTimeFrames = "H1;D1"; extern double priceStep = 25; // Price Step in pips extern double accuracy = 2; // Level Accuracy in pips extern int bounceMode = 1; // Bounce Detection: 0-off,1-on extern int breakoutMode = 1; // Breakout Detection: 0-off,1-on extern int alertMode = 1; // Alert Mode:0-off,1-on extern int emailMode = 0; // Email Mode: 0-off,1-on extern string boardSets = "--- DashBoard Settings: ---"; extern string uniqueName = "psydb"; extern int corner = 0; extern int step_X = 18; extern int step_Y = 20; extern int offset_X = 60; extern int offset_Y = 50; extern string codeFontName = "Wingdings"; extern int codeSize = 22; extern int codeBuy = 110; extern int codeSell = 110; extern int codeNeutral = 110; extern color bounceBuyColor = SkyBlue; extern color bounceSellColor = Coral; extern color breakoutBuyColor = Blue; extern color breakoutSellColor = Red; extern color candleUpColor = Lime; extern color candleDnColor = Tomato; extern color neutralColor = Silver; extern string textFontName ="Tahoma"; extern int textSize = 8; extern color textColor = White;
Attachment 4657
Regards,
Igor

It works - thanks a lot.
This is 2 indicators all together :
- Psylevels Dashboard_v1 indicator, and
- PsyLevels_v2
Templates for white/black background are attached.
Premium Trading Forum: subscription, public discussion and latest news
Trading Forum wiki || MQL5 channel for the forum
Trading blogs || My blog
 Posting Permissions


 Reply With Quote


Bookmarks