Page 1 of 2 1 2 LastLast
Results 1 to 10 of 15

Fundamental trading -a little bit-

This is a discussion on Fundamental trading -a little bit- within the Trading Systems forums, part of the Trading Forum category; ''Do not trade usd/try , eur/try if u are not living Türkiye. Because Market can goes up or down 500 ...


  1. #1
    Senior Member levonisyas's Avatar
    Join Date
    Sep 2013
    Location
    Türkiye
    Posts
    122

    Fundamental trading -a little bit-

    ''Do not trade usd/try , eur/try if u are not living Türkiye. Because Market can goes up or down 500 pips at a normal day''
    i read and listen news 3-4 days for what will happen after the FED explanation.
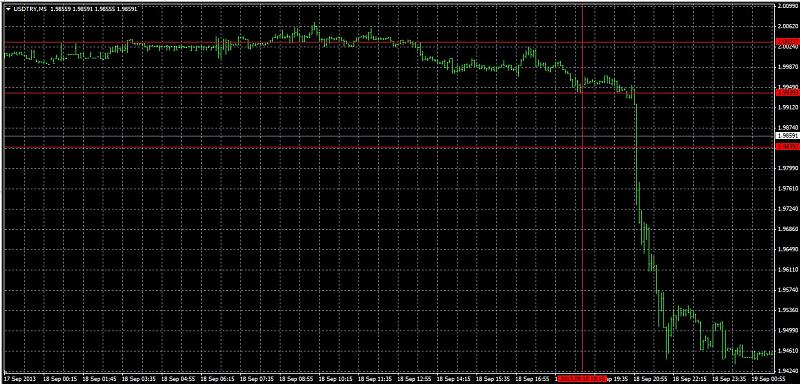
    Market gone horizontal whole day. (18.09.2013).Everyone was waiting for FED holds bond buys steady or not, exept for me :-)
    i was calculating the pips for my plan down trend or up trend.
    At 19.10 gmt-2 (newyork 12.10)
    i made 2 orders, 100 pips over for buy, 100 pips down for sell. in my idea market would make 300-400 pips.
    19.10 price usd/try 1.99393
    order for buy 2.00393 (1:66)
    order for sell 1.98393 (1:66)
    Than waited for the news.##FED holds bond buys steady##
    Market down to 1.94673 at 2 hours.
    When i saw sup/dem i closed my order at 1.95823. Nice trade :-)
    P.S. perhaps other currencies made more but it was too enough for me.

    Fundamental trading -a little bit--screenhunter_04-sep.-23-23.05.jpg

  2. #2
    Administrator newdigital's Avatar
    Join Date
    Feb 2013
    Posts
    10,474
    Blog Entries
    2911
    Follow newdigital On Twitter Add newdigital on Facebook Add newdigital on Google+ Add newdigital on MySpace
    Add newdigital on Linkedin
    Hi levonisyas,

    Nice trades. Do you use any indicator?
    Premium Trading Forum: subscription, public discussion and latest news
    Trading Forum wiki || MQL5 channel for the forum
    Trading blogs || My blog

  3. #3
    Senior Member levonisyas's Avatar
    Join Date
    Sep 2013
    Location
    Türkiye
    Posts
    122
    indicators could not work at this time.

  4. #4
    member FinanceGlossy's Avatar
    Join Date
    Mar 2014
    Posts
    108
    Blog Entries
    95

    3 Ways to Combine Forex Indicators

    3 Ways to Combine Forex Indicators

    Forex traders like to use different methods and tools to help them trade profitably. There are hundreds of technical indicators available to choose from; some of them work well and some of them only seem to work some of the time.

    Often, traders like to combine indicators as doing so helps to provide more robust trading signals. By doing so, traders have more chance of making money. As well, filtering out trades helps to reduce commission costs overall. Here are three ways to combine forex indicators:

    Volume and Breakout

    Volume and breakout is a classic combination that traders use but unfortunately some brokers do not provide much in the way of volume data in forex markets.

    Nevertheless, the combo works because breakouts often signal changes in trend and lead to long-term market moves.

    Similarly, volume helps show direction as it indicates the move is “real” and not just a technical move. Combining the two greatly reduces the chance of whipsaws.

    Moving Average and RSI

    These two indicators work well as confirmation indicators in their own right and they can also be combined together for two different types of strategies.

    Mean reversion strategies can benefit if the RSI is oversold or overbought. If the forex pair is a good way from its moving average, it also signals a return to the mean is likely so combining the two signals helps strengthen the trade.

    In trending markets, RSI and the moving average can work in the opposite way. If a currency is overbought, and the moving average has just crossed over a slower MA, or if the price has crossed over the MA, then it’s a stronger signal to enter a trend following trade.

    Either one can also be used as a filter against the other. For example, if RSI is overbought but there is no MA cross, then the trade signal can be annoyed.

    Bollinger Band and Open Positions

    Indicators can be combined with fundamental metrics too and this is sensible in forex markets.

    Open position data or COT (Commitment of Traders) data, can be used to support or restrict technical signals.

    As an example, let’s say that GBP/USD is riding high and has just climbed towards the top of its upper Bollinger Band. In some cases, this could be interpreted as a bullish sign but a look at the open position data suggests a one-sided situation that could limit any further move upwards.

    In this example, open position data suggests that around 80% of open positions in GBP/USD are long positions. If this is the case, then there are very few bulls left in the market to buy. The situation is very one-sided and only a few short positions would be needed to make the currency drop back.

    Thus when a currency hits a Bollinger Band and open position data suggests a one-sided market, there is a great potential for a reversal.

  5. #5
    Administrator newdigital's Avatar
    Join Date
    Feb 2013
    Posts
    10,474
    Blog Entries
    2911
    Follow newdigital On Twitter Add newdigital on Facebook Add newdigital on Google+ Add newdigital on MySpace
    Add newdigital on Linkedin

    How technical analysis and fundamental analysis can help your trading decisions

    How technical analysis and fundamental analysis can help your trading decisions


    Fundamental trading -a little bit--12122.jpg


    In the world of investing and trading, it's a dog eat dog world; every single edge you can obtain over your peers should be held on to as preciously as you would hold on to a 500-year-old treasure. Therefore, in order to obtain an edge and to generate consistently profitable trades, having a strategy-approached mindset is a good idea.

    Broadly speaking, there are two popular groups of strategies:

    1. Technical analysis: uses statistics and a stock's historical performance to forecast future stock prices.

    2. Fundamental analysis: tries to predict a stock's intrinsic, or 'fundamental' value, and looks for opportunities where the live price deviates from the calculated intrinsic price.

    In this article, we will try to guide you on how to go about getting started with either of these two approaches.

    TECHNICAL ANALYSIS

    Technical analysis uses historical stock statistics, usually price and volume data, to forecast future prices. In layman's terms, a technical analyst finds a pattern in a stock's data, makes the assumption that the pattern is going to repeat into the foreseeable future, and accordingly places his/her trade in the direction signalled by the pattern.

    Technical indicators are frequently used by technical analysts to help make their trading decisions. Popular technical indicators include moving averages, MACD, regressions, support/resistance levels, etc. Technical analysts essentially look for trends in the market. Their basic assumption is that price of a stock already has all information priced into it and that a stock is either always 'trending' up, down, or sideways. Prices move in patterns and price action repeats itself. Charts are frequently used by technical analysts to help make their trading decisions.

    For example, suppose a trader notices (usually with the help of a chart) that the previous 25 times, every time stock XYZ trended up 1 per cent, it was followed by a downward trend. Essentially, the trader has stumbled upon a 'zig-zag' pattern: it seems that the market begins to sell the stock every time it trends up 1 per cent. The trader has now created a signal: the next time the stock trends up 1 per cent, he/she will look to sell the stock. Similarly, traders look for other such types of patterns to help make their trading decisions.

    One can get started with technical analysis by researching the aforementioned popular technical indicators. Ensure that your trading broker offers charting tools as a part of your trading software. Ask your broker what technical indicators are available and how to go about implementing them.

    FUNDAMENTAL ANALYSIS

    On the other end of the trading spectrum, we find fundamental analysts. A fundamental analyst is bound to clash with a technical analysis almost as viciously as an Apple user vs. a PC user!

    The reasons have to do with the core tenet that fundamental analysts live by: the market cannot be depended upon accurately pricing a stock. While a technical analyst believes that external factors, such as earnings reports, economic news releases, etc. - are immediately and always priced into a stock, a fundamental analyst believes that it takes time for a stock to accurately reflect all market information; hence, when his/her 'calculated' price of the stock varies from the actual price of the stock, he/she can trade and earn a profit. While technical analysis is more associated with traders, who are constantly looking for patterns to enter and exit trades, investors are usually more drawn to fundamental analysis.

    The de facto classic example of a successful fundamental analyst is the world-renowned 'value investor' Warren Buffett. Mr Buffett implemented value investing, essentially looking for stocks whose intrinsic value was higher than their market price, and was never afraid to place large, long-term trades on these stocks.

    Determining the intrinsic value of a stock is the chief mission of a fundamental analyst. The fundamental analyst will look at a company's profile, seeing when its latest earnings reports were released, what type of news is expected from the company, and accordingly analyse if the market has correctly priced in all this information into the stock's price. Successful fundamental analysts do not shy away from financial statements. Analysts look at a company's revenue, expenses, assets, and liabilities and all other relevant financial aspects of a company. Taking all this data into account, the analyst attempts to understand what the true value of the stock should be.

    One can get started with fundamental analysis by researching how stock prices are determined by a market. By understanding how to interpret earning reports, financial statements, balance sheets, cash flow statements, etc., the reader would understand how stock prices move in reaction to these pieces of information. That way, the next time you feel that a stock is under-priced based on what you know about the stock, you can invest in the stock more confidently.

    Technical analysis and fundamental analysis are both powerful strategies that investors and traders can utilise to aid their trading decisions. Just like how you might be holding an iPhone while typing away on a PC, it IS possible to utilise both technical analysis and fundamental analysis. One just needs to keep an open mind.
    Premium Trading Forum: subscription, public discussion and latest news
    Trading Forum wiki || MQL5 channel for the forum
    Trading blogs || My blog

  6. #6
    member ForeCastle's Avatar
    Join Date
    Apr 2013
    Posts
    1,077
    Blog Entries
    236

    How to Formulate a Bias and Set Risk Amounts with Price Action

    Talking Points:

    • Traders should look for biases (trends) in the effort of getting the probabilities of success on their side, if even just by a little bit.
    • There is a massive difference between trading and analysis, and risk management can assist in bridging that gap.
    • Price action can offer traders built-in methods for managing and setting risk based on the environment in which they’re trading.

    Technical analysis is to use what’s happened in the past in the effort to trade what may happen in the future, it only reasons that traders should look to trade with the most accurate information available.


    How to Form a Bias with Price Action

    There are numerous ways to form a bias in a market. Many traders like the use news and current events. I wish I could call this ‘fundamental analysis,’ but it really isn’t. This is chasing the ‘hot dot,’ which isn’t too dissimilar from choosing to drive during the heat of rush hour, or attempting to get actual shopping done during ‘black Friday.’ Fundamental analysis is considerably more in-depth than just reading a newspaper or an article to form an opinion on a matter (or a market).

    Traders that are actually using fundamental analysis are looking inside of an economy at data points that may show signs of growth or contraction. This process requires analysis of data sets like the Consumer Price Index, or Gross Domestic Product over long periods-of-time in the effort of seeing ‘inside of the economy.’ The hope here is that all of this data analysis will point to a key variable that will often drive Foreign-Exchange prices, and that is Interest Rates.

    In a normal environment, higher rates attract capital. Lower rates cause capital to flee. This is just logic. If all factors (and risks) are equal and you can choose between an investment paying 5% and another paying 3%, rationally investors should choose the 5% option. Of course there are outlier situations, such as the Financial Collapse in which investors may prefer lower-yielding investments (such as US Dollars), simply because of the relative safety that can be had in such instruments.
    This highlights an inherent difficulty with fundamental analysis: You can be 100% right in your analysis, but you can still lose a lot money. This goes right back to that old quote of ‘the market is always right.’

    The goal of the fundamental analyst is to find unrealized value in the market: An inherent contrarian-like strategy. And just as John Maynard Keynes had said, ‘The market can remain irrational far longer than you or I can remain solvent.’

    So does this mean fundamental analysis should be avoided because it will, at times, be wrong? Not necessarily… it simply means that traders need to incorporate this information in an efficient fashion; taking fundamental analysis as more of a hypothesis or idea than a scientific law. But there has to be a better way of generating a bias than simply reading newspapers or digging through old CPI reports.

    Price action can be hugely helpful here. By looking at current price and its relationship to past prices, we can see the way that the market is evaluating an investment at any one point-in-time. There’s no projection needed here… no prognostication. Price action is real, actual prices that have traded in the market, and we don’t have to examine each movement to decide whether or not its ‘real,’ because it’s all real.

    Up and Down Trends shown via Price Action (GBPUSD Daily Chart)


    To form a bias with price action, traders can evaluate a longer-term, bigger-picture chart of that market in the effort of seeing whatever prevailing bias may impact their targeted time frame. This is incorporating multiple time frame analysis in the effort of getting the most complete picture of a market. So, if you’re looking to enter positions on the hourly chart, look to the 4-hour chart for prevailing trends so that when you trigger positions on the hourly, you can do so in the direction of whatever prevailing bias has been seen.

    Setting Risk with Price Action

    A consistent theme throughout our price action articles is the necessity of risk management. And the reason that I’m so ardent around the topic is because over the long-term, risk management is the factor that often leads to a trader’s success or demise.

    Just as we encountered in the previous section, the difficult aspect of analysis is that you can be 100% spot-on in your analysis yet still lose money. As a trader, your success is based solely on one factor: Are you profitable?
    Many traders, especially new ones, delude themselves into thinking that analysis and trading one in the same. This can be a disastrous and ill-informed vantage point.

    Surely, analysis can help a trader… and over a long enough time horizon, if one trades well (profitably) long enough, they’re bound to learn at least some analysis. But success as a trader is about a lot more than just guessing based on a hunch, and hoping that it might work out.

    Again – they were right well over half the time, but still lost money. And this isn’t some anecdotal assertion, nor am I asking you to just take my word for it: This was data generated over 12 million trades placed by real traders like you and I with the goal of making money on a market.

    Without proper risk management, all of the great analysis in the world can be rendered moot.
    So manage your risk before it manages you.

    If a trader is looking to buy in a trend, then the market has shown a series of ‘higher-highs’ and ‘higher-lows,’ as that bias has been priced in the market. So, if one is going to look to buy in that trend, and this process of higher-highs and higher-lows does not continue, why would they want to stick around in the trade? What they’ve seen (and what they’re looking for) – continuation of the trend – comes in question as soon as ‘lower-lows’ or ‘lower-highs,’ come into the market – so why wait around to see how wrong you might’ve been?

    If buying an up-trend, why stay in the trade if lower-lows are made?


    If a trader is looking to buy in a range-bound market, anticipating that prices may move back up to previously-defined resistance; it would be logical to look to bail out of the trade if a lower-low was made, right? After all, if a lower-low is made, that means that support has been broken… and if support breaks whilst in a long position, how do we know that this breakout won’t continue to the down-side? And if this breakout does continue to the downside while the range-trader sits in a long position, a considerable amount of equity can be lost in a very short period of time.

    If trading a range, why stay in the trade if the range breaks out against your position?


    When trading a range, traders can use price action to place their stops slightly below support (for long positions – or above resistance for short position), so that if/when the range breaks, the trader is protected from taking an outsized loss on the position.

    A Final Note

    While there is no analysis in the world that’s a panacea with the ability to solve the ultimate question (where future prices will move); price action can present a clean analytical framework with which traders can approach a market with a logical and well-thought out approach.

    Traders need to keep the number one goal in mind – which should, as a trader, be to make money. And while performing analysis can be fun, and might make us feel good when we’re right – we have to remember that this is only a small portion of the approach.

    Trading is about technique… trading is about risk management… and trading is about knowing what to do when your analysis doesn’t pan out as you had hoped, because every trader in the world is going to find themselves in that situation. This is when we should prioritize loss mitigation over profit maximization.

    --- Written by James Stanley


    More...

  7. #7
    Member Chris's Avatar
    Join Date
    Apr 2015
    Posts
    57
    I like fundamental analysis and forecasts. It can be useful for trading decisions, if you take it from reliable sources. I usualy read tenko and fresh forecasts.

  8. #8
    Administrator newdigital's Avatar
    Join Date
    Feb 2013
    Posts
    10,474
    Blog Entries
    2911
    Follow newdigital On Twitter Add newdigital on Facebook Add newdigital on Google+ Add newdigital on MySpace
    Add newdigital on Linkedin
    This is the template (with the indicator) which may be used to trade fundamental news events (I used this template for the long time).
    M5 timeframe.
    Template and indicator is attached.
    So, finally you will get the similar chart using template:

    Fundamental trading -a little bit--eurusd-m5-alpari-limited.png


    Fundamental trading -a little bit--gbpusd-m5-alpari-limited.png
    Attached Files Attached Files
    Premium Trading Forum: subscription, public discussion and latest news
    Trading Forum wiki || MQL5 channel for the forum
    Trading blogs || My blog

  9. #9
    Administrator newdigital's Avatar
    Join Date
    Feb 2013
    Posts
    10,474
    Blog Entries
    2911
    Follow newdigital On Twitter Add newdigital on Facebook Add newdigital on Google+ Add newdigital on MySpace
    Add newdigital on Linkedin
    Quote Originally Posted by newdigital View Post
    This is the template (with the indicator) which may be used to trade fundamental news events (I used this template for the long time).
    M5 timeframe.
    Template and indicator is attached.
    So, finally you will get the similar chart using template:

    ...
    And this is the idea about how to use this template for the technical analysis:

    - bullish trend is the price is above 200-day SMA/100-day SMA area;
    - bearish trend if the price is below 200-day SMA/100-day SMA area;
    - ranging in case of the price is within 200-day SMA/100-day SMA.

    Fundamental trading -a little bit--eurusd-d1-alpari-limited.png
    Premium Trading Forum: subscription, public discussion and latest news
    Trading Forum wiki || MQL5 channel for the forum
    Trading blogs || My blog

  10. #10
    Administrator newdigital's Avatar
    Join Date
    Feb 2013
    Posts
    10,474
    Blog Entries
    2911
    Follow newdigital On Twitter Add newdigital on Facebook Add newdigital on Google+ Add newdigital on MySpace
    Add newdigital on Linkedin
    - ForexFactoryNews_v3.0 600+ indicator (ForexFactory Economic Calendar) is on this post. This version works with Metatrader 4 build 600 and above.
    Premium Trading Forum: subscription, public discussion and latest news
    Trading Forum wiki || MQL5 channel for the forum
    Trading blogs || My blog

Page 1 of 2 1 2 LastLast

Tags for this Thread

Bookmarks

Posting Permissions

  • You may not post new threads
  • You may not post replies
  • You may not post attachments
  • You may not edit your posts
  •