
 LinkBack URL
 About LinkBacks


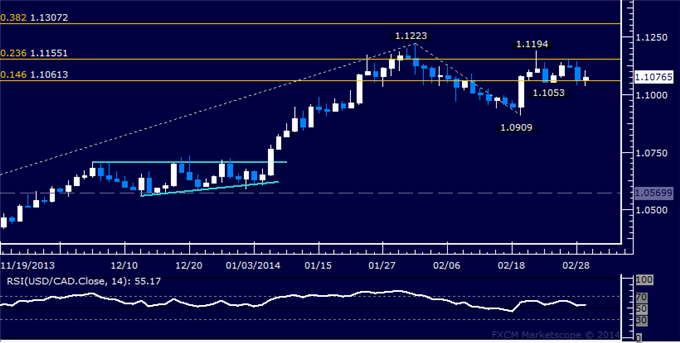
-Measured objectives from the breakout above the 2011 high range from 1.1680 to 1.1910. The Jul 2009 high rests in this zone at 1.1724 and the 2007 high is near the top of the zone at 1.1875.
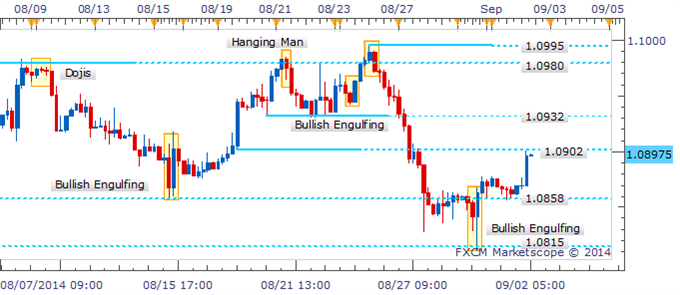
-The rate has responded to support (1.0990). This is a good place for the larger rally to resume although Tuesday’s outside day warns that the drop isn’t complete.
LEVELS: 1.0904 1.0953 1.0999 | 1.1076 1.1132 1.1216
More...


 Reply With Quote


Bookmarks