

TechnoMeter
USD/CAD Technical Analysis: Sidelines, Bearish Engulfing Pattern and H4 Chart Reveals Bullish Signal
by
, 10-30-2014 at 01:17 AM (1290 Views)
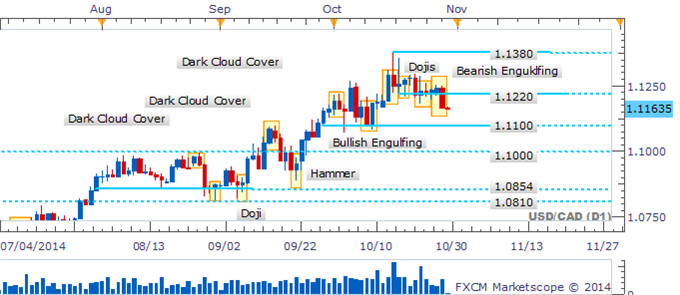
The USD/CAD bulls appear to have lost their grip on the pair after struggling to hang onto the 1.1200 mark. The recent pullback has left a Bearish Engulfing formation in its path, which awaits confirmation from a successive down-day. Validation would warn of a deeper setback towards the psychologically-significant 1.1100 handle.
Bearish Engulfing Pattern Warns Of A Deeper Setback
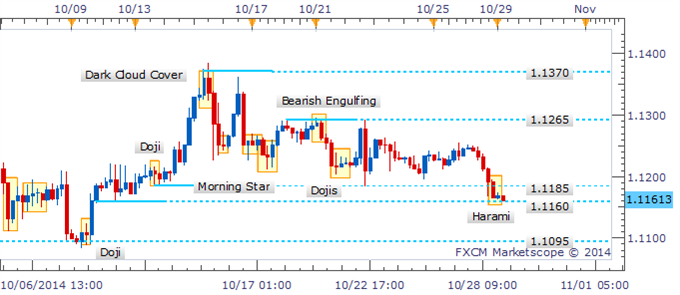
The four hour chart reveals some intraday buying interest at the 1.1160 mark, which has prompted the emergence of a Harami formation. However, the bullish reversal signal lacks confirmation at this stage casting doubt on a potential recovery over the session ahead.
Recovery Questionable As Harami Lacks Confirmation
By David de Ferranti, Currency Analyst, DailyFX
More...


Tags:
bearish,
bearish engulfing,
bullish,
usdcad

- Categories
- Uncategorized
 Email Blog Entry
