Date: 2nd September 2024.
Is The Dow Jones Overpriced? The DJIA Declines On Monday!
*Markets expect US employment data to improve adding a further 160,000 employees to the country’s payroll.
*Analysts expect US Job vacancies to drop to their lowest level in 2024, but to remain at the 5-Year Average.
*According to the Chicago exchange, an interest rate cut on September 18th is certain. Markets expect a 0.25% rate cut.
*Strong gains on Friday evening saved the US Stock Market from witnessing another bearish close.
Dow Jones (USA30) – Recurring Pattern
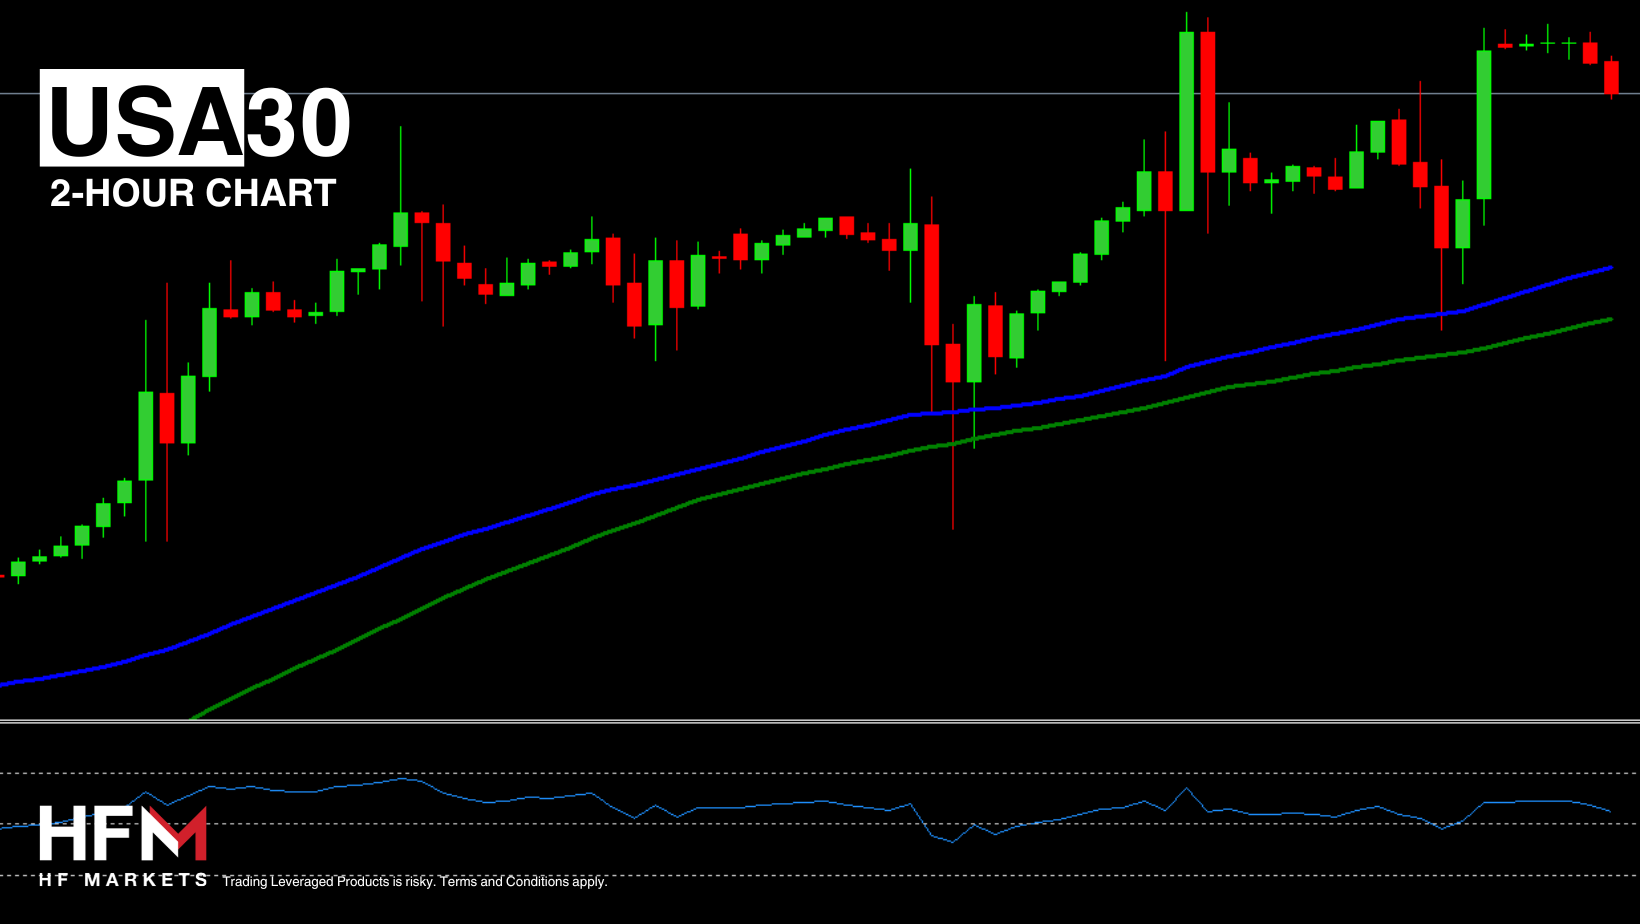
On Friday, the stock market quickly fell at the opening of the US Session but thereafter the market quickly rose to close at a higher price. Investors should note that of the past 7 trading sessions, this has been a known pattern. Of the past 7 trading sessions the price has fallen at the open and then corrected on 5 occasions. A positive factor for the Dow Jones is the price is forming higher swing lows and is witnessing less bearish momentum over the past week.
Dow Jones Components
The Dow Jones’ components on Friday saw 5 stocks fall while 25 stocks rose in value. Therefore, 83% of the index rose in value confirming buy signals could have been relevant. Though, during today’s session investors should note that the US 10-Year T-Bond rose in value by 42 points. Currently, the VIX index is more or less unchanged, but as the US 10-Year T-Bond trades significantly higher, investors will need to be cautious of volatility. If the VIX increases in value and Bonds Yields remain significantly higher, the price of the Dow Jones may witness a horizontal trend. It will also be vital to again review the percentage of the components witnessing bullish and bearish price movements.
Earnings season is almost at a close, the only major company yet to release its earnings report is Broadcom. However, Broadcom stocks are not a component of the Dow Jones and the report will simply impact the market only through the broader market sentiment. Analysts will concentrate their attention on this week’s ISM PMI release, JOLTS Job Openings and the Employment data on Friday.
Ideally investors will want to see neither weak data which will trigger low consumer demand fears, nor positive data which will make rate cuts less likely. Ideally, investors would like to see the data read in line with expectations. Currently the market is pricing in 0.75% to 1.25% rate cuts in 2024. If the Fed indicates less than 0.75%, the stock market is likely to be overpriced.
Dow Jones Technical Analysis
In terms of technical analysis, the Dow Jones has been the only index which has continuously held above the 75 and 100 Period Moving Averages. Meanwhile, the SNP500 and NASDAQ have been unable to maintain momentum. Higher demand is due to the Market’s lower risk appetite and investors increasing exposure away from the technology market. However, the price is now trading very close to its all-time highs and close to its overbought market on most oscillators. Therefore, investors will be looking for further price drivers to regain momentum.
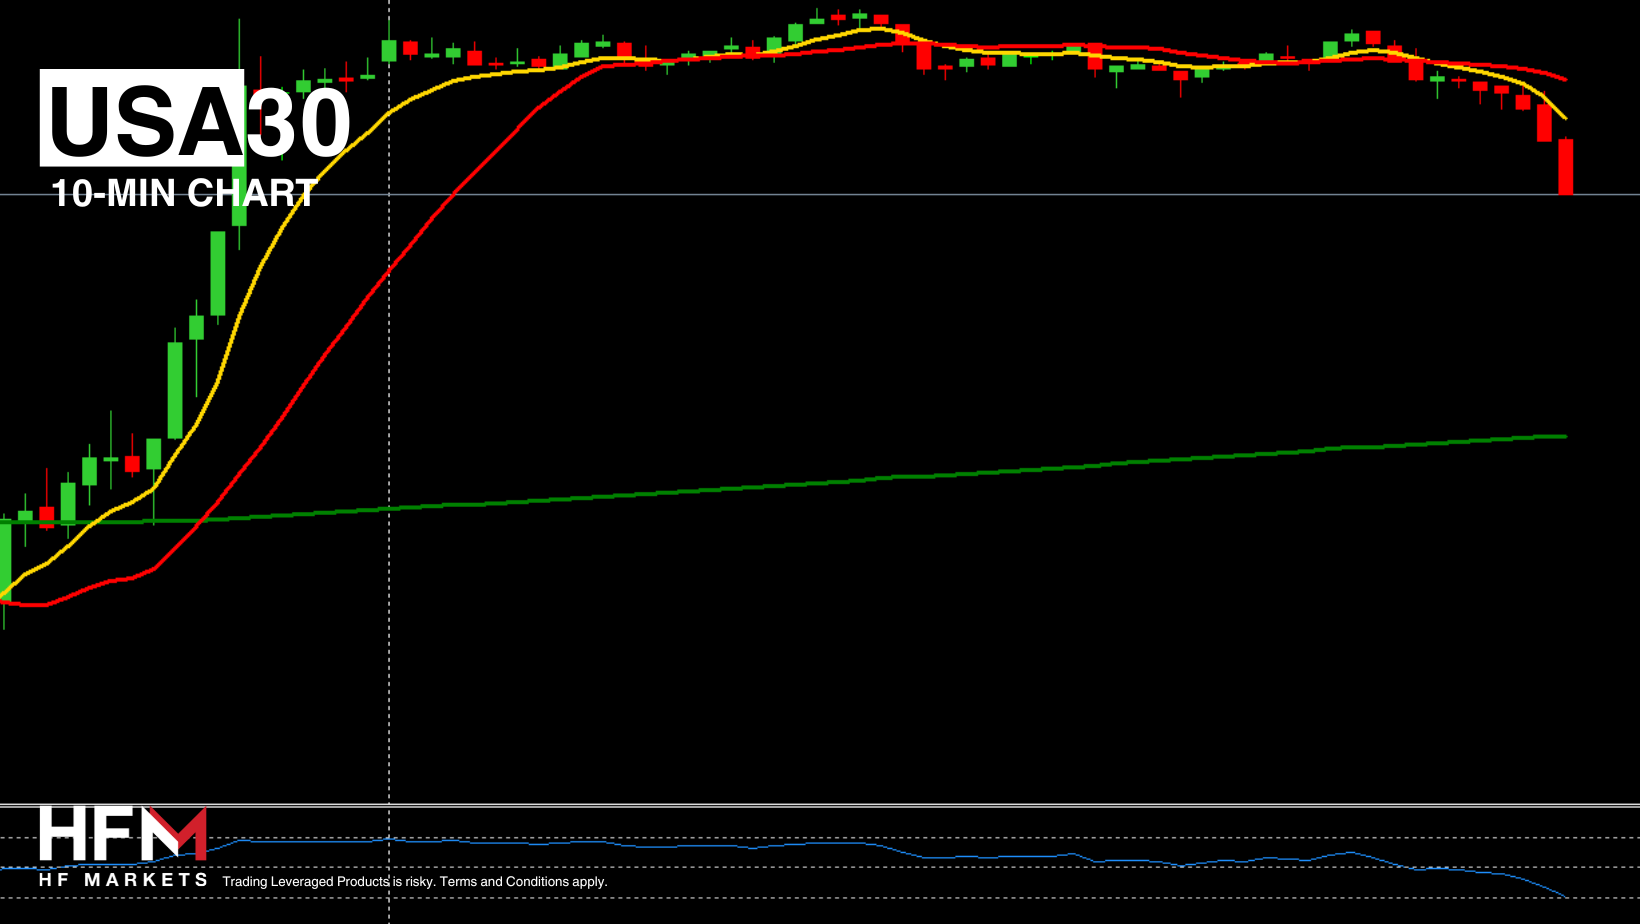
Dow Jones 10-Minute Chart on September 2nd
According to Fibonacci retracement levels, if the price declines, a retracement could fall as far as $41,339.55. If global indices rise and at least 65-70% of the Dow Jones’ stocks rise, investors may deem a breakout of the $41,641.00 level as a signal to speculate a price increase.
Always trade with strict risk management. Your capital is the single most important aspect of your trading business.
Please note that times displayed based on local time zone and are from time of writing this report.
Click HERE to access the full HFM Economic calendar.
Want to learn to trade and analyse the markets? Join our webinars and get analysis and trading ideas combined with better understanding on how markets work. Click HERE to register for FREE!
Click HERE to READ more Market news.
Michalis Efthymiou
Market Analyst
HFMarkets
Disclaimer: This material is provided as a general marketing communication for information purposes only and does not constitute an independent investment research. Nothing in this communication contains, or should be considered as containing, an investment advice or an investment recommendation or a solicitation for the purpose of buying or selling of any financial instrument. All information provided is gathered from reputable sources and any information containing an indication of past performance is not a guarantee or reliable indicator of future performance. Users acknowledge that any investment in FX and CFDs products is characterized by a certain degree of uncertainty and that any investment of this nature involves a high level of risk for which the users are solely responsible and liable. We assume no liability for any loss arising from any investment made based on the information provided in this communication. This communication must not be reproduced or further distributed without our prior written permission.


 3Likes
 LinkBack URL
 About LinkBacks




 Reply With Quote








Bookmarks