Page 2 of 3 FirstFirst 1 2 3 LastLast
Results 11 to 20 of 26

CAD News

This is a discussion on CAD News within the Analytics and News forums, part of the Trading Forum category; After touching 1.3540 resistance, USDCAD pulled back to 1.3480, indicating that the pair remains in downtrend from 1.3793 and the ...


  1. #11
    Senior Member forexcycle's Avatar
    Join Date
    Apr 2017
    Posts
    111
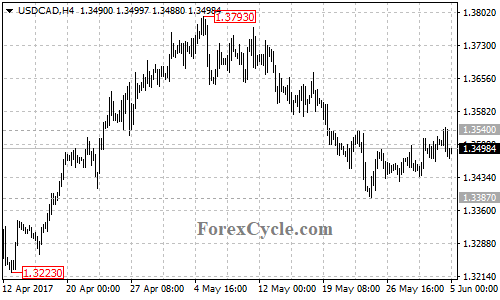
    After touching 1.3540 resistance, USDCAD pulled back to 1.3480, indicating that the pair remains in downtrend from 1.3793 and the bounce from 1.3387 could be treated as consolidation of the downtrend. As long as 1.3540 resistance holds, the downtrend could be expected to continue and further decline towards 1.3200 is still possible after the consolidation. Only a clear break of 1.3540 resistance will indicate that the bearish movement had completed at 1.3387 already, this could trigger another rise towards 1.3800.

  2. #12
    Senior Member forexcycle's Avatar
    Join Date
    Apr 2017
    Posts
    111
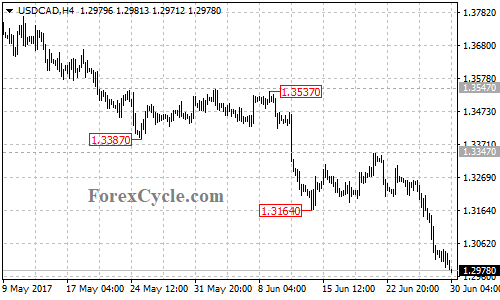
    USDCAD continued its downward movement from 1.3347 and the fall extended to as low as 1.2971, facing the important support level of 1.2968 (Jan 31 low). Near term resistance is at 1.3045, as long as this level holds, the downtrend could be expected to continue and next target would be at 1.2800 area. On the upside, a break above 1.3045 resistance will indicate that consolidation for the downtrend is underway, then the following rebound could bring price back into 1.3100 zone.


  3. #13
    Senior Member forexcycle's Avatar
    Join Date
    Apr 2017
    Posts
    111
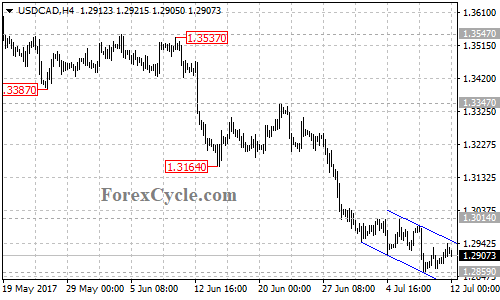
    USDCAD remains in downtrend from 1.3347, the bounce from 1.2859 could be treated as consolidation of the downtrend. Near term resistance is at the top trend line of the price channel on its 4-hour chart. As long as the pair is in the channel, the downtrend could be expected to continue and next target would be at 1.2700 area. On the upside, a clear break above the channel resistance could take price to test 1.3014 key resistance, only a break of this level will indicate that the downtrend had completed at 1.2859 already, then further rally to 1.3100 area could be seen.


  4. #14
    Senior Member forexcycle's Avatar
    Join Date
    Apr 2017
    Posts
    111
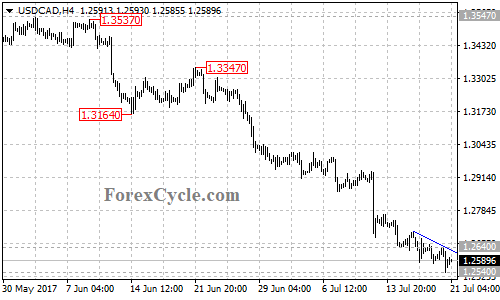
    USDCAD remains in the downtrend from 1.3347, the bounce from 1.2540 could be treated as consolidation of the downtrend. Near term resistance is at the downward trend line on its 4-hour chart. As long as the trend line resistance holds, the downtrend could be expected to continue and further decline to test 1.2460 (May 2016 low) support is still possible. Key resistance is at 1.2640, only a break of this level will indicate that the downtrend had completed at 1.2540 already, then the following correction rebound could bring price into 1.2850 zone.


  5. #15
    Senior Member forexcycle's Avatar
    Join Date
    Apr 2017
    Posts
    111
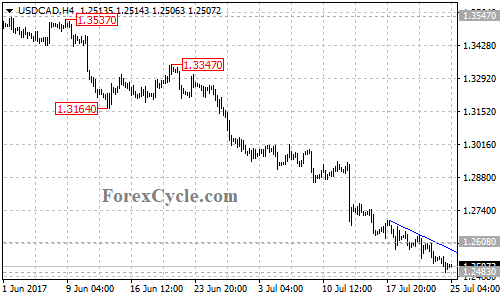
    USDCAD’s bearish movement from 1.3347 extended to as low as 1.2483, facing the import support at 1.2460 (May 2016 low). Near term resistance is at the falling trend line on the 4-hour chart. As long as the trend line resistance holds, the downtrend could be expected to continue. Key resistance is at 1.2608, only a break above this level will indicate that the downtrend had completed at 1.2483 already, then the following correction rebound could bring price into 1.2800 zone.


  6. #16
    Senior Member forexcycle's Avatar
    Join Date
    Apr 2017
    Posts
    111
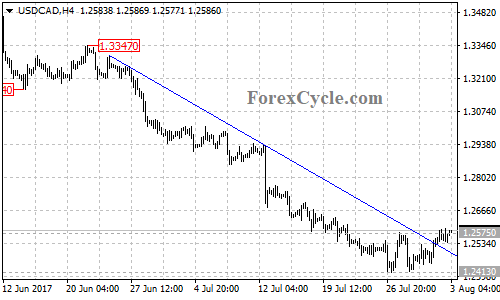
    USDCAD broke above 1.2575 resistance, indicating that the downtrend from 1.3347 had completed at 1.2413 already. Further rally could be expected in a couple of days and next target would be at around 1.2690, followed by 1.2740. However, the rally from 1.2413 would possibly be correction of the downtrend from 1.3793 (May 5 high), another fall towards 1.2000 is still possible after the correction, and a breakdown below 1.2413 support could signal resumption of the downtrend.


  7. #17
    Senior Member forexcycle's Avatar
    Join Date
    Apr 2017
    Posts
    111
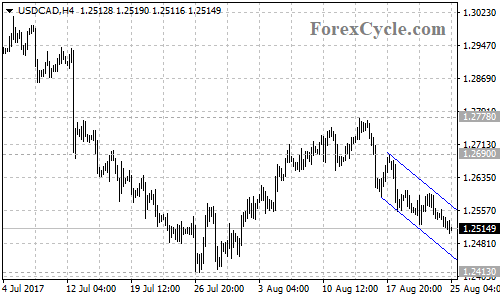
    USDCAD’s short term downtrend from 1.2778 extended to as low as 1.2505. As long as the price is in the falling price channel on the 4-hour chart, the downtrend could be expected to continue and deeper decline to test 1.2413 support is possible. On the upside, a clear break above the top trend line of the price channel will signal completion of the short term downtrend, then the following upside movement could bring price to test 1.2778 resistance.


  8. #18
    Senior Member forexcycle's Avatar
    Join Date
    Apr 2017
    Posts
    111
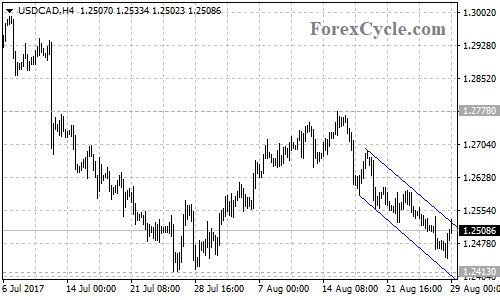
    USDCAD extended its short term downtrend from 1.2778 to as low as 1.2444, facing the previous low support at 1.2413. A breakdown below this level could signal resumption of the downtrend from 1.3793 (May 5 high), then next target would be at 1.2300, followed by 1.2050. Near term resistance is at the top trend line of the price channel on the 4-hour chart. A clear break above the channel resistance could indicate that the short term downtrend is complete, then the following upside movement could bring price back to test 1.2778 resistance.


  9. #19
    Senior Member forexcycle's Avatar
    Join Date
    Apr 2017
    Posts
    111
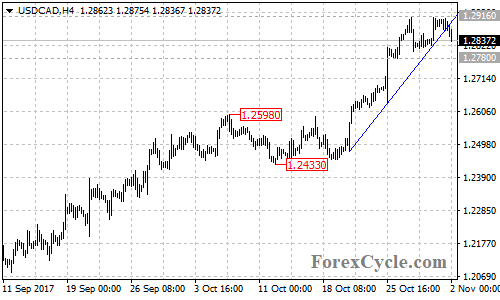
    USDCAD failed to breakout of 1.2916 resistance and pulled back to break below a bullish trend line on the 4-hour chart, suggesting that lengthier consolidation for the uptrend from 1.2433 is underway. Range trading between 1.2780 and 1.2916 would likely be seen in a couple of days. As long as 1.2780 support holds, the uptrend could be expected to resume and further rise to 1.3100 area is still possible after the consolidation. On the downside, a breakdown below 1.2780 support could signal completion of the uptrend from 1.2433, then the pair would find next support at around 1.2600. Click here for more forex analysis.


  10. #20
    Senior Member forexcycle's Avatar
    Join Date
    Apr 2017
    Posts
    111
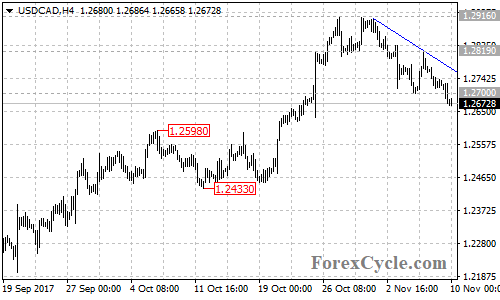
    USDCAD broke below 1.2700 support and extended its downside movement from 1.2916 to as low as 1.2666, facing the support of the bullish trend line on the daily chart. Near term resistance is at the falling trend line on the 4-hour chart. As long as the price is below this trend line, the downtrend could be expected to continue and next target would be at 1.2500 area. On the upside, a clear break above the falling trend line could bring price back to next resistance level at 1.2819. Above this level will confirm that the downtrend is complete, then next target would be at 1.2916, followed by 1.3100.


Page 2 of 3 FirstFirst 1 2 3 LastLast

LinkBacks (?)

  1. 03-02-2017, 06:56 PM

Tags for this Thread

Bookmarks

Posting Permissions

  • You may not post new threads
  • You may not post replies
  • You may not post attachments
  • You may not edit your posts
  •