Page 8 of 8 FirstFirst ... 6 7 8
Results 71 to 75 of 75
Like Tree2Likes

Daily Market Analysis and Overview by Unitedpips

This is a discussion on Daily Market Analysis and Overview by Unitedpips within the Analytics and News forums, part of the Trading Forum category; Bitcoin vs. Dollar: Price Prediction & Outlook Introduction to BTCUSD The BTCUSD pair, "King Crypto" against the "Greenback," highlights the ...


  1. #71
    Junior Member
    Join Date
    Oct 2024
    Posts
    75
    Bitcoin vs. Dollar: Price Prediction & Outlook


    Introduction to BTCUSD
    The BTCUSD pair, "King Crypto" against the "Greenback," highlights the exchange rate between Bitcoin and the US Dollar. This pairing offers crucial insights into the cryptocurrency market's health and its interaction with traditional finance. Understanding BTC USD dynamics is paramount for crypto traders and investors in the volatile digital asset landscape.


    BTC/USD Market Overview
    The BTC/USD market shows a strong upward trajectory on the daily timeframe, reflecting renewed bullish sentiment. Bitcoin recently hit its all-time high (ATH), and after a minor correction, the price is cautiously resuming its climb. The US Dollar faces a busy economic calendar today, with Federal Reserve officials scheduled to speak on monetary policy, potentially impacting USD strength. Key US economic data, including Retail Sales, Jobless Claims, and manufacturing indices, will also shed light on US economic health, influencing the Bitcoin to US Dollar exchange rate. Global economic discussions at the G20 meeting further add to market complexity.


    BTC-USD Technical Analysis
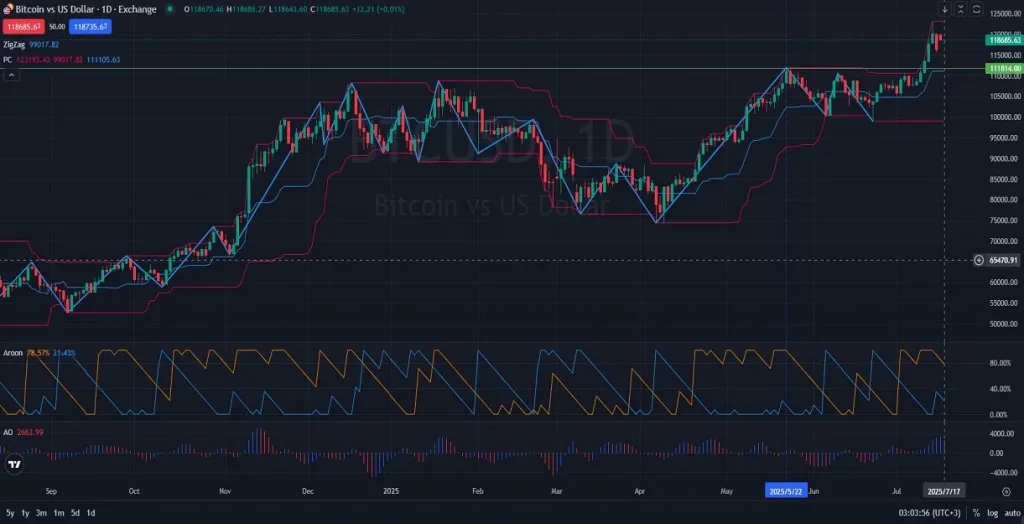
    On the BTC-USD daily chart, the Bitcoin price is strongly moving in the upper half of the price channel, touching the higher price line, indicating robust bullish momentum. This occurred after the price cleared a support line near the channel's midpoint. While the Zigzag indicator's last plot was downward, the current price action suggests an upward shift. Despite a recent correction after its ATH, Bitcoin's value is resuming its ascent. The Aroon indicator (Up: 78.57%, Down: 21.43%) confirms a strong uptrend, and the Accelerator Oscillator (2663.99) shows increasing upward momentum, reinforcing the bullish outlook for BTCUSD.


    Final words about BTC vs. US Dollar
    Considering current market trends and technical indicators, the Bitcoin outlook remains cautiously optimistic. Strong buying pressure suggests Bitcoin will continue its upward movement. However, traders should remain vigilant due to upcoming US Dollar economic data and Federal Reserve speeches, which could introduce volatility. While Bitcoin's momentum is strong, robust risk management strategies are essential given cryptocurrency market volatility. Close monitoring of key Bitcoin support and resistance levels, alongside macroeconomic factors impacting the US Dollar, will be crucial for informed BTC USD trading decisions.


    07.17.2025

  2. #72
    Junior Member
    Join Date
    Oct 2024
    Posts
    75
    XAG vs USD: Technical and Fundamental Outlook


    Introduction to XAG/USD
    The XAG/US Dollar pair tracks the spot price of silver against the US dollar, often referred to as “white gold” due to its industrial uses and store-of-value characteristics. Silver’s performance reflects both precious metals sentiment and broader risk appetite, making it a core focus for traders in commodity and forex markets. Known as the “poor man’s gold,” Silver USD offers a lower-priced alternative for investors seeking safe‑haven exposure. Daily analysis of Silver/US Dollar helps market participants pinpoint key inflection points and gauge momentum shifts.


    XAG-USD Market Overview
    Silver/USD has rallied strongly over the past several weeks, climbing from the mid‑$30s to test multi‑year highs near $38.50 amid renewed safe‑haven flows and softer USD dynamics. Over the last two trading days, silver prices consolidated just below the upper trendline, as traders weighed mixed US economic signals. Today, markets await Federal Reserve Governor Christopher Waller’s speech at NYU’s Money Marketeers dinner—any hawkish remarks could boost the US dollar and pressure silver. Tomorrow brings a relatively light calendar, though focus remains on upcoming Treasury International Capital (TIC) data, building permits, and University of Michigan sentiment figures scheduled later this month. Looking ahead, persistent inflation expectations and G20 policy discussions in South Africa will continue to sway Silver/USD sentiment into next week.


    XAG USD Technical Analysis
    On the daily chart, XAG/US Dollar is carving out an ascending wedge pattern, marked by rising support near $37.00 and a steeper resistance trendline around $38.50. After touching the upper band, price has pulled back toward the mid‑wedge region, suggesting a potential cooling phase or deeper retracement to the lower trendline. The Parabolic SAR dots remain beneath price action, indicating an overall bullish bias, though the spacing between dots is narrowing—a sign of waning upside momentum. The Awesome Oscillator’s positive histogram bars have begun to shrink, reflecting fading bullish momentum even as they stay above zero. Meanwhile, the Fisher Transform oscillator recently crossed lower from overbought territory, underlining a risk of short‑term pullback or sideways consolidation before the next directional move.


    Final words about XAG vs USD
    Given the mixed technical signals and looming US macro events, Silver-US Dollar is at a pivotal juncture within its ascending wedge. A decisive break below $37.00 would expose support levels near $36.00 and could usher in a consolidation phase. Conversely, a breakout above $38.50 targets psychological resistance around $40.00 and reaffirms the bullish trend. Traders should monitor Fed commentary and US dollar strength indicators—especially ahead of TIC and consumer sentiment releases—to anticipate shifts in safe‑haven flows. Prudent risk management, including well‑placed stop‑loss orders and position sizing, remains essential in navigating Silver/USD’s volatility.


    07.18.2025

  3. #73
    Junior Member
    Join Date
    Oct 2024
    Posts
    75
    NZD/USD Technical Analysis: Bearish Momentum Intensifies


    Introduction to NZD-USD
    The NZDUSD pair, commonly known as the Kiwi, reflects the exchange rate between the New Zealand dollar and the US dollar. This currency pair is significant for traders who follow global economic trends closely, particularly commodity prices and risk sentiment. NZD/USD is widely traded in forex markets, offering insights into the economic health of both New Zealand and the United States.


    NZDUSD Market Overview
    The NZD-USD pair is currently showing bearish momentum, influenced by recent economic data from both New Zealand and the United States. Today's release from The Conference Board indicated moderate strength in the USD, backed by improvements across key economic indicators, potentially adding downward pressure on NZD/USD. Conversely, traders are also closely monitoring the upcoming quarterly Consumer Price Index (CPI) data from New Zealand, set for release on October 16, 2025, which could significantly impact the Kiwi due to its influence on inflation and interest rate decisions by the Reserve Bank of New Zealand (RBNZ). Amid these developments, global risk sentiment remains cautious, adding further weight on commodity-linked currencies like NZD. Therefore, traders should anticipate increased volatility in NZD USD in the short term.


    NZD/USD Technical Analysis
    Analyzing the daily timeframe, NZD vs. USD recently experienced a sharp bullish bounce off the key support level around 0.55080. Subsequently, the price attempted but failed to breach its long-term descending resistance line, indicating strong bearish pressure remains intact. Momentum indicators, such as the Awesome Oscillator histogram, are currently negative, signaling continued bearish sentiment. The Fisher Transform oscillator has also turned downward, reinforcing expectations of potential further price declines. Traders should watch for another possible retest of resistance near the descending trend line around 0.60000, with a high likelihood of renewed bearish activity at these levels.


    Final Words about NZD vs USD
    Given the current technical signals and economic backdrop, NZD-USD appears poised to maintain its bearish trajectory in the near term. Traders are advised to monitor the resistance near 0.60000 closely for potential selling opportunities. Moreover, incoming economic data from both countries could significantly affect market sentiment and volatility, highlighting the importance of careful risk management. Overall, cautious trading with clear entry and exit strategies is recommended due to anticipated fluctuations driven by macroeconomic developments and technical pressures.


    07.21.2025

  4. #74
    Junior Member
    Join Date
    Oct 2024
    Posts
    75
    Daily EUR/JPY news and technical analysis


    Introduction to EUR -JPY
    The EUR/JPY pair represents the exchange rate between the Euro and the Japanese Yen. As a major currency cross, EURJPY is closely watched by traders seeking to understand the economic dynamics between the Eurozone and Japan. This pair often reflects investor sentiment toward risk, as the Euro is generally considered a risk-sensitive currency while the Yen is seen as a safe-haven. Movements in EURJPY can signal shifts in global risk appetite and monetary policy expectations from the European Central Bank and the Bank of Japan, making it a key indicator for market participants.


    EURJPY Market Overview
    Currently, EUR/JPY is showing cautious movement, with traders closely monitoring recent developments from both the Eurozone and Japan. The latest Bundesbank bond auction results have provided limited directional clarity, as the average yield and bid-to-cover ratio reflect mixed signals on investor sentiment and growth expectations within the Eurozone. Meanwhile, Eurostat’s Consumer Confidence Flash reading continues to influence market tone, with optimism or pessimism in consumer sentiment often driving EUR fluctuations. On the Japanese side, markets await the Bank of Japan’s upcoming Core CPI release, a key inflation measure that could shape future monetary policy. Given the BOJ’s sensitivity to core inflation trends, a higher-than-expected reading may support the yen. In the short term, volatility in EUR/JPY is likely to persist, especially as traders digest European bond data and look ahead to inflation indicators from Japan. Market participants should remain alert for sharp moves tied to evolving economic sentiment in both regions.


    EUR/JPY Technical Analysis
    Analyzing the daily timeframe, EUR/JPY has recently surged in a sharp bullish wave, pushing price action close to its all-time high. The pair is now approaching a critical resistance zone, raising the possibility of a short-term pullback. The Ichimoku Cloud supports the prevailing bullish momentum, with price well above the cloud and the Tenkan-sen crossing above the Kijun-sen. Meanwhile, the Stochastic Oscillator is hovering in the overbought region, suggesting that bullish momentum remains strong but may be losing steam. Traders should watch for potential consolidation or minor corrections before any continuation toward new highs.


    Final Words about EUR vs JPY
    In summary, the EUR/JPY pair remains a vital instrument for gauging global risk sentiment and central bank policy divergence. With mixed economic signals from both the Eurozone and Japan, and technical indicators pointing to strong but potentially overextended bullish momentum, traders should remain vigilant. As the pair approaches key resistance near all-time highs, short-term consolidation or corrective moves are possible. Monitoring upcoming economic data and price action at critical levels will be essential for navigating potential opportunities in this dynamic currency pair.


    07.23.2025

  5. #75
    Junior Member
    Join Date
    Oct 2024
    Posts
    75
    XRP/USD Influenced by US-China Trade Talks: Daily Market Outlook


    Introduction to XRP/USD
    XRPUSD, also known as Ripple versus the US Dollar, represents the trading pair comparing Ripple's XRP cryptocurrency against the US dollar. Ripple, popularly nicknamed "the Banker's Cryptocurrency," is widely known for its efficient cross-border payment solutions. This pairing is crucial for investors looking to diversify into cryptocurrencies with significant financial institutional backing. Monitoring XRP/USD helps traders understand the overall sentiment towards digital assets against traditional fiat currencies.


    XRP-USD Market Overview
    Currently, XRP USD is experiencing notable movements influenced by global economic news, especially concerning ongoing US-China trade discussions. Senior negotiators from the US and China are meeting in Stockholm on Monday to address key economic disputes and potentially extend the tariff truce beyond the August 12 deadline. Positive progress from these talks could bolster investor confidence in riskier assets, including cryptocurrencies like XRP. Conversely, a breakdown could prompt investors to seek safer havens, potentially pressuring XRP prices downward. Traders should closely monitor the outcome of these trade negotiations, as it could significantly influence XRP/USD’s short-term trend.


    XRPUSD Technical Analysis
    On the daily chart, XRP USD recently broke upward from a descending triangle formation, signaling bullish momentum towards the 3.2200 resistance level. However, the initial breakout lacked sufficient strength to maintain above this critical resistance, leading to a retracement below the level. The Bollinger Bands have expanded considerably, indicating increased volatility and suggesting a short-term corrective move is imminent, with prices currently heading towards the middle Bollinger Band. The Fisher Transform indicator, while positive, suggests weakening upward momentum, reinforcing the likelihood of near-term consolidation. Given XRP’s correlation with Bitcoin (BTC), traders should monitor BTC price movements closely, as any significant shifts may directly impact XRP/USD.


    Final Words about XRP vs USD
    In conclusion, XRP/USD remains in a critical phase following the recent breakout attempt. Technical indicators point toward potential short-term consolidation or a mild corrective pullback. Traders must stay vigilant about developments from the US-China trade talks, as market sentiment from such events tends to ripple into cryptocurrency markets. Additionally, tracking BTC’s trend will be crucial in gauging future movements in XRP/USD. Employing prudent risk management strategies will be essential to navigate this volatile trading environment effectively.


    07.28.2025

Page 8 of 8 FirstFirst ... 6 7 8

Bookmarks

Posting Permissions

  • You may not post new threads
  • You may not post replies
  • You may not post attachments
  • You may not edit your posts
  •