Page 6 of 6 FirstFirst ... 4 5 6
Results 51 to 54 of 54
Like Tree1Likes

Daily Market Analysis and Overview by Unitedpips

This is a discussion on Daily Market Analysis and Overview by Unitedpips within the Analytics and News forums, part of the Trading Forum category; Indicators Signal Caution Ahead of EURUSD Introduction to EUR-USD The EURUSD currency pair, often referred to simply as "Euro-Dollar," represents ...


  1. #51
    Junior Member
    Join Date
    Oct 2024
    Posts
    54
    Indicators Signal Caution Ahead of EURUSD


    Introduction to EUR-USD
    The EURUSD currency pair, often referred to simply as "Euro-Dollar," represents the exchange rate between the Euro (EUR) and the US Dollar (USD). As the most traded currency pair in the world, EURUSD serves as a benchmark for global forex markets and reflects the relative economic performance and monetary policies of the Eurozone and the United States. Known for its high liquidity and tight spreads, the pair is closely watched by traders, investors, and policymakers alike, as it reacts strongly to geopolitical developments, interest rate decisions, and macroeconomic data from both regions.


    EUR/USD Market Overview
    Currently, EURUSD is showing cautious bullish tendencies as it navigates through key technical zones, supported by mixed but largely optimistic economic data from the Eurozone. Early in the day, German Import Prices dropped more than expected at -1.4%, potentially signaling easing inflation pressures, while French Consumer Spending rebounded strongly with a 0.8% increase, reversing last month’s sharp decline. Stable readings in French Private Payrolls and GDP further reflect economic resilience within the region. Meanwhile, a sharper-than-expected rise in German Unemployment Change (+12K vs. 4K forecast) has tempered some of the bullish sentiment, highlighting underlying labor market challenges. On the U.S. side, attention is focused on upcoming events that may shape USD direction. Federal Reserve Bank of Minneapolis President Neel Kashkari’s speech and the release of FOMC Meeting Minutes are highly anticipated, especially for clues on future monetary policy. Additionally, a slightly better-than-expected Richmond Manufacturing Index may provide modest support to the USD.


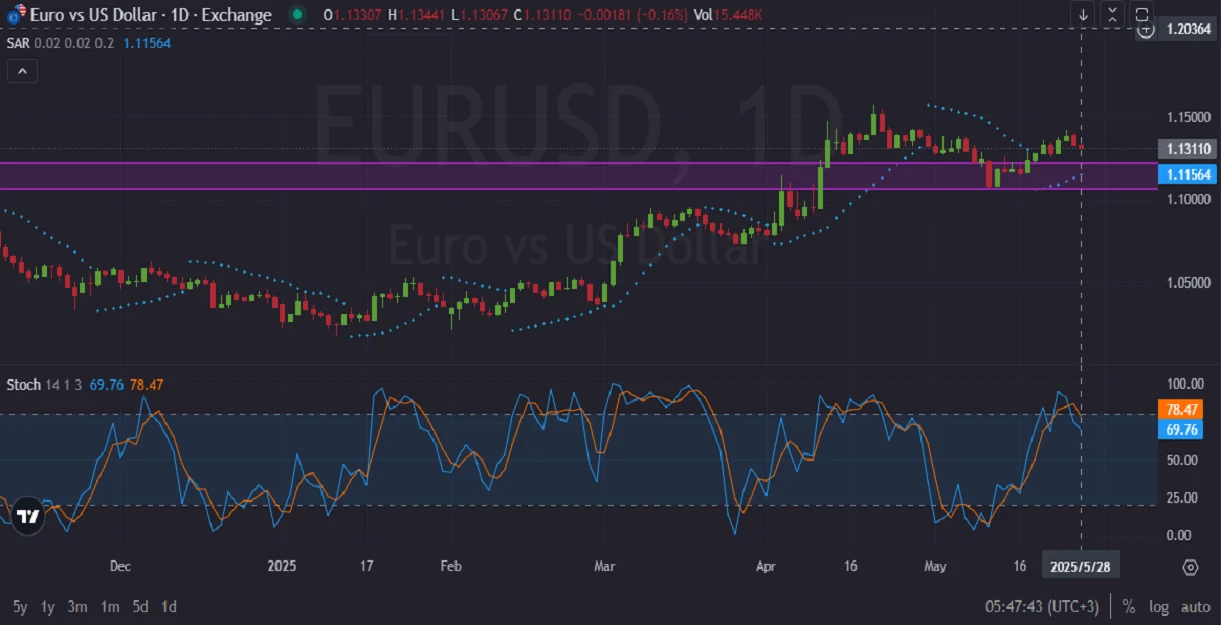
    EURUSD Technical Analysis
    Technically, EUR/USD is currently exhibiting signs of bullish consolidation after a strong upward move earlier this month. The pair has held above a key support zone between 1.11564 and 1.13110, which has previously acted as a strong demand area. This zone is now serving as a critical pivot, with price action showing resilience above it despite minor pullbacks. The Parabolic SAR dots remain below the price, confirming continued bullish momentum, although they are beginning to flatten, which could indicate a potential pause or short-term correction. Meanwhile, the Stochastic Oscillator shows a reading of 78.47 and 69.76, suggesting the pair is approaching overbought territory. This raises the likelihood of a near-term pullback or consolidation phase before any renewed push higher. Should EUR/USD sustain momentum above 1.13110, the next major resistance lies around 1.1500, followed by the psychological 1.2000 zone. However, a breakdown below 1.11564 could open the door to deeper retracements. Overall, technical indicators point to a bullish bias, but with caution warranted as overbought conditions begin to emerge.


    Final Words about EUR vs USD
    In summary, the EUR/USD currency pair remains at a critical juncture, shaped by a combination of encouraging Eurozone data and looming U.S. monetary policy developments. While recent economic releases suggest underlying strength in the Euro area, particularly in consumer activity and GDP stability, concerns such as rising German unemployment and anticipated Fed commentary introduce an element of uncertainty. Technically, the pair maintains a bullish structure above key support, though overbought signals on the Stochastic Oscillator and flattening Parabolic SAR suggest the potential for a short-term pause or correction. As markets await further direction from upcoming U.S. policy statements, traders should remain vigilant, balancing the current bullish outlook with the possibility of near-term volatility.


    05.28.2025

  2. #52
    Junior Member
    Join Date
    Oct 2024
    Posts
    54
    Bitcoin Price Analysis: BTC/USD Daily Outlook and Market Sentiment


    Introduction to BTC-USD
    The BTCUSD pair, often referred to as Bitcoin-Dollar or simply "Bitcoin against the dollar," reflects the value of Bitcoin relative to the United States dollar. It is one of the most watched and traded cryptocurrency pairs in the financial markets. Traders use BTC/USD to speculate on Bitcoin’s price movement, hedge their digital assets, or simply to convert BTC into USD. Given Bitcoin's decentralized nature and the USD’s global dominance, this pair offers unique volatility and opportunity for both short-term and long-term traders.


    BTCUSD Market Overview
    BTC USD has recently reached a new all-time high and is now undergoing a technical correction, showing signs of retesting previous breakout zones. On the macroeconomic front, several U.S. economic indicators are adding layers of complexity to this correction phase. The most recent API and EIA crude and natural gas inventory data, set to be released in early June, are likely to influence USD strength through energy-linked inflation expectations. Furthermore, multiple upcoming speeches by key Federal Reserve FOMC members, including Barkin, Goolsbee, and Kugler, may provide forward guidance on monetary policy. These events come amidst a backdrop of mixed GDP and labor market signals, including stable but lagging jobless claims and a moderately optimistic housing sector. All of this suggests that while the USD has moments of strength, BTC remains in a longer-term bullish structure, but with temporary volatility.


    BTC/USD Technical Analysis
    On the daily timeframe, BTC-USD is currently testing the 0.382 Fibonacci expansion level around $108,822 after pulling back from its recent all-time high near $124,050. This area also coincides with a key psychological and structural resistance turned support, making it a critical level to hold for bulls. Price action shows a classic retest pattern, suggesting that the market may attempt to establish a new support base before continuation. However, momentum indicators such as the Stochastic Oscillator show bearish divergence – prices made a higher high, but the oscillator did not – hinting at possible short-term weakness. The Fisher Transform has also started to curve downward, reinforcing the idea of a potential consolidation or deeper retracement. Meanwhile, the Parabolic SAR dots have flipped above price, signaling a bearish bias, and the Alligator indicator lines are beginning to converge, which typically precedes periods of lower volatility or a reversal.


    Final Words about BTC vs USD
    BTC-USD remains in a broad uptrend despite the recent pullback, and its ability to hold above the 0.382 Fibonacci level will be crucial for maintaining bullish momentum. While fundamentals surrounding the U.S. economy may provide temporary boosts to the USD, Bitcoin’s macro narrative of digital scarcity and institutional interest continues to support the long-term uptrend. Traders should monitor key support levels, divergences in oscillators, and any changes in the tone of upcoming Fed speeches for directional cues. Risk management remains essential, especially with heightened volatility expected ahead of economic data releases and central bank commentaries. In conclusion, while short-term corrections are healthy, Bitcoin remains well-positioned for further gains if the technical structure holds.


    05.29.2025

  3. #53
    Junior Member
    Join Date
    Oct 2024
    Posts
    54
    USD/CHF Daily Analysis: Technical Indicators and Fundamental Outlook


    Introduction to USD-CHF
    The USDCHF currency pair, often nicknamed the "Swissie," represents the exchange rate between the US Dollar and the Swiss Franc. This pairing is widely traded by forex traders due to its reputation as a safe haven during economic uncertainty. The Swiss Franc is highly influenced by economic conditions in Switzerland, while the US Dollar is sensitive to US economic data and monetary policy decisions. Understanding the behavior of USD/CHF helps traders capitalize on trends and volatility in global financial markets.


    USDCHF Market Overview
    USD CHF currently faces volatility influenced by key economic announcements from both the US and Switzerland. Recent events include speeches by prominent Federal Reserve members, such as Jerome Powell, Christopher Waller, Austan Goolsbee, and Lorie Logan, who have indicated continued monitoring of inflation and monetary policy strategies, potentially hinting at more hawkish moves to manage economic growth and inflation. Furthermore, manufacturing PMI data from S&P Global and ISM suggests moderate industrial activity in the US, slightly bolstering the dollar. On the Swiss side, upcoming retail sales data and PMI readings may also influence the Swiss Franc by indicating the health of consumer spending and economic activity. Overall, traders should expect heightened volatility due to the interplay of these economic indicators and central bank communications.


    USD/CHF Technical Analysis
    Technically, the USD-CHF pair has experienced a sharp downturn followed by a partial recovery. After encountering strong resistance around the 0.83688 level, the price retraced downward and currently tests an H4 support line. Should the support hold and price rebound, immediate resistance at 0.83688 would be the next significant target, followed by the descending trend resistance line. Conversely, if the H4 support line breaks, the price may decline further toward the longer-term trend support line. The Parabolic SAR indicator currently shows bearish sentiment, the Fisher oscillator is negative, indicating selling pressure, and the Stochastic RSI suggests a potential reversal upwards in the short term due to oversold conditions.


    Final Words about USD vs CHF
    In conclusion, the USD CHF pair is navigating through critical technical and fundamental junctures. Traders should closely watch the upcoming economic data releases and central bank speeches to gauge market direction. Given the current mixed signals from indicators and price action, prudent risk management and flexibility in trading strategies are advised. Monitoring the identified resistance and support levels will be crucial for deciding entry and exit points in the coming sessions.


    06.02.2025

  4. #54
    Junior Member
    Join Date
    Oct 2024
    Posts
    54
    Navigating USD-JPY Daily Price Movements


    Introduction to USD/JPY
    The USDJPY currency pair, often called the "Gopher," measures the value of the U.S. dollar against the Japanese Yen. It's one of the most traded pairs globally, essential for traders focused on Asia-Pacific markets. This pair typically reflects investor sentiment on global economic stability, with the Yen often regarded as a safe-haven currency. Analyzing USD/JPY is critical for forex traders due to its high liquidity and sensitivity to geopolitical and economic events.


    USDJPY Market Overview
    Currently, USD-JPY is responding to significant economic indicators from both the United States and Japan. Recent U.S. employment reports, including Non-Farm Payrolls (NFP), labor inflation rates, and unemployment rates, remain crucial in shaping market sentiment. Traders anticipate upcoming consumer credit data from the Federal Reserve, which could further influence USD strength by indicating consumer confidence levels. On the Japanese front, consumer spending data and the composite index from Japan's Cabinet Office suggest economic stability, affecting Yen strength. The market sentiment is cautious, with traders closely monitoring the forthcoming U.S. Treasury report on currency manipulation for further direction.


    USD-JPY Technical Analysis
    On the daily chart, USD/JPY is moving towards a critical resistance zone. Recent divergence between the lows on the H4 timeframe suggests potential upward momentum. The descending trendline and marked resistance zones above current levels are key targets traders should monitor closely. Bollinger Bands currently indicate a consolidation, with the price hovering around the median, hinting at an upcoming volatility spike. Additionally, the Fisher oscillator remains neutral, whereas the RSI sits near 47, reflecting indecision in market sentiment and highlighting a potential reversal if bullish momentum strengthens.


    Final Words on USD vs JPY
    Given the current technical setup and economic context, USD/JPY may experience heightened volatility around resistance levels. Traders should closely monitor employment and inflation data from the U.S. alongside consumer spending figures from Japan. The pair might witness bullish attempts toward key resistance zones; however, significant breakthroughs would require supportive macroeconomic data. Investors should maintain cautious positions, employing robust risk management strategies as the market awaits further economic confirmations.


    06.06.2025

Page 6 of 6 FirstFirst ... 4 5 6

Bookmarks

Posting Permissions

  • You may not post new threads
  • You may not post replies
  • You may not post attachments
  • You may not edit your posts
  •