Page 4 of 5 FirstFirst ... 2 3 4 5 LastLast
Results 31 to 40 of 41
Like Tree1Likes

Daily Market Analysis and Overview by Unitedpips

This is a discussion on Daily Market Analysis and Overview by Unitedpips within the Analytics and News forums, part of the Trading Forum category; EUR vs CHF: Insights on Today’s Price Action Introduction to EUR/CHF The EUR/CHF pair, also known as the Euro-Swissy, reflects ...


  1. #31
    Junior Member
    Join Date
    Oct 2024
    Posts
    41
    EUR vs CHF: Insights on Today’s Price Action


    Introduction to EUR/CHF
    The EUR/CHF pair, also known as the Euro-Swissy, reflects the exchange rate between the Euro and the Swiss Franc. As one of the most stable forex pairs, EUR/CHF attracts traders seeking security amidst market volatility. The Swiss Franc, being a safe-haven currency, often moves inversely with global risk sentiment, while the Euro mirrors broader economic conditions in the Eurozone. Understanding this pair provides key insights into risk and stability dynamics in the global financial market.


    EURCHF Market Overview
    The EURCHF pair is currently experiencing cautious trading amidst mixed global economic indicators. Retail sales data in Switzerland revealed no surprises but maintained steady optimism, strengthening the Franc slightly. On the Euro side, holiday liquidity constraints due to Italy's Epiphany Day and lower-than-expected PMI readings weigh on the Euro’s momentum. Upcoming releases such as Germany's CPI later in the month and retail sales data will be crucial in driving further direction. Today, reduced liquidity and speculative trading could dominate the pair, with traders watching for signs of breakout or retracement. Sentiment remains mixed, with the Swiss Franc benefiting from its safe-haven appeal amidst subdued Eurozone growth signals.

    EUR CHF Technical Analysis
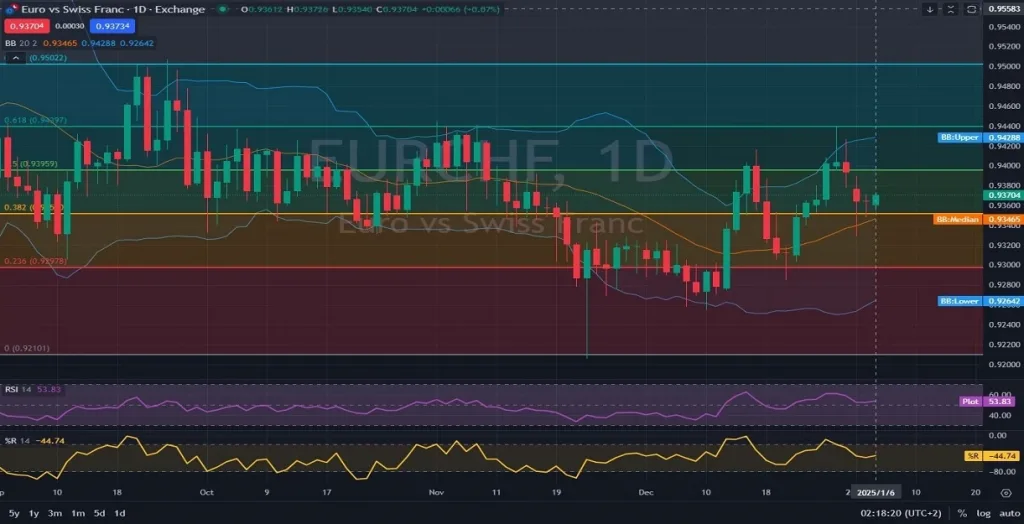
    On the daily chart, EUR CHF is consolidating near the 0.9370 level, approaching key resistance at the 0.9420 area, marked by the upper Bollinger Band. The price rebounded after testing the middle Bollinger Band and is hovering near the 0.382 Fibonacci retracement level, which previously acted as a critical resistance. Despite this, the EUR-CHF pair struggles to breach this level convincingly. The RSI remains moderately bullish at 53.8, indicating neutral momentum, while the %R oscillator shows a slight inclination toward oversold territory, reflecting cautious buying pressure. Should the price break above 0.9420, it could signal further upside toward the 0.9500 psychological level. However, a failure to hold above the middle Bollinger Band at 0.9340 may prompt a retest of the 0.9200 support zone.

    Final Words about EUR vs CHF
    The EURCHF pair exhibits a cautious trading pattern, influenced by mixed economic indicators and liquidity constraints in the Eurozone. Traders should closely monitor the 0.9420 resistance and 0.9340 support levels for potential breakout signals. With the Swiss Franc holding firm amidst global uncertainties, any upside in the EUR CHF pair will depend heavily on stronger Eurozone economic data. Additionally, upcoming CPI and retail sales releases will play a pivotal role in shaping the pair’s medium-term trajectory. Risk management remains key as the EUR CHF forex pair hovers in a range, reflecting indecisiveness in the broader market sentiment.


    01.06.2025

  2. #32
    Junior Member
    Join Date
    Oct 2024
    Posts
    41
    Comprehensive EUR/USD Technical and fundamental Review


    Introduction to EUR/USD
    The EUR/USD pair, often referred to as "Fiber" by traders, represents the exchange rate between the Euro and the US Dollar. As the most traded currency pair in the forex market, EUR USD is pivotal for investors and traders worldwide. This pair reflects the economic health and monetary policies of both the Eurozone and the United States. Understanding the dynamics of EURUSD is essential for making informed trading and investment decisions.


    EURUSD Market Overview
    Currently, the EUR/USD pair is navigating a complex market environment influenced by recent economic data releases and global trends. On the Euro side, the Core CPI Flash Estimate remained steady at 2.7% year-over-year, while the overall CPI Flash Estimate rose to 2.4% from the expected 2.2%. Additionally, Italy's Preliminary CPI for the month showed a modest increase of 0.3%, surpassing expectations of 0.0%, and the unemployment rate held steady at 6.3%. On the US side, the ISM Services PMI rose to 53.5 from 52.1, indicating expansion in the services sector, although JOLTS Job Openings slightly decreased to 7.73 million from 7.74 million. These mixed economic indicators suggest a cautious yet optimistic outlook for the EUR/USD pair, with potential volatility expected in the coming days as traders digest the latest data.


    EUR USD Technical Analysis
    Analyzing the daily chart of EUR/USD reveals a technical landscape marked by a recent bearish wave, from which the pair appears to be recovering. The 100-day Moving Average (MA) is positioned well above the current price level, indicating a strong support zone. The Relative Strength Index (RSI) is approaching 44 and has initiated a bullish wave, suggesting increasing buying momentum. Recently, EUR-USD has formed two consecutive bullish candles on the daily timeframe, signaling the potential onset of a bullish trend. Additionally, key support and resistance levels are being closely watched by traders to gauge the pair's next move. The combination of these technical indicators points towards a possible upward trajectory, though traders should remain vigilant for any signs of reversal.


    Final Words about EUR vs USD
    In conclusion, the EUR/USD pair is currently at a pivotal juncture, balancing between recovering from a bearish phase and the potential for a bullish resurgence. The latest economic data presents a mixed picture, with stable inflation figures in the Eurozone and a slightly improved services sector in the US. Technical indicators such as the RSI and MA100 are hinting at a possible upward trend, supported by recent bullish price action. However, traders should remain cautious and monitor key support and resistance levels, as well as upcoming economic releases, to navigate potential volatility. Strategic risk management and staying informed about both Eurozone and US economic developments will be crucial for successfully trading the EUR/USD pair in the near term.


    01.07.2025

  3. #33
    Junior Member
    Join Date
    Oct 2024
    Posts
    41
    AUD/USD Daily Analysis: Key Support and Resistance Levels


    Introduction to AUD/USD
    The AUD/USD forex pair, often called "The Aussie," reflects the exchange rate between the Australian dollar and the US dollar. This pair’s daily forecast is heavily influenced by commodity prices, especially metals and energy, as well as global risk sentiment due to Australia’s export-driven economy. Traders closely monitor this pair as it offers opportunities to capitalize on economic divergences between the US and Australia. Its liquidity and responsiveness to global events make it one of the most popular pairs in forex trading.


    AUD USD Market Overview
    The AUD/USD daily news outlook tells us the pair has been under pressure recently, reflecting broader global trends. On the Australian front, CPI data remains a key focus, with the next release on January 29, 2025, expected to shed light on inflationary pressures and guide the Reserve Bank of Australia's (RBA) monetary policy stance. Inflation stability could lead to a more dovish or cautious approach from the RBA, potentially weakening the AUD. On the US side, data such as ADP employment and weekly jobless claims, coupled with hawkish Federal Reserve commentary, have been bolstering the US dollar's strength. The anticipation of robust US labor market data has pushed the greenback higher, weighing on risk-sensitive currencies like the AUD. With global risk sentiment remaining fragile and commodity markets showing limited upside, the Aussie dollar has struggled to gain traction.

    AUD-USD Technical Analysis
    The AUD/USD daily(1D) chart shows the pair trading in a well-defined downtrend, with Bollinger Bands signaling extended price volatility. The AUDUSD price is currently trading near the lower Bollinger Band, suggesting that bearish pressure dominates but may also hint at potential oversold conditions. The volume oscillator reflects a recent surge in selling volume, confirming the Aussie’s prevailing bearish sentiment. Resistance is seen at 0.6300, while support lies around 0.6200. Unless the pair breaches the upper Bollinger Band near 0.6350, any recovery attempts are likely to remain capped. Traders should watch for a continuation of the downward trend if the pair breaks below the key support level.


    Final Words about AUD vs USD
    The AUD/USD daily overview suggests that the Aussie continues to face headwinds due to a combination of strong US economic indicators and weaker Australian fundamentals. A break below the 0.6200 support level could lead to further declines, opening the way to test new lows. However, traders should remain cautious of potential reversals if global risk sentiment improves or commodity prices rise significantly. Keeping an eye on upcoming Australian CPI data and US labor market reports is crucial for identifying directional cues. For now, the US dollar appears to maintain an upper hand against the Aussie, with the pair’s daily technical analysis pointing to sustained bearish momentum in the near term.

    01.08.2025

  4. #34
    Junior Member
    Join Date
    Oct 2024
    Posts
    41
    EURCAD Daily Analysis: Bearish Pressure Dominates the Market


    Introduction to EUR/CAD
    The EUR/CAD currency pair, representing the Euro against the Canadian Dollar, is a significant cross-currency pair in the forex market. It reflects the strength of the Eurozone's economy relative to Canada, with influences from commodities like oil affecting CAD performance due to Canada's status as a leading oil exporter. Traders frequently refer to EUR/CAD as a "commodity cross-pair" because of its sensitivity to global oil price movements and Eurozone economic data.


    EUR CAD Market Overview
    The EUR/CAD daily(1D) news outlook, suggests that the pair is navigating a period of consolidation amidst mixed economic signals from both the Eurozone and Canada. For the Euro, upcoming releases like French consumer spending data and industrial output figures could provide vital insights into the bloc's economic health. These indicators will likely influence the EURCAD daily forecast, especially given that consumer spending is a key driver of economic activity. Meanwhile, Canadian employment and unemployment data scheduled for release in early February are expected to guide CAD movements. As a commodity-linked currency, CAD may also be influenced by any shifts in global oil prices, which have remained relatively stable over the past few days. Today’s market focus includes how both economies are responding to broader global inflationary pressures and consumer spending trends.


    EUR/CAD Technical Analysis
    The daily(1D) EUR/CAD chart reveals a complex interplay between the pair’s price action, the Ichimoku cloud, and the MACD indicator. The Ichimoku cloud suggests bearish sentiment, with the price trading below the Kumo cloud, a sign of downward pressure. The Tenkan-sen and Kijun-sen lines are also pointing downward, further supporting EURCAD’s bearish outlook. On the MACD, the histogram shows negative momentum, and the MACD line is below the signal line, signaling continued selling pressure. Key support is observed at the 1.4748 level, while resistance lies around 1.4908. The price currently appears indecisive near the support level, suggesting a potential breakout or consolidation phase. Traders should watch for confirmations before taking positions.


    Final Words About EUR vs CAD
    The EUR/CAD daily review shows the pair as remaining poised at a critical juncture, with fundamental and technical factors offering mixed signals. On the one hand, the Euro could find support if consumer spending data surpasses expectations, while stronger Canadian employment figures could bolster CAD strength. The EURCAD daily technical analysis indicates its bearish bias, but the support level at 1.4748 could trigger a rebound. Traders should closely monitor the MACD for further bearish or bullish crossovers and the Ichimoku cloud for any signs of reversal. Staying informed about oil price fluctuations will also be key for CAD traders. As always, risk management and position sizing are crucial in navigating the volatility of this cross-pair.


    01.10.2025

  5. #35
    Junior Member
    Join Date
    Oct 2024
    Posts
    41
    Daily NZDUSD Analysis: Kiwi Faces Bearish Pressure


    Introduction to NZD/USD
    The NZD/USD currency pair, often referred to by traders as the “Kiwi,” represents the exchange rate between the New Zealand Dollar (NZD) and the United States Dollar (USD). As one of the major currency pairs in forex trading, it provides valuable insights into economic dynamics between the US and New Zealand. The Kiwi is heavily influenced by global risk sentiment, commodity prices, and central bank policies in both countries.


    NZDUSD Market Overview
    The NZDUSD pair is currently experiencing a bearish trend, as shown in the daily analysis. Recent news from the US highlights key economic updates, with the Treasury Budget revealing a significant government spending deficit. A higher-than-expected deficit generally favors the USD, adding to the pair's downward pressure. Meanwhile, New Zealand's latest Building Permits report pointed to a decline in approvals, reflecting potential economic softening in the construction sector. This data indicates a weakening Kiwi, particularly as construction plays a pivotal role in New Zealand's economic activity. Traders are advised to monitor upcoming economic releases such as the Treasury Budget Statement in February for the USD and New Zealand’s next round of building permits in early February.

    NZD/USD Technical Analysis
    On the technical front, the NZD/USD pair is firmly within a bearish trend channel on the daily chart. The NZD USD price currently trades in the lower half of the Bollinger Bands, signaling strong downside momentum. It is moving between the 0.786 and 1.0 Fibonacci retracement levels, reflecting significant bearish sentiment. The RSI sits near 32, hovering close to the oversold territory, suggesting that the downward movement may slow but is not yet reversing. The Williams %R indicator is also deeply negative, reinforcing the bearish outlook. Key support levels can be seen at 0.5520, while immediate resistance lies near the 0.5638 level, the median Bollinger Band. Any break below the 0.5520 level could accelerate the bearish momentum.


    Final Words about NZD vs USD
    In conclusion, the NZD/USD pair is likely to remain under pressure in the short term as fundamental and technical factors align in favor of the USD. The weakening New Zealand economic indicators, coupled with the stronger dollar driven by concerns over the US budget deficit, are likely to keep the NZD-USD pair in a downward trajectory. Traders should watch for potential consolidation at the current support levels and remain cautious of any unexpected economic announcements. Proper risk management is essential in such a volatile environment, as market sentiment can shift rapidly. Keeping a close eye on global trends, commodity prices, and central bank policies will be key for successfully navigating the NZD/USD market.


    01.13.2025

  6. #36
    Junior Member
    Join Date
    Oct 2024
    Posts
    41
    EURUSD Price Action: Technical and Fundamental Insights


    Introduction to EURUSD
    The EURUSD pair, often referred to as "Fiber," represents the exchange rate between the Euro (EUR) and the US Dollar (USD). This major currency pair is one of the most actively traded pairs globally, offering insights into the relative strength of the European and US economies. The EUR/USD forex pair's movements are closely monitored by forex traders due to its significant liquidity and volatility, making it an essential indicator of global economic trends.


    EUR USD Market Overview
    The EUR USD pair is experiencing a strong bearish trend, as global economic developments weigh on its performance. On the USD side, traders are awaiting key releases, including the Producer Price Index (PPI) and insights from Federal Reserve officials, which could shape expectations of US monetary policy. These events could strengthen the dollar if inflationary pressures persist. For the EUR, recent data such as France’s General Budget Outcome and Italy’s Industrial Production figures show a mixed outlook for the Eurozone economy. The Fiber is under pressure, with market participants closely watching the interplay between these contrasting fundamentals. As of today, the EUR-USD pair hovers near multi-month lows, with upcoming economic data likely to provide further direction.


    EUR/USD Technical Analysis
    On the daily chart, EUR/USD remains firmly entrenched in a descending channel, demonstrating continued bearish momentum. The EUR USD price today has touched the lower Bollinger Band and 0.618 Fibonacci retracement level, signaling a possible short-term bounce. The last candle shows bullish pressure, but the overall trend remains bearish. The RSI (14) is currently at 34, suggesting the pair is nearing oversold territory, while the %R indicator also signals oversold conditions. However, these indicators reflect bearish market sentiment, with any upward correction likely to face resistance near the channel's upper boundary and the 0.5 Fibonacci level at 1.0386.


    Final Words about EUR vs USD
    The EURUSD pair continues to face downward pressure, driven by bearish fundamentals and technical indicators. While the recent bullish candle hints at a potential short-term recovery, the broader trend remains to the downside as the EUR/USD pair trades within a well-defined descending channel. Traders should monitor resistance levels at 1.0386 and support near 1.0189 for potential breakout signals. Upcoming economic data from both the US and the Eurozone will likely be decisive in determining the fiber's next direction. Risk management remains crucial, as volatility could increase with the release of high-impact news.


    01.14.2025

  7. #37
    Junior Member
    Join Date
    Oct 2024
    Posts
    41
    USD/JPY Daily Outlook: Bullish Momentum Meets Overbought Signals


    Introduction to USD/JPY
    The USD/JPY currency pair, commonly referred to as the "Gopher," is one of the most actively traded pairs in the forex market. It represents the exchange rate between the US Dollar and the Japanese Yen, reflecting the economic dynamics of two of the largest economies in the world. Due to its high liquidity and volatility, the pair is favored by traders seeking both short-term opportunities and long-term trends.


    USD JPY Market Overview
    The USD/JPY daily fundamental analysis is influenced by recent economic data and upcoming events that shape the forex market's sentiment. In the US, the Consumer Price Index (CPI) figures are in focus, with traders awaiting insights into inflation trends and their potential impact on Federal Reserve monetary policy. Speeches by key Federal Reserve officials, including Thomas Barkin and Neel Kashkari, are expected to provide further clues about interest rate trajectories. On the Japanese side, the Bank of Japan's focus on price stability and corporate goods price index (CGPI) data are critical for assessing inflationary pressures in Japan. Recent trends suggest that while the USD retains strength due to hawkish Fed sentiment, the JPY faces challenges from relatively loose monetary policies. These developments set the stage for volatility as traders position themselves ahead of crucial economic releases.

    USD-JPY Technical Analysis
    On the USD/JPY daily chart, it is trading near a significant resistance level around 158.00, with Ichimoku Cloud analysis highlighting a potential consolidation phase. The Gopher’s price action is trading above the cloud, which is generally a bullish signal; however, the proximity to resistance suggests caution. The Tenkan-Sen (blue line) is above the Kijun-Sen (red line), confirming upward momentum, but the lagging span (Chikou Span) is nearing a critical level. The Stochastic RSI indicates that the pair is in overbought territory, with potential for a corrective pullback if momentum weakens. Key support levels to watch include 155.00, while a break above 158.50 could pave the way for further upside.


    Final Words About USD vs JPY
    The USD/JPY daily analysis shows the pair remains a battleground for traders, influenced by diverging monetary policies and economic data from the US and Japan. With US inflation data and Fed commentary shaping USD sentiment, any surprises could drive sharp movements. On the other hand, the JPY's trajectory will depend on market perception of the Bank of Japan’s ability to manage inflation while supporting growth. The pair’s technical outlook shows signs of bullish momentum, but overbought conditions suggest a potential pullback. Traders should remain vigilant, tracking support and resistance levels and keeping an eye on global economic developments. In this volatile environment, risk management is key to navigating USDJPY’s price action effectively.


    01.15.2025

  8. #38
    Junior Member
    Join Date
    Oct 2024
    Posts
    41
    GOLD Trading Insights and Key Levels Today


    Introduction to GOLD/USD
    The GOLD/USD pair, often referred to simply as "Gold" or "XAUUSD," represents the value of one ounce of gold in US dollars. It is a critical benchmark for precious metal trading and is influenced by a variety of global economic, political, and financial factors. Traders and investors use XAU/USD to hedge against inflation, currency volatility, and economic uncertainties, making it one of the most actively monitored instruments.


    GOLDUSD Market Overview
    The Gold continues to trend upward in the face of heightened global uncertainty and mixed US economic data. Today’s focus is on the US Retail Sales data, which is expected to provide a clear indication of consumer spending trends, potentially impacting the USD. With the Federal Reserve's recent hawkish signals and upcoming comments from New York Fed President John Williams, the USD's strength might see fluctuations, impacting gold's price. As the dollar stabilizes, gold has maintained its bullish momentum, benefiting from its safe-haven appeal. The global economic outlook, influenced by inflation trends and US labor market data, remains critical for GOLD/USD's trajectory.

    GOLD USD Technical Analysis
    The daily chart of GOLD USD shows a bullish trend as the price trades in the upper half of the Bollinger Bands, frequently touching the upper band, signaling strong upward momentum. The price is attempting to break above the 0.236 Fibonacci retracement level at $2,678.62, a critical resistance zone. The Relative Strength Index (RSI) at 59.25 indicates moderate bullish strength, while the Williams %R oscillator suggests that the price is nearing overbought territory. A potential breakout above the current Fibonacci resistance could propel the price toward $2,700, while support remains near the Bollinger Band median at $2,642.64.


    Final Words about GOLD vs USD
    In conclusion, GOLD-USD is poised for further bullish movement, provided it breaks above the $2,678 resistance. Traders should watch for the US Retail Sales and Jobless Claims data as they will likely influence the USD and indirectly impact gold prices. The combination of technical indicators, including Bollinger Bands and RSI, supports a cautious bullish bias. However, a failure to break key resistance levels could lead to temporary consolidation or retracement. With its safe-haven status intact, gold remains a crucial asset amid global uncertainties.


    01.16.2025

  9. #39
    Junior Member
    Join Date
    Oct 2024
    Posts
    41
    GBPUSD Technical Analysis: Bearish Momentum Persists


    Introduction to GBPUSD
    The GBP/USD currency pair, often referred to as "Cable," represents the exchange rate between the British pound sterling and the US dollar. This pair holds historical significance and is one of the most widely traded currency pairs globally. Traders closely monitor this pair to analyze the relative strength of two of the world’s leading economies, the UK and the US, making it a critical tool for both short-term and long-term trading strategies.


    GBP/USD Market Overview
    The GBPUSD pair remains under pressure within a strong downward trend channel. The latest market news has emphasized economic and political developments on both sides. On the US side, the latest jobless claims data revealed a decline in unemployment filings, signaling robust labor market conditions, which are supportive of the US dollar. In addition, comments expected during the ongoing World Economic Forum from US officials could introduce further volatility. On the UK side, the Confederation of British Industry’s (CBI) survey showed modest optimism, although broader economic challenges persist due to weaker manufacturing output expectations. The divergence between these two economies has kept Cable in a bearish mode, with the pair struggling to gain upside momentum. Looking ahead, traders will also watch for key US crude oil inventory reports, which may indirectly impact broader market sentiment.

    GBP USD Technical Analysis
    On the daily timeframe, GBP/USD is entrenched in a descending trend channel, consistently making lower highs and lower lows. The GBP USD price has rebounded from the lower Bollinger Band and is now trading near the middle band, which coincides with the 0.786 Fibonacci retracement level. This level also aligns with the key %R Fibonacci level, suggesting a strong area of confluence. However, the Bollinger Bands indicate that volatility remains subdued, and the Cable’s inability to break the middle band suggests a lack of bullish conviction. Resistance is evident around 1.2359, while key support sits near the psychological level of 1.2106. Momentum indicators, such as the Williams %R, are still in oversold territory but show signs of potential upward correction. Traders should watch for a breakout from the channel for clearer direction.


    Final Words on GBP vs USD
    The GBP-USD pair continues to reflect the contrasting economic landscapes of the UK and US. While the recent upward correction suggests potential recovery, the overall trend remains bearish. The GBP USD pair must overcome strong resistance at the 0.786 Fibonacci retracement level to shift market sentiment. US economic data, such as crude oil inventories and upcoming jobless claims, could reinforce the dollar’s strength. Meanwhile, the UK’s economic outlook, highlighted by manufacturing struggles, provides limited support for sterling. Traders are advised to monitor global developments, especially central bank commentary at the World Economic Forum, as they could trigger significant price volatility in the short term.


    01.23.2025

  10. #40
    Junior Member
    Join Date
    Oct 2024
    Posts
    41
    EURUSD Technical Indicators Signal Bearish Continuation


    Introduction to EUR/USD
    The EUR/USD pair, also known as "Fiber," is one of the most traded currency pairs in the forex market, representing the exchange rate between the Euro and the US Dollar. As two of the world's most influential currencies, their pairing reflects the strength of the Eurozone's economy versus the United States. Traders and investors closely follow EUR/USD for its liquidity and responsiveness to geopolitical and economic developments.


    EURUSD Market Overview
    The EURUSD pair continues to reflect global economic conditions, showing bearish tendencies amid recent events. Today, traders are eyeing insights from the World Economic Forum in Davos, where discussions on global economic recovery may bring volatility to the markets. Upcoming releases from S&P Global's PMI reports for both the manufacturing and services sectors will further clarify the strength of the economies on either side of the Atlantic. Additionally, ECB President Christine Lagarde is expected to speak later this week, with her comments likely to influence sentiment around the Euro. With the US PMI data also looming, traders anticipate significant swings as the EUR-USD pair struggles to find directional momentum in this high-impact news environment.


    EUR USD Technical Analysis
    The EUR USD daily chart reveals the pair's ongoing struggle to break above key resistance levels amid a long-standing bearish trend. Price action shows a rejection near the 0.786 Fibonacci retracement level, reflecting strong selling pressure. Recent bearish candlesticks suggest difficulty in reversing the downward trend. The Alligator indicator reveals a bearish alignment, with the blue jawline at the top, the red teeth in the middle, and the green lips below. However, the green lips are attempting to cross upward, indicating potential consolidation or a corrective move. MACD and its histogram remain bearish, with the lines trending below the zero level, while the Williams %R indicates oversold conditions but has not yet confirmed a reversal. These indicators collectively point toward continued bearish pressure with possible short-term retracements.


    Final Words on EUR vs USD
    The EUR-USD pair remains under bearish influence, with global economic uncertainties and central bank decisions driving market sentiment. Traders should closely monitor upcoming PMI releases and Christine Lagarde's remarks for potential catalysts. While the technical setup suggests further downward pressure, oversold signals could result in short-term rebounds. Risk management remains essential, as EURUSD is highly sensitive to fundamental developments. Patience is key as the market awaits clearer direction in the coming days.


    01.24.2025

Page 4 of 5 FirstFirst ... 2 3 4 5 LastLast

Bookmarks

Posting Permissions

  • You may not post new threads
  • You may not post replies
  • You may not post attachments
  • You may not edit your posts
  •