
 2Likes
 LinkBack URL
 About LinkBacks


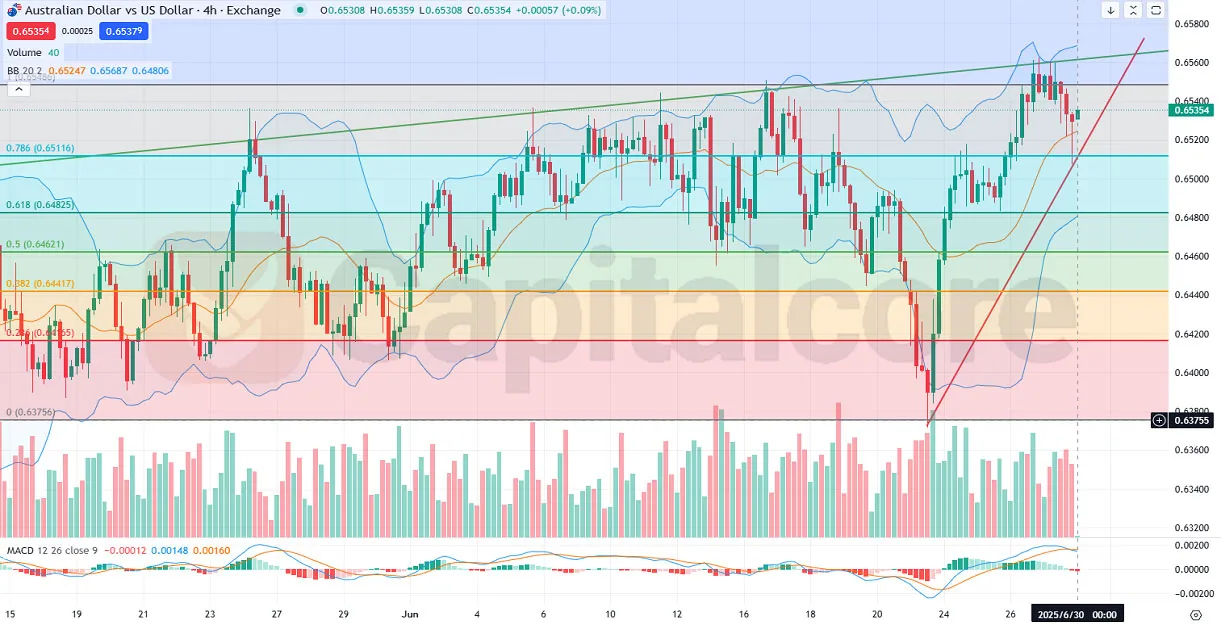
AUDUSD 4H Chart Signals Reversal Potential
The AUD/USD forex pair, commonly known as the "Aussie," is one of the most actively traded pairs in the market, influenced heavily by commodity prices, interest rate expectations, and macroeconomic data from both Australia and the U.S. Todays focus is on the Melbourne Institute CPI and Private Sector Credit releases, which could boost the Australian Dollar if inflation and credit data surprise to the upside. Meanwhile, the U.S. Chicago PMI and speeches from Fed officials Bostic and Goolsbee may strengthen the USD if they adopt a hawkish stance, making today crucial for short-term AUD-USD direction based on these key economic drivers.
Chart Notes:
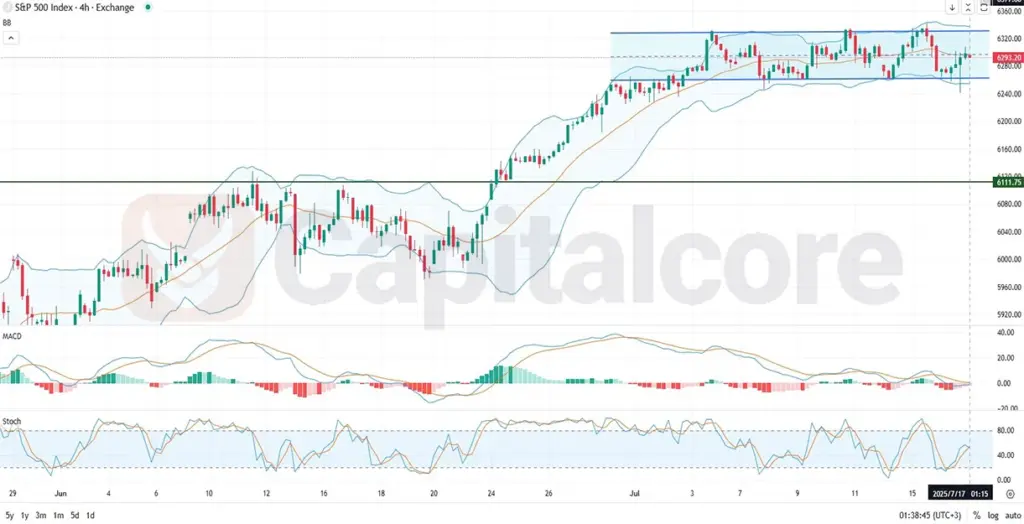
Chart time-zone is UTC (+03:00)
Candles time-frame is 4h.
As observed in the AUD/USD 4-hour chart, the pair has been experiencing a broader bullish trend over the long term, albeit with intermittent corrections. Recently, price action surged strongly from the 0.63755 support zone, aligning with a significant volume increase, and is now retracing slightly after touching the upper boundary of the Bollinger Bands. The latest candle is green and has rebounded from the middle Bollinger Band and the 0.786 Fibonacci retracement level near 0.6511indicating renewed bullish momentum that could drive the AUD USD price toward the upper Bollinger Band and the key psychological resistance at the 1.000 Fibonacci level (~0.6580). However, the recent red volume bars suggest selling pressure, which warrants caution. The MACD line is slightly above the signal line but flattening, while the histogram shows weakening bullish momentumtraders should watch for confirmation before further upside continuation.
DISCLAIMER: Please note that the above analysis is not an investment suggestion by Capitalcore LLC. This post has been published only for educational purposes.
Capitalcore


 Reply With Quote


Bookmarks