
 1Likes
 LinkBack URL
 About LinkBacks


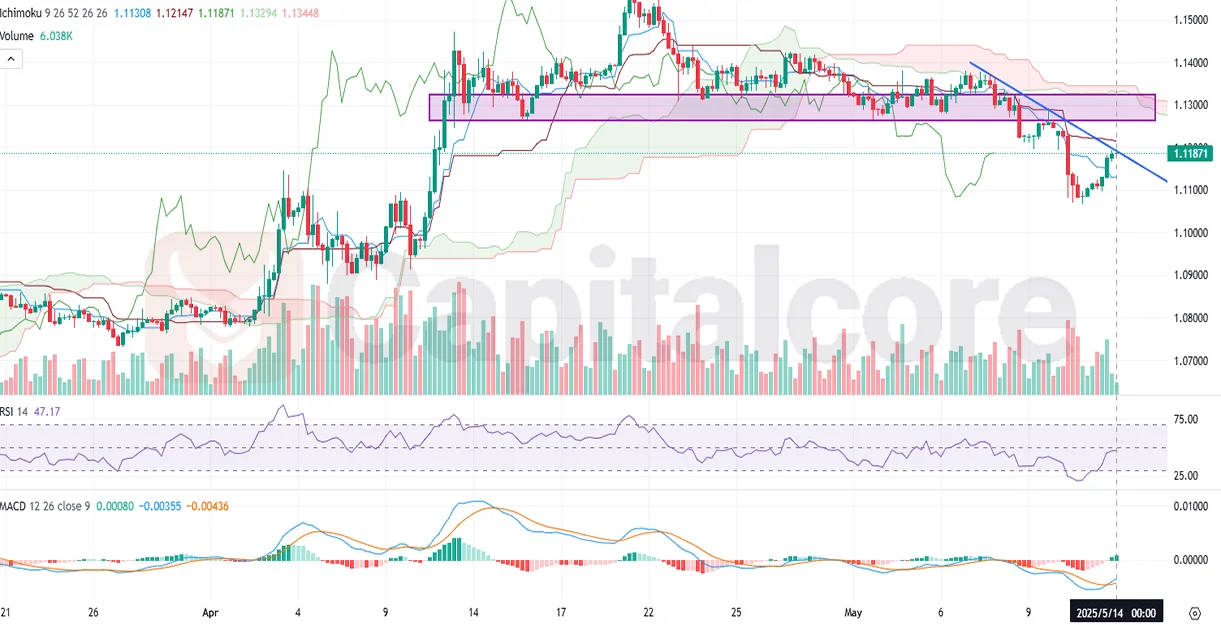
EUR/USD Sensitive to Fundamentals and Technical Resistance
EUR/USD, the currency pair representing the Euro against the US Dollar, remains sensitive today to key economic indicators and central bank commentary from both sides of the Atlantic. From the US, market attention is focused on speeches by FOMC members Jefferson and Waller, whose remarks could provide crucial insights into the Federal Reserves monetary policy trajectory. Additionally, US Crude Oil Inventories came in line with expectations at -2.0 million barrels, maintaining pressure on oil prices and indirectly influencing inflation expectations and USD strength. On the European front, German Final CPI month-over-month met expectations at 0.4%, indicating stable inflationary pressures in Europe's largest economy. Meanwhile, remarks from Bundesbank President Nagel and outcomes from the German 30-year bond auction, yielding 2.90% versus the prior 1.7%, hint at evolving investor sentiment and economic outlook in the Eurozone. Overall, these developments, combined with cautious tones from both central banks, are likely to keep EUR/USD traders vigilant for further directional signals.
Chart Notes:
Chart time-zone is UTC (+03:00)
Candles time-frame is 4h.
Analyzing the EUR/USD H4 chart, the price is currently encountering significant resistance around the 1.12501.1300 area, a zone that previously acted as strong support and has now become a critical resistance level after the recent bearish breakout. A descending trendline further emphasizes bearish sentiment, suggesting potential downward pressure ahead. The RSI is gradually rising but remains below the neutral level of 50, indicating limited bullish strength at this moment. Simultaneously, the MACD histogram is shrinking with a potential bullish crossover on the horizon, signaling weakening bearish momentum. Traders should closely monitor the price reaction at the resistance area around 1.1300; a confirmed breakout above this level and the descending trendline could lead to renewed bullish momentum. However, a rejection here may reinforce bearish sentiment, pushing the pair towards recent lows.
DISCLAIMER: Please note that the above analysis is not an investment suggestion by Capitalcore LLC. This post has been published only for educational purposes.
Capitalcore


 Reply With Quote


Bookmarks