
 1Likes
 LinkBack URL
 About LinkBacks


SILVERUSD Price Action and Resistance Levels Analysis
The SILVER/USD pair, also known as XAG/USD, represents the value of silver in terms of US dollars. Silver, often referred to as "the poor man's gold," is a widely traded precious metal that serves as both a safe-haven asset and an industrial commodity. Trading this pair provides valuable insights into the global economic outlook, as its price is influenced by factors such as inflation, interest rates, and industrial demand. Todays key USD-related news, including Residential Building Permits and Housing Starts data, could indirectly impact SILVERUSD. Strong results could strengthen the USD, creating downward pressure on silver prices. Additionally, the upcoming Federal Reserve reports on Capacity Utilization and Factory Output may provide further market signals. A stronger-than-expected USD performance could dampen silvers appeal as a hedge against currency depreciation. However, persistent market uncertainty and potential economic slowdowns maintain silver's safe-haven status, suggesting a balanced outlook for the pair in the short term.
Chart Notes:
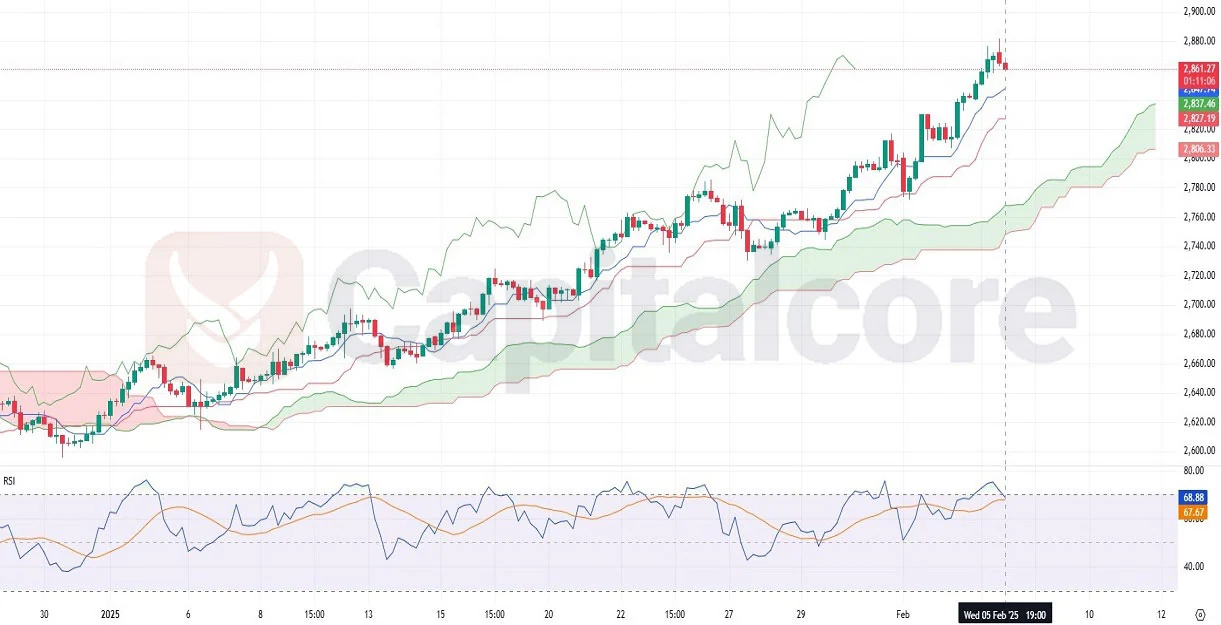
Chart time-zone is UTC (+02:00)
Candles time-frame is 4h.
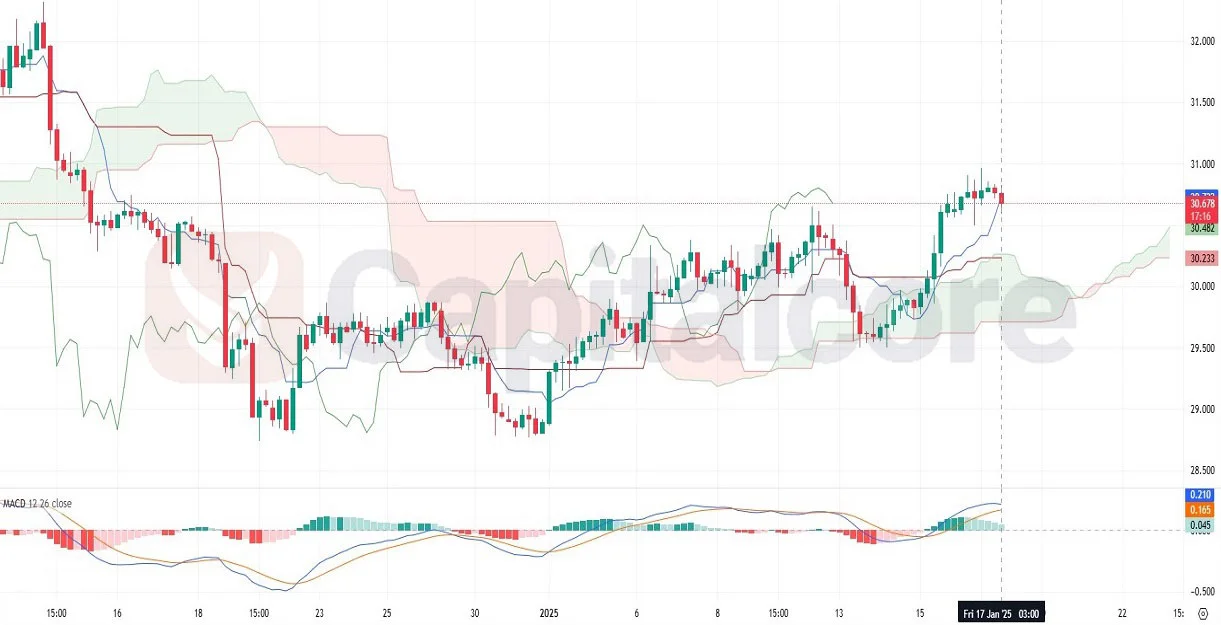
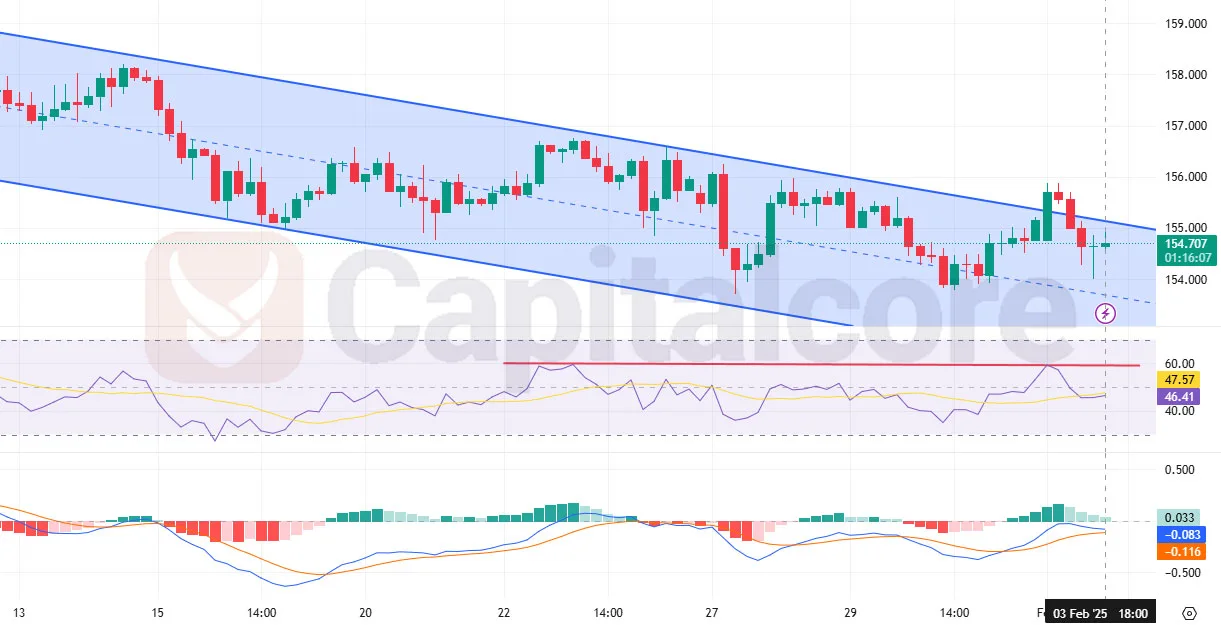
On the H4 chart, SILVER/USD has been in a bullish trend but is now showing signs of a potential reversal. The last two bearish candles suggest reduced buying momentum, while the MACD indicator shows weakening bullish momentum with the histogram approaching neutral levels. Despite this, the price remains above the Ichimoku Cloud, indicating that the uptrend may still hold as support levels remain intact. The thickening cloud provides a strong support zone below the current price. Traders should closely watch for confirmation of a bearish reversal or a continuation of the uptrend, depending on whether the MACD crosses into bearish territory and price action breaks below the cloud.
DISCLAIMER: Please note that the above analysis is not an investment suggestion by Capitalcore LLC. This post has been published only for educational purposes.
Capitalcore


 Reply With Quote


 ]
]

Bookmarks